29
Edulcorantes Artificiales en el Tratamiento de la Obesidad: Qué dice la evidencia?? Dra. Catalina Fuentes G Nutrióloga Hospital Clínico FACh Clínica las Lilas
Edulcorantes Artificiales en el Tratamiento de la Obesidad:
Qué dice la evidencia??
Dra. Catalina Fuentes G Nutrióloga Hospital Clínico FACh
Clínica las Lilas
Placer por lo dulce, azúcar y obesidad
Edulcorantes artificiales: no tan rápido!
Mecanismos propuestos para el “daño”
Evidencia actual
Conclusiones

El ser humano nace con una fuerte preferencia por el sabor dulce….
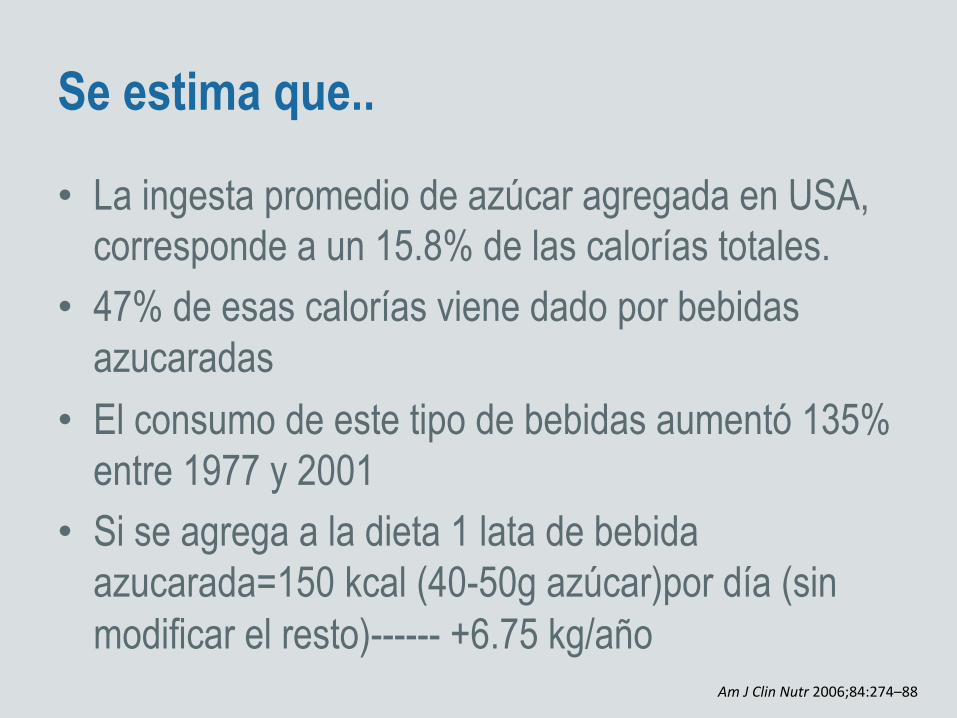
Se estima que..
• La ingesta promedio de azúcar agregada en USA, corresponde a un 15.8% de las calorías totales.
• 47% de esas calorías viene dado por bebidas azucaradas
• El consumo de este tipo de bebidas aumentó 135% entre 1977 y 2001
• Si se agrega a la dieta 1 lata de bebida azucarada=150 kcal (40-50g azúcar)por día (sin modificar el resto)------ +6.75 kg/año
Am J Clin Nutr 2006;84:274–88
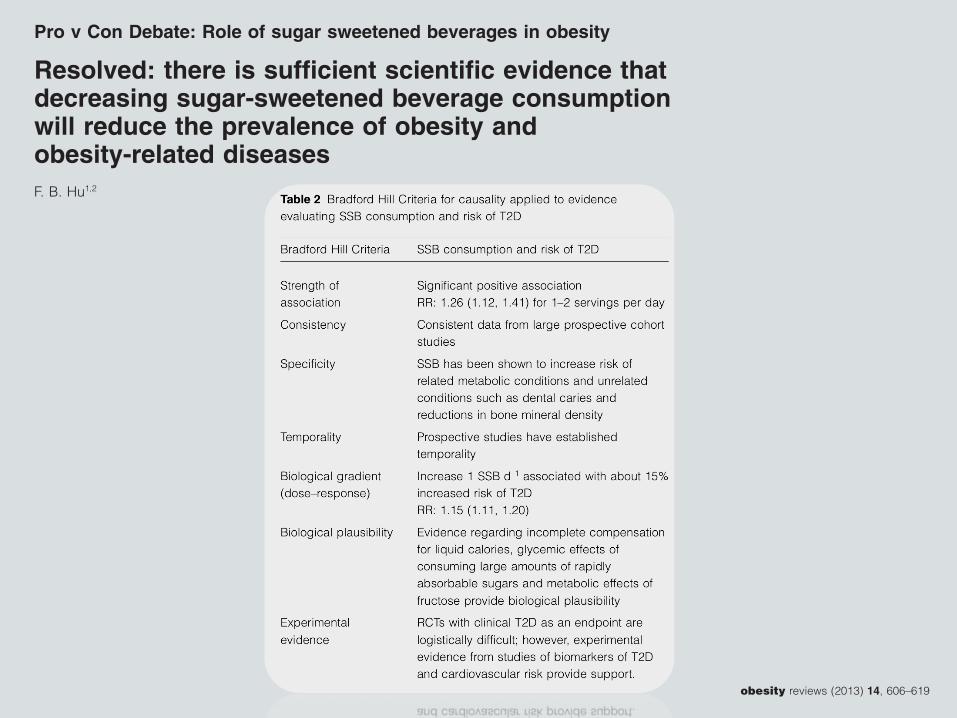
Pro v Con Debate: Role of sugar sweetened beverages in obesity
Resolved: there is sufficient scientific evidence thatdecreasing sugar-sweetened beverage consumptionwill reduce the prevalence of obesity andobesity-related diseasesF. B. Hu1,2
1Departments of Nutrition and Epidemiology,
Harvard School of Public Health, Boston, MA,
USA; 2Channing Division of Network
Medicine, Department of Medicine, Brigham
and Women’s Hospital, Harvard Medical
School, Boston, MA, USA
Received 17 March 2013; revised 1 April
2013; accepted 1 April 2013
Address for correspondence: FB Hu,
Department of Nutrition, Harvard School of
Public Health, 665 Huntington Ave, Boston,
MA 02115, USA.
E-mail: [email protected]
SummarySugar-sweetened beverages (SSBs) are the single largest source of added sugar andthe top source of energy intake in the U.S. diet. In this review, we evaluate whetherthere is sufficient scientific evidence that decreasing SSB consumption will reducethe prevalence of obesity and its related diseases. Because prospective cohortstudies address dietary determinants of long-term weight gain and chronic dis-eases, whereas randomized clinical trials (RCTs) typically evaluate short-termeffects of specific interventions on weight change, both types of evidence arecritical in evaluating causality. Findings from well-powered prospective cohortshave consistently shown a significant association, established temporality anddemonstrated a direct dose–response relationship between SSB consumption andlong-term weight gain and risk of type 2 diabetes (T2D). A recently publishedmeta-analysis of RCTs commissioned by the World Health Organization foundthat decreased intake of added sugars significantly reduced body weight (0.80 kg,95% confidence interval [CI] 0.39–1.21; P < 0.001), whereas increased sugarintake led to a comparable weight increase (0.75 kg, 0.30–1.19; P = 0.001). Aparallel meta-analysis of cohort studies also found that higher intake of SSBsamong children was associated with 55% (95% CI 32–82%) higher risk of beingoverweight or obese compared with those with lower intake. Another meta-analysis of eight prospective cohort studies found that one to two servings per dayof SSB intake was associated with a 26% (95% CI 12–41%) greater risk ofdeveloping T2D compared with occasional intake (less than one serving permonth). Recently, two large RCTs with a high degree of compliance providedconvincing data that reducing consumption of SSBs significantly decreases weightgain and adiposity in children and adolescents. Taken together, the evidence thatdecreasing SSBs will decrease the risk of obesity and related diseases such as T2Dis compelling. Several additional issues warrant further discussion. First, preven-tion of long-term weight gain through dietary changes such as limiting consump-tion of SSBs is more important than short-term weight loss in reducing theprevalence of obesity in the population. This is due to the fact that once anindividual becomes obese, it is difficult to lose weight and keep it off. Second, weshould consider the totality of evidence rather than selective pieces of evidence(e.g. from short-term RCTs only). Finally, while recognizing that the evidence ofharm on health against SSBs is strong, we should avoid the trap of waiting forabsolute proof before allowing public health action to be taken.
Keywords: Diabetes, nutrition, obesity, sugar-sweetened beverages.
obesity reviews (2013) 14, 606–619
obesity reviews doi: 10.1111/obr.12040
606 © 2013 The Authorobesity reviews © 2013 International Association for the Study of Obesity14, 606–619, August 2013

Fácil: cambiemos las bebidas por agua!
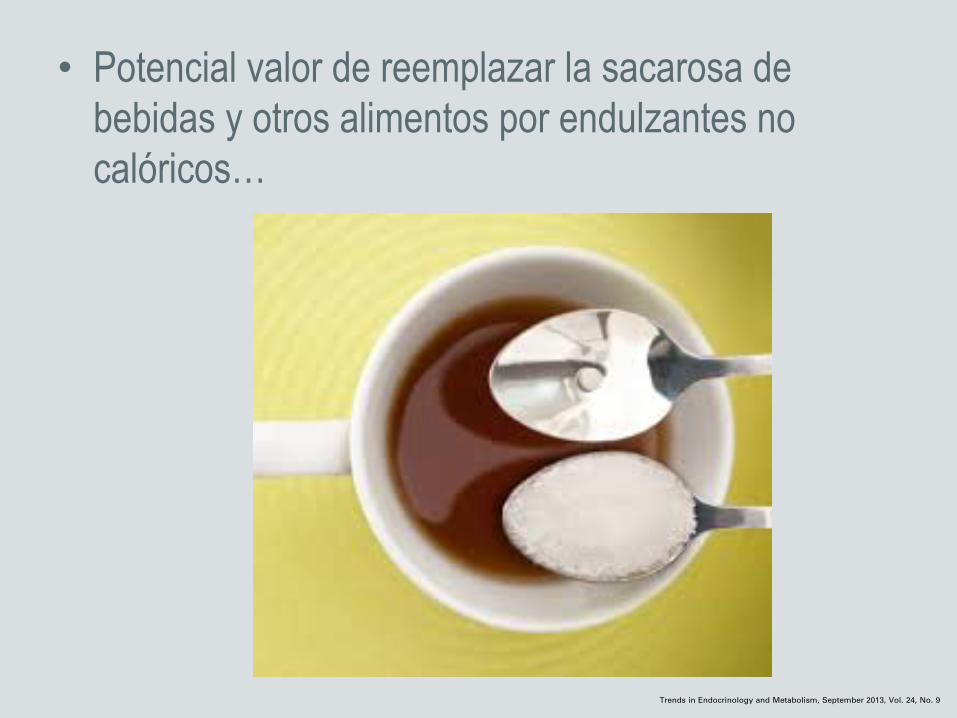
• Potencial valor de reemplazar la sacarosa de bebidas y otros alimentos por endulzantes no calóricos…
Artificial sweeteners produce thecounterintuitive effect of inducingmetabolic derangementsSusan E. Swithers
Department of Psychological Sciences and Ingestive Behavior Research Center, Purdue University, 703 Third Street, WestLafayette, IN 47907, USA
The negative impact of consuming sugar-sweetenedbeverages on weight and other health outcomes hasbeen increasingly recognized; therefore, many peoplehave turned to high-intensity sweeteners like aspar-tame, sucralose, and saccharin as a way to reduce therisk of these consequences. However, accumulating evi-dence suggests that frequent consumers of these sugarsubstitutes may also be at increased risk of excessiveweight gain, metabolic syndrome, type 2 diabetes, andcardiovascular disease. This paper discusses these find-ings and considers the hypothesis that consumingsweet-tasting but noncaloric or reduced-calorie foodand beverages interferes with learned responses thatnormally contribute to glucose and energy homeostasis.Because of this interference, frequent consumption ofhigh-intensity sweeteners may have the counterintuitiveeffect of inducing metabolic derangements.
Sweeteners and healthConsumption of sugar-sweetened beverages (SSB; seeGlossary) has been increasingly associated with negativehealth outcomes such as being overweight, obesity, type 2diabetes (T2D), and metabolic syndrome, for reviews, see[1–5]. Based largely on these associations, many research-ers and healthcare practitioners have proposed that non-caloric, high-intensity sweeteners provide a beneficialalternative in foods and beverages [6–10].There is nodoubt that replacing caloric with noncaloric sweetenersreduces the energy density of foods and beverages. How-ever, whether reducing energy density in this manneralways translates into reduced energy intake, lower bodyweight, and improved metabolic health is much less cer-tain. Recent reviews of studies spanning at least the past40 years have concluded that high-intensity sweetenersare potentially helpful [11], harmful [12], or have as yetunclear effects [9,13–15] with regard to regulation ofenergy balance or other metabolic consequences. Onepurpose of this opinion paper is to summarize and evalu-ate recent research that is consistent with the rathercounterintuitive claim that consuming high-intensitysweeteners may promote excess energy intake, increased
body weight, and other related co-morbidities. A secondgoal is to identify and examine the types of physiologicalmechanisms that could underlie such adverse health con-sequences. A third aim is to consider factors that canmakestudies into the effects of artificial sweeteners on energyand body weight regulation difficult to interpret.
Opinion
Glossary
Artificially sweetened beverages (ASB): also known as ‘diet’ soft drinks,beverages manufactured with one or more high-intensity sweeteners in placeof energy-yielding sugars like sucrose or high-fructose corn syrup with thepurpose of reducing or eliminating calories.Body mass index (BMI): used as an index of risk for weight-related healthoutcomes and is calculated as (kg/m2). In adults BMIs of 18.5–24.9 areconsidered to be within the normal range, whereas BMIs from 25 to 29.9 areclassified as overweight and a BMI greater than 30 is classified as obese.Hazard ratio (HR) and odds ratio (OR): statistical measures of how often anevent occurs in one group compared to another. A HR or OR of 1 means there isno difference between the groups and an HR or OR >1 means there is anincreased likelihood that the event will occur in the group of interest relative tothe comparison group.High-intensity sweeteners: also known as low-calorie sweeteners, artificialsweeteners, non-nutritive sweeteners, or noncaloric sweeteners are chemicalsthat produce the perception of sweet taste at very low concentrations. High-intensity sweeteners currently used commonly in foods and beverages includesucralose, aspartame, saccharin, and acesulfame potassium, as well as newlyapproved extracts from the plant Stevia rebaudiana. Although some high-intensity sweeteners can be metabolized by the body, foods and beveragestypically contain them in such small quantities that even those that can bemetabolized contribute minute amounts of energy to the diet.Incretin hormones: hormones such as glucagon-like peptide-1 (GLP-1) andglucose-dependent insulinotropic peptide (GIP) that are released from L cellsand K cells in the intestine, respectively, and serve to enhance the release ofinsulin from beta cells, slow the rate of gastric emptying, and may contribute tosatiety.Metabolic syndrome: a group of factors that occur together and contribute toincreased risk for coronary artery disease, stroke, and type 2 diabetes (T2D).Typical definitions require three or more of the following: blood pressure>130/85 mmHg; fasting blood glucose >100 mg/dl; large waist circumference (men>102 cm, women >89 cm); low high-density lipoprotein (HDL) cholesterol(men <40 mg/dl; women <50 mg/dl); triglycerides >150 mg/dl.Post-prandial glucose homeostasis: following meals (post-prandial) levels ofglucose in the blood are tightly regulated by the release of a variety ofhormones that contribute to clearance of glucose. For example, release ofinsulin from the beta cells of the pancreas is required to move sugar from theblood into cells.Sugar-sweetened beverages (SSB): also known as ‘regular’ soft drinks,manufactured with one or more caloric sweeteners such as sucrose or high-fructose corn syrup.Thermic effect of food: increase in metabolic rate after consumption of a mealrelated to energy required to process and metabolize the consumed food.Type 2 diabetes: chronic elevation of blood glucose due to insulin resistancethat is also characterized by impaired incretin secretion.1043-2760/$ – see front matter
! 2013 Elsevier Ltd. All rights reserved. http://dx.doi.org/10.1016/j.tem.2013.05.005
Corresponding author: Swithers, S.E. ([email protected]).Keywords: obesity; diabetes; sweeteners.
Trends in Endocrinology and Metabolism, September 2013, Vol. 24, No. 9 431
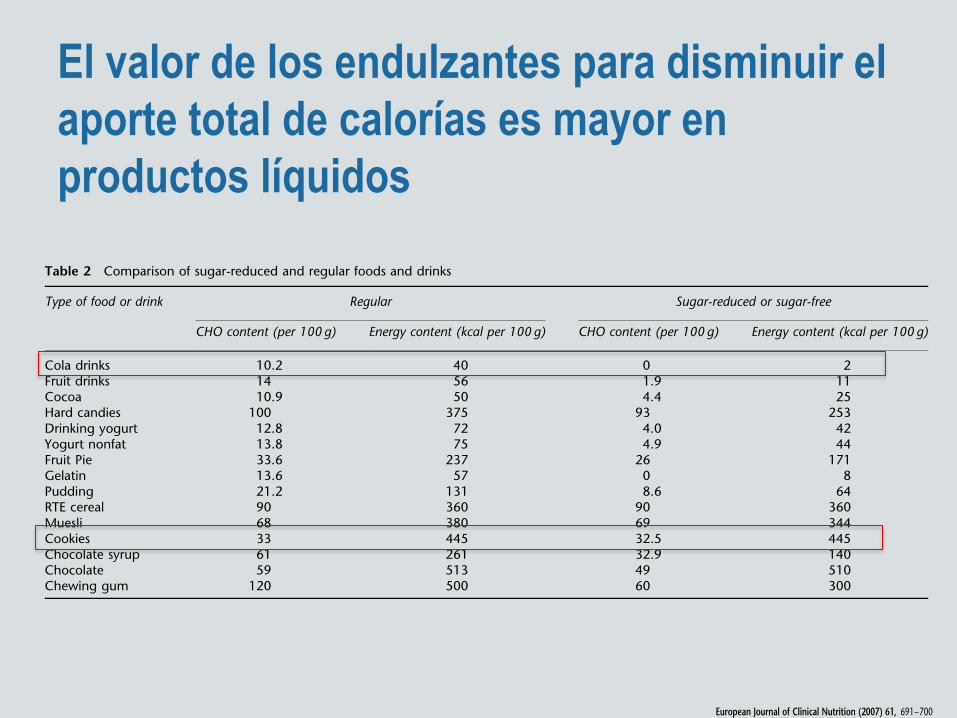
El valor de los endulzantes para disminuir el aporte total de calorías es mayor en productos líquidos
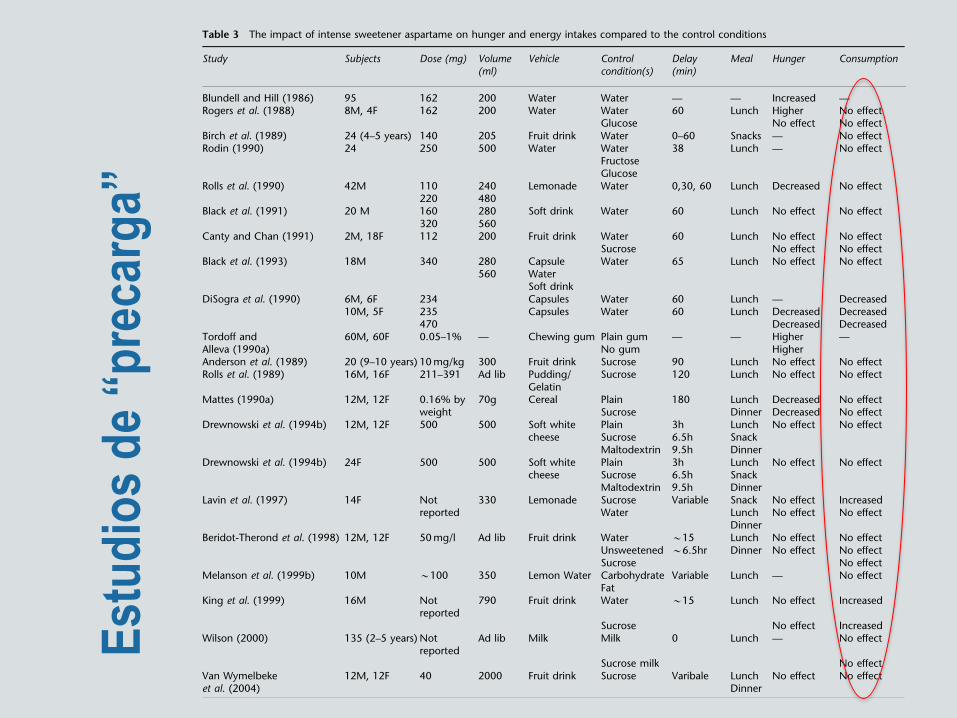
energy density of beverages; the reduction is smaller forsemi-liquid food products, and can be very small for solidfoods. The impact of intense sweeteners on energy intakesmay, therefore, largely depend on the energy density of thetested food. Table 3 (Blundell and Hill, 1986; Rogers et al.,1988; Anderson et al., 1989; Birch et al., 1989; Rolls et al.,1989, 1990; DiSogra et al., 1990; Rodin, 1990; Mattes, 1990a;Tordoff and Alleva, 1990a; Black et al., 1991, 1993; Canty andChan, 1991; Drewnowski et al., 1994a, b; Lavin et al., 1997;Beridot-Therond et al., 1998; King et al., 1999; Melansonet al., 1999a; Wilson, 2000; Van Wymelbeke et al., 2004)shows that past studies on sugars, intense sweeteners andsatiety have been based on both liquid and solid stimuli ofdifferent levels of energy density. Those included aqueoussolutions (Blundell and Hill, 1986), soft drinks (Canty andChan, 1991; Almiron-Roig and Drewnowski, 2003), fruitdrinks (Anderson et al., 1989; Birch et al., 1989; Canty andChan, 1991; Beridot-Therond et al., 1998; King et al., 1999;Van Wymelbeke et al., 2004), fruit juices (Almiron-Roig andDrewnowski, 2003), milk (Wilson, 2000), yogurts (Blundelland Green, 1996), soft creamy white cheese (Drewnowskiet al., 1994a, b), puddings (Rolls et al., 1989) and cereal(Mattes, 1990a). As a result, the impact of intense sweetenerson satiety may have been crossed with product consistency(liquid versus solid) or sugar type (sucrose or HFCS), not tomention energy density and preload volume (Almiron-Roiget al., 2003).
Experimental designs
Most studies on sugars, sweeteners and satiety have made useof the standard preload paradigm (Rogers and Blundell,1989, 1993; Drewnowski, 1998b). Generally, this takes theform of presenting study subjects with a preload beverage,meal or snack of varying energy, volume, energy density ornutrient composition (Walike et al., 1969; Drewnowski,
1998b). Typically, preload volume is adjusted by the additionof water preload and energy is adjusted by the addition ofnon-caloric components (intense sweeteners or fat replace-ments), whereas preload nutrient composition is determinedby the proportions of fat, carbohydrate, protein or fiber(Drewnowski, 1998b). The general assumption is that energyingested in the form of preload will lead to adjustments inenergy intakes later on.
In studies of sweetness and satiety, there is a need todistinguish between the addition and the substitutionconditions (Blundell and King, 1996). The addition of anintense sweetener to a plain stimulus adds sweetness,however, the energy value remains constant. By contrast,the substitution of an intense sweetener for sucrose main-tains sweetness but reduces energy content by a variableamount (see Table 2). Whereas some early studies examinedthe impact of substituting aspartame for sucrose (Andersonet al., 1989; Rolls et al., 1990), fewer used a plain watercontrol (Blundell et al., 1988; Black et al., 1991). Otherstudies used a variety of solid and liquid preloads that wereeither plain, sweetened with sucrose, aspartame or supple-mented with maltodextrin or starch (Rogers and Blundell,1989; Mattes, 1990a; Drewnowski et al., 1994b).
The dependent measures typically take one of two forms.First, motivational ratings of hunger, satiety, desire to eatand thirst are collected at variable intervals (20–30min) forup to a few hours after the preload (Kissileff et al., 1984;Almiron-Roig and Drewnowski, 2003). Second, the amountof energy consumed at a subsequent test meal is theprincipal measure of energy adjustment following preloadingestion. There are some questions whether motivationalratings alone are a good predictor of energy intakes at thenext meal (Mattes, 1990b; Mattes et al., 2005). Althoughsome early studies used motivational ratings as proxymeasures of ingestion, it is a good practice to use both(Almiron-Roig et al., 2003). In general, taste preferences forsweet solutions, once thought to be an index of satiety
Table 2 Comparison of sugar-reduced and regular foods and drinks
Type of food or drink Regular Sugar-reduced or sugar-free
CHO content (per 100 g) Energy content (kcal per 100 g) CHO content (per 100 g) Energy content (kcal per 100 g)
Cola drinks 10.2 40 0 2Fruit drinks 14 56 1.9 11Cocoa 10.9 50 4.4 25Hard candies 100 375 93 253Drinking yogurt 12.8 72 4.0 42Yogurt nonfat 13.8 75 4.9 44Fruit Pie 33.6 237 26 171Gelatin 13.6 57 0 8Pudding 21.2 131 8.6 64RTE cereal 90 360 90 360Muesli 68 380 69 344Cookies 33 445 32.5 445Chocolate syrup 61 261 32.9 140Chocolate 59 513 49 510Chewing gum 120 500 60 300
Intense sweeteners, energy intake and the control of body weightF Bellisle and A Drewnowski
693
European Journal of Clinical Nutrition
REVIEW
Intense sweeteners, energy intake and the control ofbody weight
F Bellisle1 and A Drewnowski2
1France Bellisle, INRA, CRNH Ile-de-France, Paris XIII Leonard de Vinci, Bobigny, France and 2Center for Public Health Nutrition,School of Public Health and Community Medicine, University of Washington, Seattle, WA, USA
Replacing sugar with low-calorie sweeteners is a common strategy for facilitating weight control. By providing sweet tastewithout calories, intense sweeteners help lower energy density of beverages and some foods. Reduced dietary energy densityshould result in lower energy intakes – but are the energy reduction goals, in fact, achieved? The uncoupling of sweetness andenergy, afforded by intense sweeteners, has been the focus of numerous studies over the past two decades. There are recurringarguments that intense sweeteners increase appetite for sweet foods, promote overeating, and may even lead to weight gain.Does reducing energy density of sweet beverages and foods have a measurable impact on appetite and energy intakes, asexamined both in short-term studies and over a longer period? Can reductions in dietary energy density achieved with intensesweeteners really affect body weight control? This paper reviews evidence from laboratory, clinical and epidemiological studiesin the context of current research on energy density, satiety and the control of food intake.European Journal of Clinical Nutrition (2007) 61, 691–700; doi:10.1038/sj.ejcn.1602649; published online 7 February 2007
Keywords: intense sweeteners; energy density; hunger; satiety; satiation; weight control
Introduction
Throughout human history, sweet taste has been associatedwith dietary energy and therefore food reward (US Depart-ment of Health, 1977). Infants like intensely sweet solutions(Maller and Desor, 1973), whereas young children preferfoods that are both familiar and sweet (Birch, 1987; Gibsonand Wardle, 2003). A powerful stimulant of food consump-tion, sweetness, is often used to introduce new foods into thechildren’s diet (US Department of Health, 1977). Childrenlearn to accept novel tastes and flavors when they areassociated with energy-dense nutrients, such as sugar or fat(Johnson et al., 1991; Birch, 1992).
The innate mechanisms of sweetness acceptance appear toinvolve a variety of central mechanisms, among them aredopamine, serotonin and the endogenous opioid peptides(Drewnowski et al., 1995; Levine et al., 2003; Schwartz,2006). Whereas human physiology remains the same,human exposure to dietary sugars has changed dramatically
over the past several hundred years (Mintz, 1985). Not onlyhas sugar content of the diet increased, but much of thesugar is consumed in liquid form (Bray et al., 2004). Currentresearch on sugars and body weight has focused on theinteractions of physiological systems with sugar content ofthe food supply (Elliott et al., 2002; Bray et al., 2004; Grosset al., 2004; Isganaitis and Lustig, 2005).
Sweet-tasting foods with high-energy density are said todisrupt appetite regulation and overwhelm the body’sregulatory mechanisms (Erlanson-Albertsson, 2005). Energy-dense diets cause insulin and leptin resistance in the centralnervous system (CNS) (Schwartz, 2006) and blunt responses tophysiological signals of satiety (Erlanson-Albertsson, 2005).Diet-induced CNS insulin resistance is the suggested reasonwhy pleasure response to energy-dense foods does notdiminish even in the face of caloric repletion (Lustig, 2001;Isganaitis and Lustig, 2005). Sweetness may also affect cortisolreactivity and compensate for feelings of stress (Epel et al.,2001). Studies in mice suggest that leptin modulates sweettaste responsiveness (Ninomyia et al., 2002), with furtherimplications for fatness and energy intakes.
Soft drinks are a major source of sugar energy in theAmerican diet (Bray et al., 2004). The consumption of caloricbeverages is rising in France (Volatier and Verger, 1999) aswell as worldwide. If a sustained innate desire for sweet taste
Received 25 October 2006; accepted 4 December 2006; published online 7February 2007
Correspondence: Dr F Bellisle, INRA, CRNH Ile-de-France, Paris XIII Leonard deVinci, Bobigny, France.E-mail: [email protected]
European Journal of Clinical Nutrition (2007) 61, 691–700& 2007 Nature Publishing Group All rights reserved 0954-3007/07 $30.00
www.nature.com/ejcn
Placer por lo dulce, azúcar y obesidad
Edulcorantes artificiales: no tan rápido!
Mecanismos propuestos para el “daño”
Evidencia actual
Conclusiones
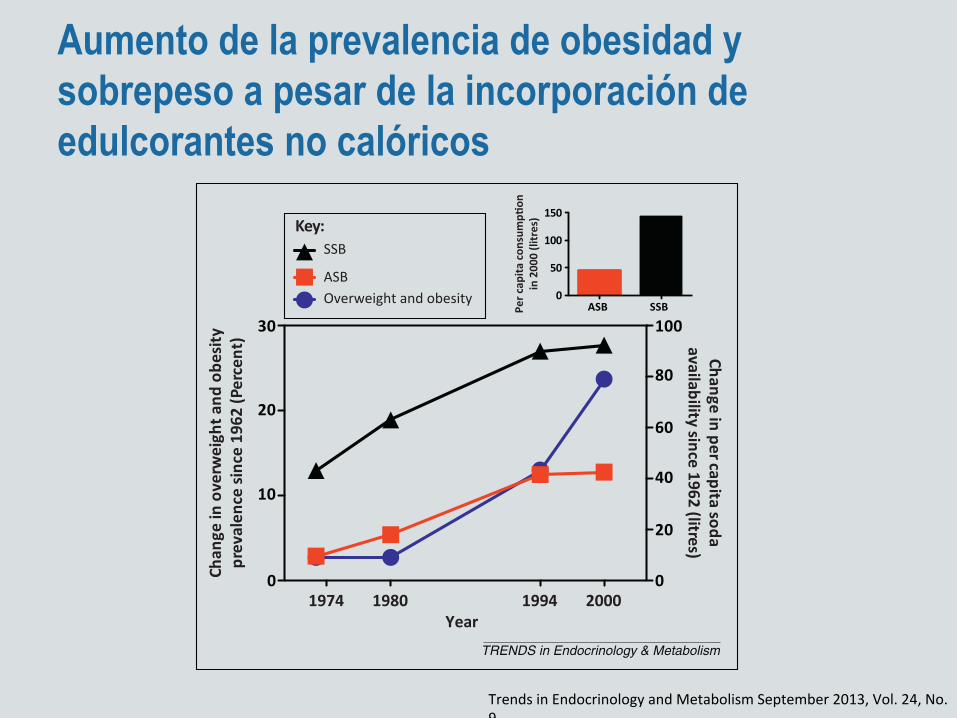
Aumento de la prevalencia de obesidad y sobrepeso a pesar de la incorporación de edulcorantes no calóricos
Use of high-intensity sweeteners and artificiallysweetened beveragesFor the present purposes, the terms high-intensity sweet-eners, low-calorie sweeteners, artificial sweeteners, andartificially sweetened beverages (ASB) have much thesame meaning and are used interchangeably. Consump-tion and availability of artificial sweeteners have beenincreasing and in the USA approximately 30% of adultsand 15% of children aged 2–17 years reported consumptionof low-calorie sweeteners in 2007–2008 [16]. Consumptionof ASB and SSB has increased between 1962 and 2000 inthe USA and shows parallels with changes in the preva-lence of being overweight and obesity over the same timeframe (Figure 1). Consumption of ASB has also risen alongwith rates of obesity in Australia, whereas consumption ofSSB has declined [17].
Prospective cohort studies of effects of ASBconsumptionWeight gainThe San Antonio Heart Study documented weight changein men and women over a 7–8-year period. As part of thatstudy, Fowler et al. [18] reported that, among participantswho were normal weight or overweight at baseline, risk ofweight gain and obesity were significantly greater in thoseconsuming ASB compared with those who did not consumeASB [18] (Table 1). In a study of two adolescent cohorts,ASB intake was associatedwith increased bodymass index(BMI) and increased body fat percentage in males andfemales at 2-year follow-up [19] when data were examined
cross-sectionally, but not in a longitudinal analysis. In thatstudy, SSB intake was associated with increased BMI inmales only in the longitudinal analysis, whereas therewere no increased risks for increased BMI or increasedbody fat percentage associated with SSB in females. Dif-ferences in outcome between these adolescents and theFowler et al. study could reflect smaller sample sizes,younger subjects, and/or a shorter follow-up time frame.However, neither study provided evidence that ASB con-sumption was associated with reduced risk for eitherweight gain or increased body fat percentage [18,19].
Metabolic syndromeA number of studies have reported greater risk of metabol-ic syndrome for consumers of ASB across a variety ofcohorts [6,20–22] (Table 1). Estimates of the size of theincrease in the risk of metabolic syndrome associated withconsuming ASB range from approximately 17% [hazardratios (HRs) and odds ratios (ORs) of 1.17] to over 100%(e.g., those consuming ASB had double the risk of meta-bolic syndrome compared with non-consumers), with themagnitude of the risk estimate also depending on whichother risk factors were taken into consideration (see be-low). In studies that also examined the risk of metabolicsyndrome associated with SSB consumption the magni-tude of the increased risk was frequently similar for SSBand ASB [20,22] (Table 1).
Type 2 diabetesIn the European E3N study [23] and the Health Profes-sionals Follow-up (HPFS) [24] risk for T2D was more thandoubled for participants in the highest quartile of ASBconsumption compared with non-consumers, and SSB con-sumption was also associated with increased risk of T2D.In both these studies [23–25], comparison of themagnitudeof the risk between SSB and ASB is complicated by differ-ences in intake of the two beverage types. Data from theNurses’ Health Study (NHS) also indicated that risk forT2D was enhanced in those consuming at least one ASB orSSB per day [25]. Most recently, data from the EuropeanProspective Investigation into Cancer and Nutrition (EP-IC) has also indicated that risk for T2D was elevated inthose consuming at least one ASB or SSB per day [26].Importantly, a pronounced elevation of risk for T2D relatedto ASB in the EPIC study was seen even in participantswho were normal weight at baseline [26].
Hypertension and cardiovascular diseaseRisk for coronary heart disease (CHD) in the NHS wassignificantly elevated in women who consumed more thantwo ASB per day in age-adjusted models [27] or more thantwo SSB per day in fully adjusted models [27]. Similarly, inthe HPFS risk of CHD was significantly elevated by ASBand SSB, but comparisons of magnitude of these effects arecomplicated by differences in intake [28]. In addition,consuming at least one ASB daily significantly elevatedrisk for hypertension for women in NHS-I and NHS-II, aswell as in the HPFS [29], with the size of the effect similarto that observed for SSB in these samples. Finally, resultsfrom the NorthernManhattan Study (NMS) indicated thatdaily ASB consumption was associated with significantly
[(Figure_1)TD$FIG]
1974 1980 1994 20000
10
20
30
0
20
40
60
80
100
Year
Chan
ge in
ove
rwei
ght a
nd o
besit
ypr
eval
ence
sinc
e 19
62 (P
erce
nt)
Overweight and obesityASB
Change in per capita sodaavailability since 1962 (litres)
SSBKey:
ASB SSB0
50
100
150
Per c
apita
cons
ump!
onin
200
0 (li
tres
)
TRENDS in Endocrinology & Metabolism
Figure 1. Beverage consumption and the prevalence of obesity. Line graph illustrateschanges in per capita consumption of artificially sweetened beverages (ASB; redsquares), sugar-sweetened beverages (SSB; black triangles), and the prevalence ofobesity (blue circles) in the USA since 1962. For obesity data, years reported representthe final year of the data collection period (e.g., National Health and NutritionExamination Survey (NHANES) II 1976–1980 shown with soda consumption data from1980). Inset bar graph illustrates per capita consumption of ASB (red bar) and SSB(black bar) in the year 2000. Obesity data adapted from National Center for HealthStatistics Health E-stats, September 2012: http://www.cdc.gov/nchs/data/hestat/obesity_adult_09_10/obesity_adult_09_10.pdf, accessed 28 May, 2013. Beverage dataadapted from Beverages Worksheet. USDA Economic Research Service: http://www.ers.usda.gov/datafiles/Food_Availabily_Per_Capita_Data_System/Food_Availability/beverage.xls, accessed 28 May, 2013.
Opinion Trends in Endocrinology and Metabolism September 2013, Vol. 24, No. 9
432
Trends in Endocrinology and Metabolism September 2013, Vol. 24, No. 9

Estudios de Cohorte Prospectivos/observacionales
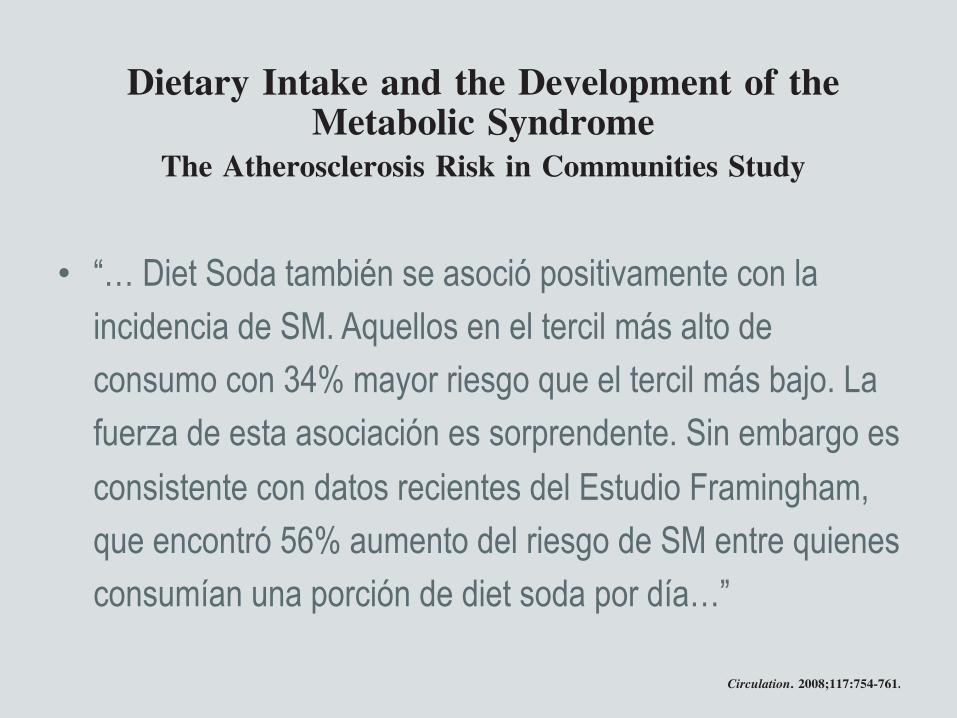
• “… Diet Soda también se asoció positivamente con la incidencia de SM. Aquellos en el tercil más alto de consumo con 34% mayor riesgo que el tercil más bajo. La fuerza de esta asociación es sorprendente. Sin embargo es consistente con datos recientes del Estudio Framingham, que encontró 56% aumento del riesgo de SM entre quienes consumían una porción de diet soda por día…”
Dietary Intake and the Development of theMetabolic Syndrome
The Atherosclerosis Risk in Communities Study
Pamela L. Lutsey, MPH; Lyn M. Steffen, PhD, MPH, RD; June Stevens, PhD, MS, RD
Background—The role of diet in the origin of metabolic syndrome (MetSyn) is not well understood; thus, we sought toevaluate the relationship between incident MetSyn and dietary intake using prospective data from 9514 participants (age,45 to 64 years) enrolled in the Atherosclerosis Risk in Communities (ARIC) study.
Methods and Results—Dietary intake was assessed at baseline via a 66-item food frequency questionnaire. We usedprincipal-components analysis to derive “Western” and “prudent” dietary patterns from 32 food groups and evaluated10 food groups used in previous studies of the ARIC cohort. MetSyn was defined by American Heart Associationguidelines. Proportional-hazards regression was used. Over 9 years of follow-up, 3782 incident cases of MetSyn wereidentified. After adjustment for demographic factors, smoking, physical activity, and energy intake, consumption of aWestern dietary pattern (Ptrend!0.03) was adversely associated with incident MetSyn. After further adjustment for intakeof meat, dairy, fruits and vegetables, refined grains, and whole grains, analysis of individual food groups revealed thatmeat (Ptrend"0.001), fried foods (Ptrend!0.02), and diet soda (Ptrend!" 0.001) also were adversely associated withincident MetSyn, whereas dairy consumption (Ptrend!0.006) was beneficial. No associations were observed betweenincident MetSyn and a prudent dietary pattern or intakes of whole grains, refined grains, fruits and vegetables, nuts,coffee, or sweetened beverages.
Conclusions—These prospective findings suggest that consumption of a Western dietary pattern, meat, and fried foodspromotes the incidence of MetSyn, whereas dairy consumption provides some protection. The diet soda association wasnot hypothesized and deserves further study. (Circulation. 2008;117:754-761.)
Key Words: dairy products ! diet ! food habits ! meat ! metabolic syndrome X
Metabolic syndrome (MetSyn) is a cluster of cardiovas-cular risk factor abnormalities associated with in-
creased risk of type 2 diabetes mellitus,1,2 cardiovasculardisease,2,3 and all-cause mortality.4 Elevated measurements of!3 of the following cardiovascular risk factors define thesyndrome: waist circumference, blood pressure, fasting glu-cose, high-density lipoprotein (HDL) cholesterol, and triglyc-erides.5 According to National Health and Nutrition Exami-nation Survey (NHANES) III data, collected in 1988 to 1994,#24% of adult Americans, or nearly 47 million US residents,have MetSyn.6 Given the present obesity epidemic in theUnited States,7 the current prevalence of MetSyn may behigher than that estimated from the 10- to 15-year-oldNHANES III data.6
Clinical Perspective p 761Although dietary intake has been linked to individual
components of MetSyn,8–18 the role of diet in the origin of
MetSyn is not well understood. Cross-sectionally, dietaryintakes rich in whole-grain foods have been linked to a lowerprevalence of MetSyn.19–21 The evidence is less consistent forrefined-grain intake, with some cross-sectional studies report-ing a positive association19,21 and others finding no relation.20
Dairy intake has been inversely associated with MetSyn bothcross-sectionally22,23 and prospectively.24 Greater intakes offruit and vegetables also have been associated with a lowerprevalence of MetSyn.25 No association has been foundbetween MetSyn and intakes of meat and fish.23 Intakes ofregular and diet soda, however, have been positively associ-ated with MetSyn both cross-sectionally and prospectively.26
In cross-sectional dietary pattern analyses, a greater preva-lence of MetSyn was found among consumers of “Western”27
and “empty-calorie”28 dietary patterns, whereas a lowerprevalence was found among those consuming a “healthy”dietary pattern.27 Associations between MetSyn and intakesof fried foods, coffee, and nuts have yet to be assessed among
Received May 18, 2007; accepted December 7, 2007.From the Division of Epidemiology and Community Health, University of Minnesota, School of Public Health, Minneapolis (P.L.L., L.M.S.), and
Department of Nutrition, University of North Carolina, Chapel Hill (J.S.).The online Data Supplement, which contains a table, can be found with this article at http://circ.ahajournals.org/cgi/content/full/
CIRCULATIONAHA.107.716159/DC1.Correspondence to Lyn M. Steffen, PhD, MPH, RD, 1300 S 2nd St, Ste 300, Minneapolis, MN 55415. E-mail [email protected]© 2008 American Heart Association, Inc.
Circulation is available at http://circ.ahajournals.org DOI: 10.1161/CIRCULATIONAHA.107.716159
754 by guest on June 20, 2016http://circ.ahajournals.org/Downloaded from
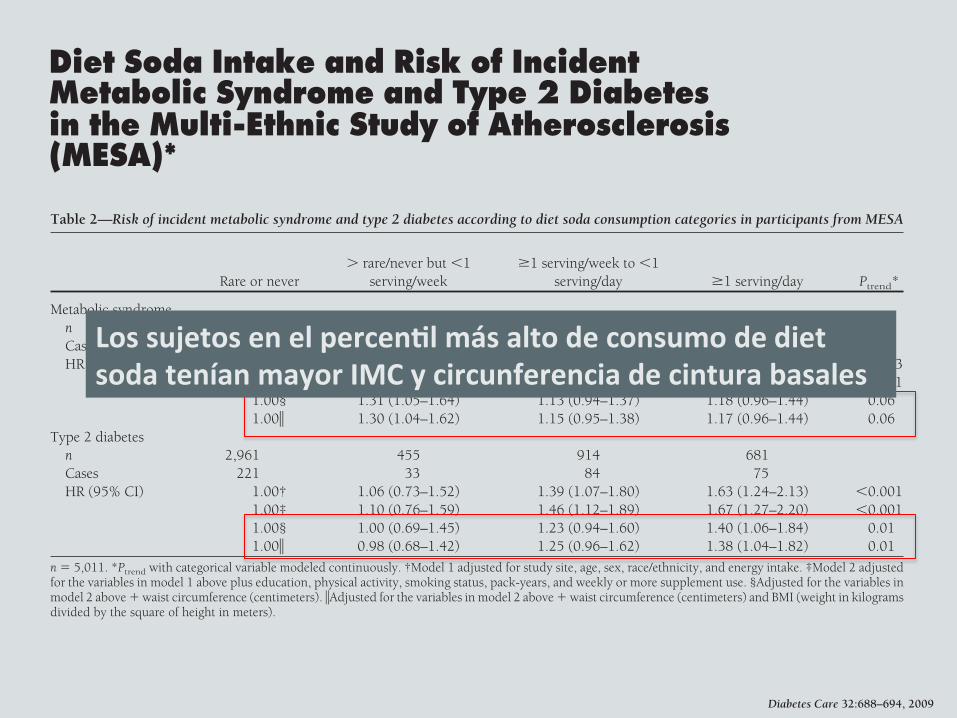
Diet Soda Intake and Risk of IncidentMetabolic Syndrome and Type 2 Diabetesin the Multi-Ethnic Study of Atherosclerosis(MESA)*JENNIFER A. NETTLETON, PHD
1
PAMELA L. LUTSEY, PHD2
YOUFA WANG, MD, PHD3
JOAO A. LIMA, PHD4
ERIN D. MICHOS, MD4
DAVID R. JACOBS, JR., PHD2,5
OBJECTIVE — We determined associations between diet soda consumption and risk ofincident metabolic syndrome, its components, and type 2 diabetes in the Multi-Ethnic Study ofAtherosclerosis.
RESEARCHDESIGNANDMETHODS — Diet soda consumption was assessed by foodfrequency questionnaire at baseline (2000–2002). Incident type 2 diabetes was identified atthree follow-up examinations (2002–2003, 2004–2005, and 2005–2007) as fasting glucose!126 mg/dl, self-reported type 2 diabetes, or use of diabetes medication. Metabolic syndrome(and components) was defined by National Cholesterol Education Program Adult TreatmentPanel III criteria. Hazard ratios (HRs) with 95% CI for type 2 diabetes, metabolic syndrome, andmetabolic syndrome components were estimated, adjusting for demographic, lifestyle, anddietary confounders.
RESULTS — At least daily consumption of diet soda was associated with a 36% greater relativerisk of incident metabolic syndrome and a 67% greater relative risk of incident type 2 diabetescompared with nonconsumption (HR 1.36 [95% CI 1.11–1.66] for metabolic syndrome and1.67 [1.27–2.20] for type 2 diabetes). Of metabolic syndrome components, only high waistcircumference (men !102 cm and women !88 cm) and high fasting glucose (!100 mg/dl) wereprospectively associated with diet soda consumption. Associations between diet soda consump-tion and type 2 diabetes were independent of baseline measures of adiposity or changes in thesemeasures, whereas associations between diet soda and metabolic syndrome were not indepen-dent of these factors.
CONCLUSIONS — Although these observational data cannot establish causality, consump-tion of diet soda at least daily was associated with significantly greater risks of select incidentmetabolic syndrome components and type 2 diabetes.
Diabetes Care 32:688–694, 2009
Two longitudinal cohort studies haveshown positive associations be-tween diet soda consumption and
incident metabolic syndrome indepen-dent of baseline measures of adiposity(1,2). Artificially sweetened beverages,
such as diet soda, are commonly consid-ered “benign” because they contribute noenergy and few nutrients to the diet. Con-sequently, the previously observed dietsoda–metabolic syndrome associationsare generally speculated to be the result of
residual confounding by other dietary be-haviors, lifestyle factors, or demographiccharacteristics (1,2). Biological mecha-nisms possibly explaining these associa-tions are few and largely focus on artificialsweeteners in beverages/foods increasingthe desire for (and consumption of)sugar-sweetened, energy-dense beverag-es/foods (3) or disrupting consumers’ability to accurately estimate energy in-take and remaining energy needs (4).Thus, diet soda consumption may resultin overconsumption, increased bodyweight, and consequent metabolic dys-function. If true, such relations haveimportant implications for dietary coun-seling, given the high frequency of dietbeverage consumption by those at highrisk for metabolic dysfunction (5).
Replication of previously observeddiet soda–metabolic syndrome associa-tions in a distinct cohort would bolstertheir credibility and provide further in-sight into the nature of the relationship.Previous studies have not addressed asso-ciations between diet soda and individualmetabolic syndrome components or riskof type 2 diabetes nor have they fully ad-dressed potential longitudinal mediatorsof these relationships, i.e., changes in ad-iposity status (body weight and or waistcircumference). Therefore, we evaluatedassociations between diet soda consump-tion and risk of incident metabolic syn-drome (and metabol ic syndromecomponents) as well as incident type 2diabetes in the Multi-Ethnic Study of Ath-erosclerosis (MESA), while consideringthe influence of multiple lifestyle con-founders, including measures of baselineadiposity and changes in adiposity.
RESEARCH DESIGN ANDMETHODS — MESA is a population-based study of 6,814 Caucasian, AfricanAmerican, Hispanic, and Chinese adults,aged 45–84 years, initiated to investigatethe prevalence and progression of sub-clinical cardiovascular disease (CVD).Self-reported race/ethnicity, other demo-graphics, and lifestyle and clinical charac-teristics were collected in six field centers:
● ● ● ● ● ● ● ● ● ● ● ● ● ● ● ● ● ● ● ● ● ● ● ● ● ● ● ● ● ● ● ● ● ● ● ● ● ● ● ● ● ● ● ● ● ● ● ● ●
From the 1Division of Epidemiology, University of Texas Health Sciences Center, Houston, Texas; the2Division of Epidemiology and Community Health, University of Minnesota, Minneapolis, Minnesota; the3Center for Human Nutrition, Department of International Health, The Johns Hopkins University, Bal-timore, Maryland; the 4Division of Cardiology, The Johns Hopkins University, Baltimore, Maryland; andthe 5Department of Nutrition, University of Oslo, Oslo, Norway.
Corresponding author: Jennifer A. Nettleton, [email protected] 1 October 2008 and accepted 30 December 2008.Published ahead of print at http://care.diabetesjournals.org on 16 January 2009. DOI: 10.2337/dc08-1799.*A full list of participating Multi-Ethnic Study of Atherosclerosis (MESA) investigators and institutions can
be found at http://www.mesa-nhlbi.org.© 2009 by the American Diabetes Association. Readers may use this article as long as the work is properly
cited, the use is educational and not for profit, and the work is not altered. See http://creativecommons.org/licenses/by-nc-nd/3.0/ for details.
The costs of publication of this article were defrayed in part by the payment of page charges. This article must therefore be herebymarked “advertisement” in accordance with 18 U.S.C. Section 1734 solely to indicate this fact.
C a r d i o v a s c u l a r a n d M e t a b o l i c R i s kO R I G I N A L A R T I C L E
688 DIABETES CARE, VOLUME 32, NUMBER 4, APRIL 2009
If we excluded from our analyses par-ticipants with any metabolic syndromecomponent at baseline (leaving a muchsmaller sample of 1,078 participants and46 incident cases of metabolic syn-drome), the HR comparing extreme dietsoda consumption categories was greater(1.54 [95% CI 0.65–3.65], model 2) butnot statistically significant.
Daily consumers of diet soda had a67% elevated risk of type 2 diabetes com-pared with nonconsumers with adjust-ment for demographics and lifestylefactors (model 2, Table 2). Adjustment forother dietary factors did not markedlychange risk estimates (data not shown).With adjustment for baseline differencesin waist circumference and/or BMI, HRsfor type 2 diabetes were slightly attenu-ated but remained statistically significant(Table 2). The association also remainedstatistically significant with adjustmentfor change in waist circumference (HR1.08 [95% CI 0.75–1.57], 1.45 [1.12–1.89], and 1.69 [1.28–2.22] across in-creas ing die t soda consumpt ioncategories compared with nonconsump-tion, respectively). Results were similarwhen adjusted for change in body weight(data not shown).
With stratification for BMI (!25 vs.!25 kg/m2), HRs were similar in bothstrata for metabolic syndrome and type 2diabetes, although there were few inci-dent cases and much larger confidence in-tervals in the BMI !25 kg/m2 strata,comparing extreme intake categories formetabolic syndrome (HR 2.2 [95% CI
1.10–4.51] with BMI !25 kg/m2 and1.48 [1.07–2.05] with BMI !25 kg/m2)and for type 2 diabetes (1.94 [0.87–4.35]with BMI !25 kg/m2 and 1.54 [1.15–2.07] with BMI !25 kg/m2).
Sugar-sweetened soda and risk ofmetabolic syndrome and type 2diabetesAlthough our primary analyses focusedon diet soda intake, we also estimated cor-responding risks for metabolic syndromeand type 2 diabetes according to con-sumption of sugar-sweetened soda. Datashowed no significant associations be-tween sugar-sweetened soda consump-tion and risk of either metabolicsyndrome or type 2 diabetes (data notshown).
If risk estimates for type 2 diabetesacross diet soda categories were calcu-lated in only the participants who did notconsume sugar-sweetened soda (n "2,245), the association with diet sodaconsumption remained significant, al-though CIs were wide (HR 1.43 [0.79–2.61], 1.76 [1.18–2.63], and 2.23 [1.49–3.34], across increasing diet sodaconsumption categories compared withnonconsumption, respectively). This re-sult was also true for metabolic syndrome(1.63 [1.13–2.36], 1.36 [1.02–1.81], and1.81 [1.36- 2.42] across increasing dietsoda consumption categories comparedwith nonconsumption, respectively, n "1,773).
Metabolic syndrome componentCompared with nonconsumers, individ-uals consuming !1 daily serving of dietsoda had a significantly greater risk of de-veloping high waist circumference (!102cm if male and !88 cm if female) or highfasting glucose (!100 mg/dl) during fol-low-up (HR 1.59 [95% CI 1.23–2.07] and1.28 [1.08–1.52] for high waist circum-ference and high fasting glucose, respec-tively) (Table 3). Diet soda consumptionwas not associated with the developmentof other metabolic syndrome components(Table 3). As an alternative approach toaddress the same question, we also eval-uated the amount of attenuation that oc-curred when metabolic syndrome HRswere adjusted for baseline measures of in-dividual metabolic syndrome compo-nents. Similarly, the largest amount ofattenuation occurred when HRs for inci-dent metabolic syndrome were adjustedfor baseline waist circumference or base-line fasting glucose concentration (com-paring individuals consuming !1 servingof diet soda versus nonconsumers: 1.18[0.96–1.44] adjusted for waist circumfer-ence; 1.23 [1.00–1.51] adjusted for glu-cose; 1.37 [1.12–1.68] adjusted for HDLcholesterol; 1.39 [1.14 –1.70] adjustedfor triglycerides; and 1.29 [1.06–1.58]adjusted for systolic and diastolic bloodpressure).
InteractionsThere were no significant interactions be-tween diet soda or sugar-sweetened sodaand age, sex, BMI, or waist circumference
Table 2—Risk of incident metabolic syndrome and type 2 diabetes according to diet soda consumption categories in participants from MESA
Rare or never# rare/never but !1
serving/week!1 serving/week to !1
serving/day !1 serving/day Ptrend*
Metabolic syndromen 2,288 367 722 501Cases 478 95 169 129HR (95% CI) 1.00† 1.34 (1.07–1.67) 1.20 (1.00–1.43) 1.31 (1.07–1.60) 0.003
1.00‡ 1.42 (1.14–1.78) 1.28 (1.06–1.53) 1.36 (1.11–1.66) !0.0011.00§ 1.31 (1.05–1.64) 1.13 (0.94–1.37) 1.18 (0.96–1.44) 0.061.00! 1.30 (1.04–1.62) 1.15 (0.95–1.38) 1.17 (0.96–1.44) 0.06
Type 2 diabetesn 2,961 455 914 681Cases 221 33 84 75HR (95% CI) 1.00† 1.06 (0.73–1.52) 1.39 (1.07–1.80) 1.63 (1.24–2.13) !0.001
1.00‡ 1.10 (0.76–1.59) 1.46 (1.12–1.89) 1.67 (1.27–2.20) !0.0011.00§ 1.00 (0.69–1.45) 1.23 (0.94–1.60) 1.40 (1.06–1.84) 0.011.00! 0.98 (0.68–1.42) 1.25 (0.96–1.62) 1.38 (1.04–1.82) 0.01
n " 5,011. *Ptrend with categorical variable modeled continuously. †Model 1 adjusted for study site, age, sex, race/ethnicity, and energy intake. ‡Model 2 adjustedfor the variables in model 1 above plus education, physical activity, smoking status, pack-years, and weekly or more supplement use. §Adjusted for the variables inmodel 2 above $ waist circumference (centimeters). !Adjusted for the variables in model 2 above $ waist circumference (centimeters) and BMI (weight in kilogramsdivided by the square of height in meters).
Nettleton and Associates
DIABETES CARE, VOLUME 32, NUMBER 4, APRIL 2009 691
Los sujetos en el percen.l más alto de consumo de diet soda tenían mayor IMC y circunferencia de cintura basales
Causalidad Reversa?? Confundentes Residuales?? • Podría ser el consumo de diet soda un marcador de otros
estilos de vida poco saludables o a algún patrón alimentario que derive en riesgo metabólico??
SHORT-TERM (⩽1 DAY) INTERVENTION STUDIES/RCTsStudy selection and data extraction and analysisEligibility criteria for short-term intervention studies were: LESexposure of ⩽ 24 h and EI measured in an ad libitum meal (testmeal) after consumption of the LES (preload) compared with a‘control’ condition. We extracted data for test meal EI after the LESpreload and comparison preload(s), and for the energy content ofthe preloads. We also noted the preload-to-test meal interval, andthe number of participants and their gender, and where availabletheir age, BW and/or BMI, dieting and/or dietary restraint status.We categorized the extracted data into five types of compar-
isons: LES versus sugar, LES versus unsweetened products, LESversus water, LES versus nothing and LES in capsules versusplacebo capsules. We conducted meta-analyses to derive sum-mary estimates of differences in cumulative EI (preload plus testmeal, kcal) separately for each of these types of comparison. ForLES versus sugar comparisons we also derived summary estimatesof compensation index (COMPX) scores.103 COMPX (EI in test mealafter LES minus EI in test meal after sugar)/(EI from sugar preloadminus EI from LES preload) is expressed as percentage. It describesthe extent to which adjustment in test meal intake ‘compensates’for the difference in energy content of the LES versus sugarpreload. If COMPX is o100% then LES led to under-compensation(reduced cumulative EI), if COMPX 4100% then LES led to over-compensation (increased cumulative EI), compared with sugar.For LES versus sugar there was a good number of studies that
tested children, so for this comparison we stratified the analysis byage group (child or adult participants). Fuller details of studyselection, data extraction and statistical methods used areavailable in the Supplementary Information.
ResultsWe identified 56 eligible articles,83,104–158 which yielded a total of218 comparisons. Of these, 118 were between LES and sugar(sucrose, glucose, fructose and mixtures of sugars including high-fructose corn syrups). In a majority of the comparisons the
participants were young, lean, low dietary restraint, non-dietingadults. The LES and sugar were most often given in a beverage(83% of studies). Within individual comparisons, the sweetness ofthe LES and sugar preloads was similar.Details of the studies are shown in Supplementary Tables S7–S11.
The results of the meta-analyses are summarised in Figure 3, forestand funnel plots are shown in Supplementary Figures S2–S8, andresults of meta-regression analyses are shown in SupplementaryTable S12.
LES versus sugar. Cumulative (preload plus test meal) EI wasreduced with consumption of LES versus sugar preloads in adultsand in children (Figure 3). The smaller absolute difference forchildren is partly accounted for by the lower energy content of thesugar preloads given to children compared with those given toadults. Children also showed somewhat greater compensation(COMPX score) than adults (Supplementary Figure S3). Compensa-tion for the sugar preloads was 70% (95% CI 43 to 97%) in childrenand 43% (95% CI 31 to 55%) in adults, and significantly differentfrom zero and from 100% in both groups. In other words, therewas partial but not full compensation for the lower energy contentof the LES compared with sugar preloads.There was a high level of heterogeneity among the studies.
A fully adjusted multivariable meta-regression model found nostatistically significant associations of COMPX with year ofpublication, energy content of the sugar-containing preload orgender, and only weak evidence of an association with intervalbetween preload and test meal (Supplementary Table S12). Anassessment of funnel plot asymmetry using Egger’s regression testsuggests there is some asymmetry (Supplementary Figure S8 andSupplementary Table S6), meaning smaller studies may have beenmore likely to report larger COMPX scores. This bias may affectstudies in children more than those in adults.
LES versus unsweetened, LES versus water and LES versus nothing.Cumulative EI did not differ when a LES-sweetened preload was
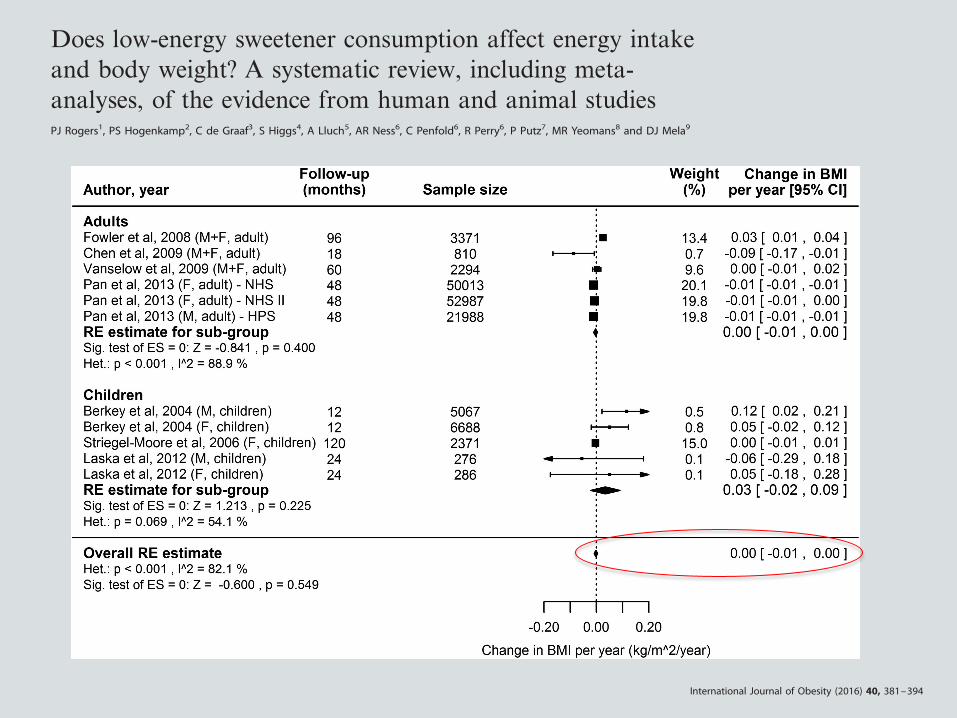
Figure 2. Forest plot showing individual and combined effect sizes for prospective cohort studies reporting the association between LESconsumption and change in BMI over the follow-up period. Effect sizes have been standardised to a 1 year follow-up period. Negative scoresfavour LES consumption (BMI decrease). Squares represent change in BMI per year for the individual studies; square size is proportional to theweight of each study; horizontal lines represent 95% CIs. Diamonds represent the summary estimates and 95% CIs from random effectsmodels for associations in adults and children separately, and in adults and children combined. BMI, Body Mass Index; LES, low-energysweetener.
Low-energy sweeteners systematic reviewPJ Rogers et al
385
© 2016 Macmillan Publishers Limited International Journal of Obesity (2016) 381 – 394
OPEN
REVIEW
Does low-energy sweetener consumption affect energy intakeand body weight? A systematic review, including meta-analyses, of the evidence from human and animal studiesPJ Rogers1, PS Hogenkamp2, C de Graaf3, S Higgs4, A Lluch5, AR Ness6, C Penfold6, R Perry6, P Putz7, MR Yeomans8 and DJ Mela9
By reducing energy density, low-energy sweeteners (LES) might be expected to reduce energy intake (EI) and body weight (BW). Toassess the totality of the evidence testing the null hypothesis that LES exposure (versus sugars or unsweetened alternatives) has noeffect on EI or BW, we conducted a systematic review of relevant studies in animals and humans consuming LES with ad libitumaccess to food energy. In 62 of 90 animal studies exposure to LES did not affect or decreased BW. Of 28 reporting increased BW, 19compared LES with glucose exposure using a specific ‘learning’ paradigm. Twelve prospective cohort studies in humans reportedinconsistent associations between LES use and body mass index (−0.002 kgm−2 per year, 95% confidence interval (CI) −0.009 to0.005). Meta-analysis of short-term randomized controlled trials (129 comparisons) showed reduced total EI for LES versus sugar-sweetened food or beverage consumption before an ad libitum meal (−94 kcal, 95% CI −122 to −66), with no difference versuswater (−2 kcal, 95% CI −30 to 26). This was consistent with EI results from sustained intervention randomized controlled trials(10 comparisons). Meta-analysis of sustained intervention randomized controlled trials (4 weeks to 40 months) showed thatconsumption of LES versus sugar led to relatively reduced BW (nine comparisons; −1.35 kg, 95% CI –2.28 to −0.42), and a similarrelative reduction in BW versus water (three comparisons; −1.24 kg, 95% CI –2.22 to −0.26). Most animal studies did not mimic LESconsumption by humans, and reverse causation may influence the results of prospective cohort studies. The preponderance ofevidence from all human randomized controlled trials indicates that LES do not increase EI or BW, whether compared with caloric ornon-caloric (for example, water) control conditions. Overall, the balance of evidence indicates that use of LES in place of sugar, inchildren and adults, leads to reduced EI and BW, and possibly also when compared with water.
International Journal of Obesity (2016) 40, 381–394; doi:10.1038/ijo.2015.177
INTRODUCTIONLow-energy sweeteners (LES), such as acesulfame-K, aspartame,saccharin, stevia and sucralose are consumed throughout theworld.1 The history of their use has been accompanied by debateand disagreements, not least about their potential nutritionalimpact. The use of LES to replace or partially replace added sugarin foods and beverages might well be expected to reduce energyintake (EI),2–4 yet over recent years there has been widely reportedspeculation that consumption of LES might increase the risk ofbecoming overweight and obese.5–7
Studies covertly manipulating energy density show higher EIafter consumption of a reduced-energy food or beverage, but thatthe degree of energy ‘compensation’ is variable.8 Crucially, energycompensation is usually lower than the difference in energycontent of the comparison foods/beverages, seemingly beinglowest of all for liquids.8 This suggests that consuming LES in placeof sugar-sweetened products should reduce overall EI, andparticularly so for consumption of beverages, the most popularvehicles for LES.1 The question also arises whether the presence ofLES in beverages affects appetite and EI relative to plain water.1,9
Although the imprecise control of short-term energy balancepredicts that LES consumption should help reduce EI andtherefore reduce risk of overweight and obesity,3,10 it is possiblethat, as consumed in everyday life, other effects of LES balance oreven outweigh the energy dilution effect. For example, a lowcalorie or ‘diet’ label may cause the consumer to eat a largerportion of the product or eat more of accompanying foods in themeal, or eat more later.11–14 More simply, adding sweetness to aproduct may increase intake owing to increased palatability.15,16
Or, by ‘uncoupling’ the relationship between sweetness andenergy content, the consumption of LES may undermine theusefulness of sweetness as a cue in the control of energybalance.5,17–20
The effects of LES consumption on EI and body weight (BW)have been the subject of many studies over the past 30 years;nonetheless there is no clear consensus about this body ofevidence. Taken together, a number of narrative reviews1–4,21–25
and systematic reviews of some types of studies26–30 lead to theconsistent but guarded conclusion that substitution of LES forsugar, especially in beverages, can help reduce EI, but that fully
1School of Experimental Psychology, University of Bristol, Bristol, UK; 2Department of Neuroscience, Uppsala University, Uppsala, Sweden; 3Division of Human Nutrition,Wageningen University, Wageningen, the Netherlands; 4The School of Psychology, University of Birmingham, Birmingham, UK; 5Danone Research, Centre Daniel Carasso, RD,Palaiseau Cedex, France; 6National Institute for Health Research Biomedical Research Unit in Nutrition, Diet and Lifestyle at the University Hospitals Bristol NHS Foundation Trustand the University of Bristol and School of Oral and Dental Sciences, University of Bristol, Level 3, University Hospitals Bristol Education Centre, Bristol, UK; 7European Branch, ILSIEurope a.i.s.b.l., Brussels, Belgium; 8School of Psychology, University of Sussex, Brighton, UK and 9Unilever R&D Vlaardingen, Vlaardingen, the Netherlands. Correspondence:Dr P Putz, European Branch, ILSI Europe a.i.s.b.l., Avenue E. Mounier 83, Box 6, Brussels B-1200, Belgium.E-mail: [email protected] 13 November 2014; revised 28 August 2015; accepted 28 August 2015; accepted article preview online 14 September 2015; advance online publication, 10 November 2015
International Journal of Obesity (2016) 40, 381–394© 2016 Macmillan Publishers Limited All rights reserved 0307-0565/16
www.nature.com/ijo

Placer por lo dulce, azúcar y obesidad
Edulcorantes artificiales: no tan rápido!
Buscando Causalidad: Plausibilidad Biológica
Evidencia actual
Conclusiones
– El hecho de agregar sabor a un “vehículo” no calórico podría aumentar el apetito posterior.
– Estudios no han demostrado efectos en apetito cuando edulcorantes se han administrado a través de SNG o en cápsulas
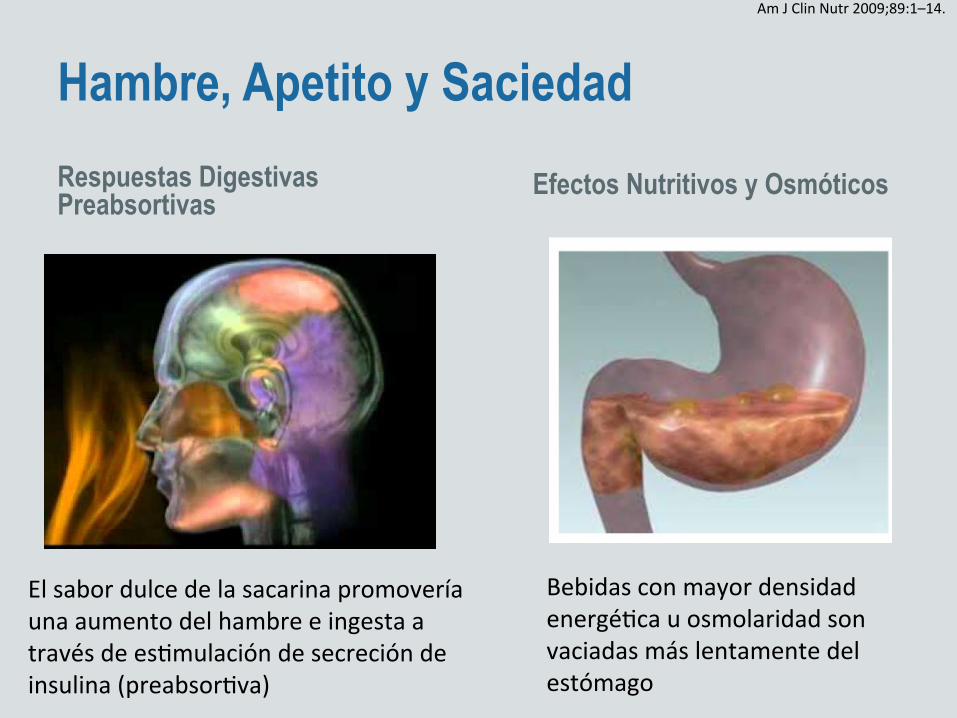
Hambre, Apetito y Saciedad Respuestas Digestivas Preabsortivas Efectos Nutritivos y Osmóticos
El sabor dulce de la sacarina promovería una aumento del hambre e ingesta a través de esKmulación de secreción de insulina (preabsorKva)
Am J Clin Nutr 2009;89:1–14.
Bebidas con mayor densidad energéKca u osmolaridad son vaciadas más lentamente del estómago
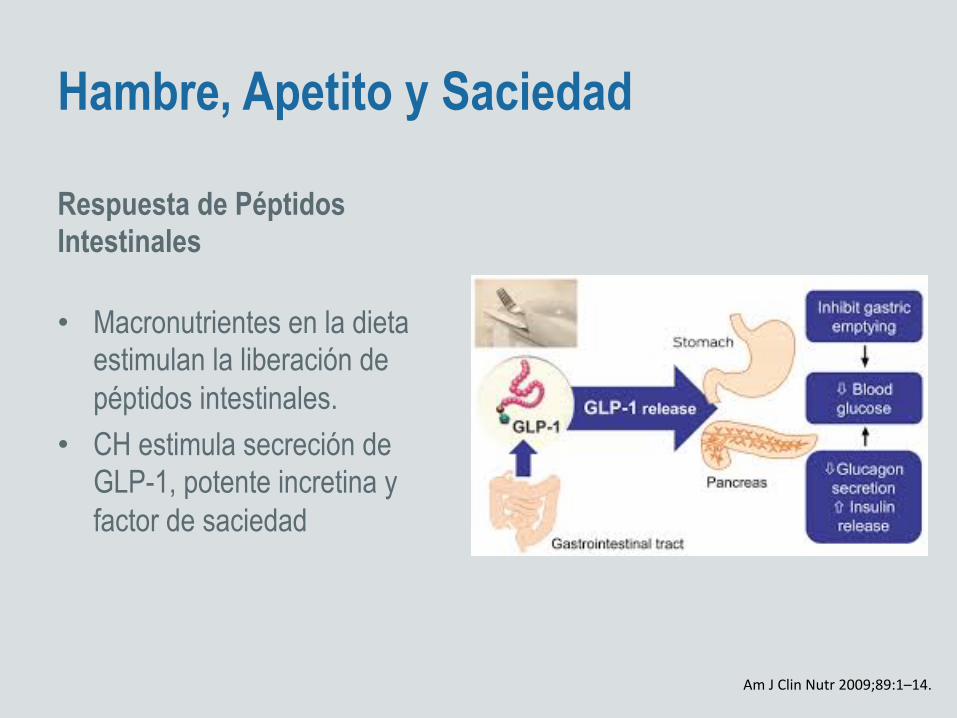
Hambre, Apetito y Saciedad
Respuesta de Péptidos Intestinales
• Macronutrientes en la dieta estimulan la liberación de péptidos intestinales.
• CH estimula secreción de GLP-1, potente incretina y factor de saciedad
Am J Clin Nutr 2009;89:1–14.
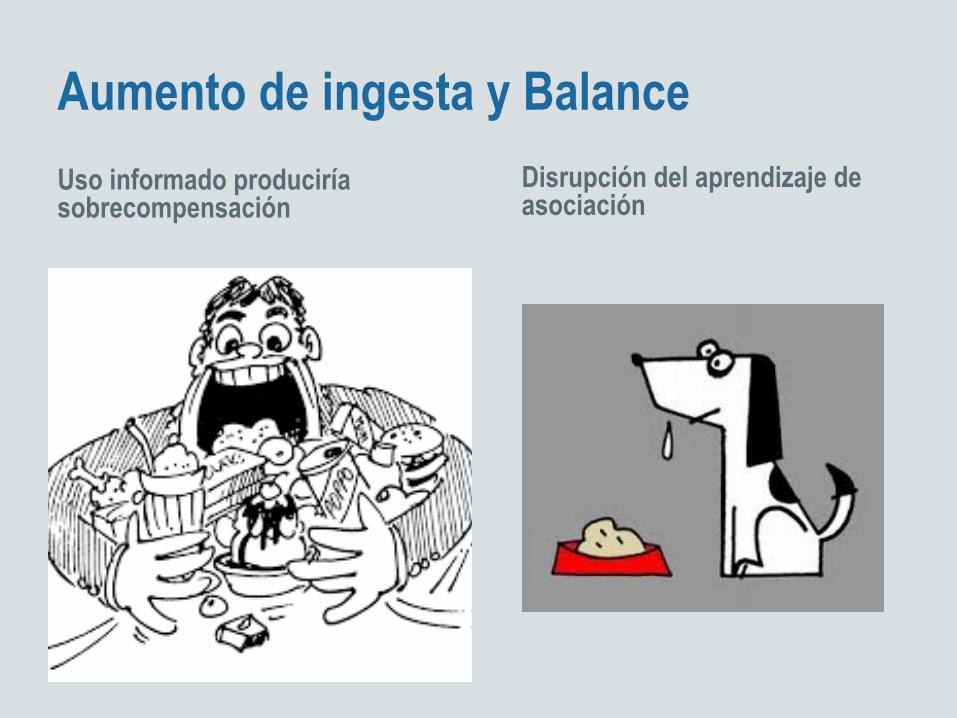
Aumento de ingesta y Balance Uso informado produciría sobrecompensación
Disrupción del aprendizaje de asociación
Placer por lo dulce, azúcar y obesidad
Edulcorantes artificiales: no tan rápido!
Mecanismos propuestos para el “daño”
Evidencia actual
Conclusiones
(Blundell and Hill, 1986) are not a good predictor of actualfood consumption (Lucas and Bellisle, 1987; Perez et al.,1994).In classic preload protocols, the time interval to the next
meal can vary between 0 and 150min. When the studyfocuses on satiation, the beverage preload is presented withthe meal (DellaValle et al., 2005). Energy and at timesnutrient intakes at the test meal are the sole dependentvariables. Those studies generally do not track the evolutionof hunger and satiety profiles with time.
When the focus of the study is on satiety, the meal ispresented 60–150min following the consumption of thepreload. However, the longer the postingestive window, thegreater the risk that the hunger curves for the low- and thehigh-energy preloads will eventually converge (Drewnowskiet al., 1994a, b). As a result, the likelihood of findingenergy compensation will be reduced. Energy intakes mayalso be affected by the palatability of the test meal (Yeomans,1996; Yeomans et al., 2001; Almiron-Roig and Drewnowski,2003).
Table 3 The impact of intense sweetener aspartame on hunger and energy intakes compared to the control conditions
Study Subjects Dose (mg) Volume(ml)
Vehicle Controlcondition(s)
Delay(min)
Meal Hunger Consumption
Blundell and Hill (1986) 95 162 200 Water Water — — Increased —Rogers et al. (1988) 8M, 4F 162 200 Water Water
Glucose60 Lunch Higher
No effectNo effectNo effect
Birch et al. (1989) 24 (4–5 years) 140 205 Fruit drink Water 0–60 Snacks — No effectRodin (1990) 24 250 500 Water Water
FructoseGlucose
38 Lunch — No effect
Rolls et al. (1990) 42M 110220
240480
Lemonade Water 0,30, 60 Lunch Decreased No effect
Black et al. (1991) 20 M 160320
280560
Soft drink Water 60 Lunch No effect No effect
Canty and Chan (1991) 2M, 18F 112 200 Fruit drink WaterSucrose
60 Lunch No effectNo effect
No effectNo effect
Black et al. (1993) 18M 340 280560
CapsuleWaterSoft drink
Water 65 Lunch No effect No effect
DiSogra et al. (1990) 6M, 6F 234 Capsules Water 60 Lunch — Decreased10M, 5F 235 Capsules Water 60 Lunch Decreased Decreased
470 Decreased DecreasedTordoff andAlleva (1990a)
60M, 60F 0.05–1% — Chewing gum Plain gumNo gum
— — HigherHigher
—
Anderson et al. (1989) 20 (9–10 years) 10mg/kg 300 Fruit drink Sucrose 90 Lunch No effect No effectRolls et al. (1989) 16M, 16F 211–391 Ad lib Pudding/
GelatinSucrose 120 Lunch No effect No effect
Mattes (1990a) 12M, 12F 0.16% byweight
70g Cereal PlainSucrose
180 LunchDinner
DecreasedDecreased
No effectNo effect
Drewnowski et al. (1994b) 12M, 12F 500 500 Soft whitecheese
PlainSucroseMaltodextrin
3h6.5h9.5h
LunchSnackDinner
No effect No effect
Drewnowski et al. (1994b) 24F 500 500 Soft whitecheese
PlainSucroseMaltodextrin
3h6.5h9.5h
LunchSnackDinner
No effect No effect
Lavin et al. (1997) 14F Notreported
330 Lemonade SucroseWater
Variable SnackLunchDinner
No effectNo effect
IncreasedNo effect
Beridot-Therond et al. (1998) 12M, 12F 50mg/l Ad lib Fruit drink WaterUnsweetenedSucrose
B15B6.5hr
LunchDinner
No effectNo effect
No effectNo effectNo effect
Melanson et al. (1999b) 10M B100 350 Lemon Water CarbohydrateFat
Variable Lunch — No effect
King et al. (1999) 16M Notreported
790 Fruit drink Water B15 Lunch No effect Increased
Sucrose No effect IncreasedWilson (2000) 135 (2–5 years) Not
reportedAd lib Milk Milk 0 Lunch — No effect
Sucrose milk No effectVan Wymelbekeet al. (2004)
12M, 12F 40 2000 Fruit drink Sucrose Varibale LunchDinner
No effect No effect
Intense sweeteners, energy intake and the control of body weightF Bellisle and A Drewnowski
694
European Journal of Clinical Nutrition
Estu
dios
de “
prec
arga
”
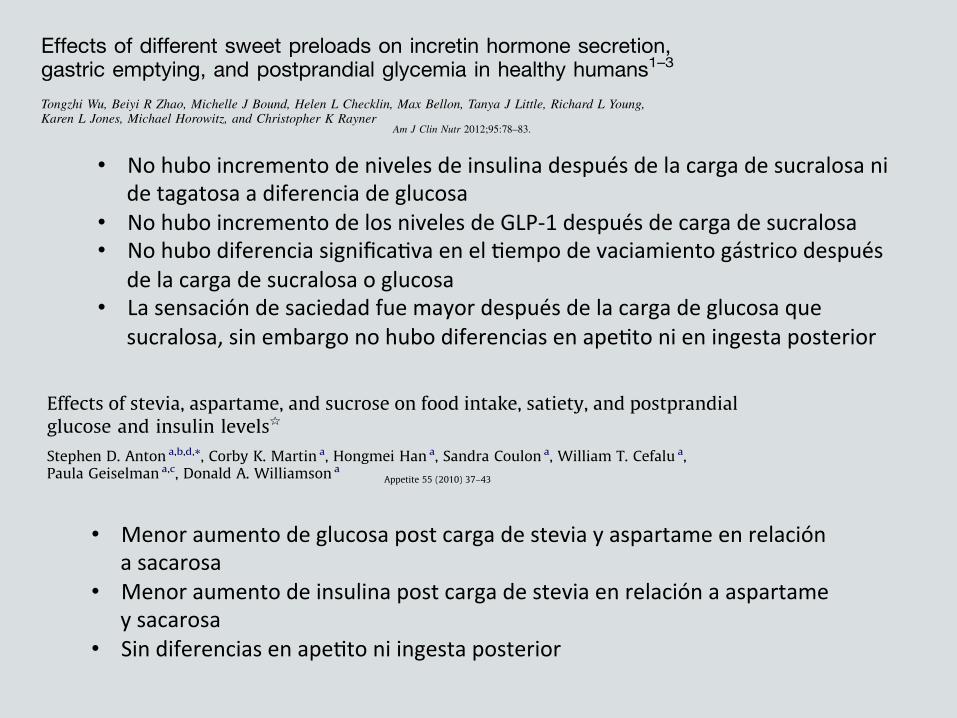
Effects of different sweet preloads on incretin hormone secretion,gastric emptying, and postprandial glycemia in healthy humans1–3
Tongzhi Wu, Beiyi R Zhao, Michelle J Bound, Helen L Checklin, Max Bellon, Tanya J Little, Richard L Young,Karen L Jones, Michael Horowitz, and Christopher K Rayner
ABSTRACTBackground: Macronutrient “preloads” can stimulate glucagon-like peptide 1 (GLP-1) and glucose-dependent insulinotropic polypep-tide (GIP), slow gastric emptying, and reduce postprandial glycemicexcursions. After sweet preloads, these effects may be signaled bysodium-glucose cotransporter-1 (SGLT1), sweet taste receptors, orboth.Objective: We determined the effects of 4 sweet preloads on GIPand GLP-1 release, gastric emptying, and postprandial glycemia.Design: Ten healthy subjects were studied on 4 separate occasionseach. A preload drink containing 40 g glucose, 40 g tagatose/iso-malt mixture (TIM), 40 g 3-O-methylglucose (3OMG; a nonmeta-bolized substrate of SGLT1), or 60 mg sucralose was consumed 15min before a 13C-octanoic acid–labeled mashed potato meal. Bloodglucose, plasma total GLP-1 and GIP, serum insulin, and gastricemptying were determined.Results: Both glucose and 3OMG stimulated GLP-1 and GIP re-lease in advance of the meal (each P , 0.05), whereas TIM andsucralose did not. The overall postprandial GLP-1 response wasgreater after glucose, 3OMG, and TIM than after sucralose (P ,0.05), albeit later after TIM than the other preloads. The bloodglucose and insulin responses in the first 30 min after the meal weregreatest after glucose (each P, 0.05). Gastric emptying was slowerafter both 3OMG and TIM than after sucralose (each P , 0.05).Conclusions: In healthy humans, SGLT1 substrates stimulate GLP-1and GIP and slow gastric emptying, regardless of whether they aremetabolized, whereas the artificial sweetener sucralose does not.Poorly absorbed sweet tastants (TIM), which probably exposea greater length of gut to nutrients, result in delayed GLP-1 secretionbut not in delayed GIP release. These observations have the potentialto optimize the use of preloads for glycemic control. This trial wasregistered at www.actr.org.au as ACTRN12611000775910. Am JClin Nutr 2012;95:78–83.
INTRODUCTION
Major determinants of postprandial blood glucose include therate of gastric emptying (1, 2) and the postprandial insulin re-sponse, of which !50% is stimulated by the secretion of GLP-14
and GIP, the so-called incretin hormones, from the gut in healthyhumans (3). In patients with type 2 diabetes, the incretin effect isimpaired (4). Incretin-based therapies for diabetes have focusedon GLP-1 rather than on GIP, because the insulinotropic actionof the latter is diminished in these patients (5). Other actions ofGLP-1 include slowing of gastric emptying (6) and reduction ofappetite and energy intake (7).
One promising strategy to stimulate endogenous GLP-1 is the“preload” concept, in which a small load of macronutrient is givena fixed interval before a meal, to induce the release of gut peptidessuch as GLP-1 and GIP to slow gastric emptying and stimulateinsulin secretion in advance of the main nutrient load. We haveshown that both fat and protein preloads markedly reduce post-prandial glycemic excursions in patients with type 2 diabetes bythese mechanisms (8, 9). However, a potential disadvantage is thatthe preload could increase overall energy intake; preloads thatentail minimal additional energy would be advantageous.
Incretin stimulation by carbohydrates may be signaled bysweet taste receptors and/or SGLT1. Data from in vitro, animal,and human studies in this area have been inconsistent. For example,stimulation of sweet taste receptors by sucralose (a noncaloricartificial sweetener) was reported to release GLP-1 from entero-endocrine L cells in vitro (10, 11) but has no effect on GLP-1secretion and gastric emptying in humans (12). It has also beenpostulated that SGLT1 may be involved in incretin hormone se-cretion (13). Monosaccharides that are substrates for SGLT1, in-cluding glucose, galactose, and 3OMG, stimulate GLP-1 release invitro and in perfused ileum in animal studies (14–16), an effectinhibited by phloridzin, which blocks SGLT1 (13). Similarly, in ob/ob mice, GIP is secreted in response to glucose, galactose, and3OMG (17), but not to fructose and mannose, which are notSGLT1 substrates (18, 19). 3OMG is a glucose analog that is ab-sorbed from the small intestine via SGLT1, but it is not metabo-lized and makes no contribution to energy intake. Whether 3OMGstimulates GIP and GLP-1 secretion in humans is unknown.
1 From the Discipline of Medicine, University of Adelaide, Royal Ade-laide Hospital, Adelaide, Australia (TW, BRZ, MJB, HLC, TJL, KLJ, MH,and CKR), and the Department of Nuclear Medicine (MB) and the NerveGut Laboratory (RLY), Royal Adelaide Hospital, Adelaide, Australia.
2 Supported by a grant awarded by the National Health and Medical Re-search Council (NHMRC) of Australia (grant no. 627139). TJL was sup-ported by an NHMRC Overseas Clinical Postdoctoral Training Fellowship(grant no. 519349).
3 Address correspondence to CK Rayner, Discipline of Medicine, RoyalAdelaide Hospital, North Terrace, Adelaide, South Australia 5000 Australia.E-mail: [email protected].
4 Abbreviations used: GIP, glucose-dependent insulinotropic polypeptide;GLP-1, glucagon-like peptide 1; iAUC, incremental AUC; SGLT1, sodium-glucose cotransporter-1; T50, half-emptying time; TIM, tagatose/isomalt mix-ture; 3OMG, 3-O-methyglucose.
Received June 11, 2011. Accepted for publication October 11, 2011.First published online December 7, 2011; doi: 10.3945/ajcn.111.021543.
78 Am J Clin Nutr 2012;95:78–83. Printed in USA. ! 2012 American Society for Nutrition
by guest on May 3, 2016
ajcn.nutrition.orgD
ownloaded from
• No hubo incremento de niveles de insulina después de la carga de sucralosa ni
de tagatosa a diferencia de glucosa • No hubo incremento de los niveles de GLP-‐1 después de carga de sucralosa • No hubo diferencia significaKva en el Kempo de vaciamiento gástrico después
de la carga de sucralosa o glucosa • La sensación de saciedad fue mayor después de la carga de glucosa que
sucralosa, sin embargo no hubo diferencias en apeKto ni en ingesta posterior Research report
Effects of stevia, aspartame, and sucrose on food intake, satiety, and postprandialglucose and insulin levels§
Stephen D. Anton a,b,d,*, Corby K. Martin a, Hongmei Han a, Sandra Coulon a, William T. Cefalu a,Paula Geiselman a,c, Donald A. Williamson a
a Pennington Biomedical Research Center, Baton Rouge, LA, United Statesb Department of Aging and Geriatric Research, University of Florida, United Statesc Department of Psychology, Louisiana State University, United Statesd Institute on Aging, University of Florida, 210 E Mowry Rd., Gainesville, FL 32611, United States
Introduction
The twin epidemics of obesity and Type 2 diabetes continue toincrease in industrialized nations. Approximately two thirds ofadult Americans are currently overweight or obese and therefore atincreased risk for a number of deleterious health conditionsincluding Type 2 diabetes, heart disease, and cancer (Roth, Qiang,
Marban, Redelt, & Lowell, 2004). Although there is not specificevidence that sucrose, a disaccharide that consists of 50% glucoseand 50% fructose, consumption affects the development of diabetes(Laville & Nazare, 2009), diets consisting of high amounts ofsucrose have been found to cause weight gain (Raben, Vasilaras,Moller, & Astrup, 2002) and to have adverse effects on glucosetolerance in healthy volunteers (Cohen, Teitelbaum, Balogh, &Groen, 1966). Overconsumption of fructose has also been found tocause dyslipidemia and ectopic lipid deposition in healthy subjectswith and without a family history of Type 2 diabetes (Le et al.,2009), as well as increase visceral adiposity and decrease insulinsensitivity in overweight individuals (Stanhope et al., 2009). Inanimal models, high glycemic diets and high consumption of thenatural sugar fructose have been shown to induce a number ofmetabolic complications including hyperinsulinemia, hyperglyce-mia, hypertension, and insulin resistance (Barros et al., 2007).Moreover, recent human studies demonstrate that fructoseinfusions can induce hepatic insulin resistance (Wei, Wang,Topczewski, & Pagliassotti, 2007).
Appetite 55 (2010) 37–43
A R T I C L E I N F O
Article history:Received 30 September 2009Received in revised form 1 December 2009Accepted 10 March 2010
Keywords:SteviaAspartameSucroseFood intakeSatietyHungerInsulinogenic indexInsulin sensitivity
A B S T R A C T
Consumption of sugar-sweetened beverages may be one of the dietary causes of metabolic disorders,such as obesity. Therefore, substituting sugar with low calorie sweeteners may be an efficacious weightmanagement strategy. We tested the effect of preloads containing stevia, aspartame, or sucrose on foodintake, satiety, and postprandial glucose and insulin levels. Design: 19 healthy lean (BMI = 20.0–24.9)and 12 obese (BMI = 30.0–39.9) individuals 18–50 years old completed three separate food test daysduring which they received preloads containing stevia (290 kcal), aspartame (290 kcal), or sucrose(493 kcal) before the lunch and dinner meal. The preload order was balanced, and food intake (kcal) wasdirectly calculated. Hunger and satiety levels were reported before and after meals, and every hourthroughout the afternoon. Participants provided blood samples immediately before and 20 min after thelunch preload. Despite the caloric difference in preloads (290 kcal vs. 493 kcal), participants did notcompensate by eating more at their lunch and dinner meals when they consumed stevia and aspartameversus sucrose in preloads (mean differences in food intake over entire day between sucrose andstevia = 301 kcal, p < .01; aspartame = 330 kcal, p < .01). Self-reported hunger and satiety levels did notdiffer by condition. Stevia preloads significantly reduced postprandial glucose levels compared tosucrose preloads (p < .01), and postprandial insulin levels compared to both aspartame and sucrosepreloads (p < .05). When consuming stevia and aspartame preloads, participants did not compensate byeating more at either their lunch or dinner meal and reported similar levels of satiety compared to whenthey consumed the higher calorie sucrose preload.
Published by Elsevier Ltd.
§ The authors would like to express their appreciation to the participants andresearch associates who made it possible to complete this research project. Thisresearch was supported by the Clinical Obesity Division of the PenningtonBiomedical Research Center, as well as by the P50AT002776-01 from the NationalCenter for Complementary and Alternative Medicine (NCCAM) and the Office ofDietary Supplements (ODS) which funds the Botanical Research Center ofPennington Biomedical Research Center. Stephen Anton is supported by a K23AT004251-01A2, and the Claude D. Pepper Center P30AG028740. Corby Martin issupported through a K23 DK068052-01A2. The authors have no conflicts of interestto disclose.
* Corresponding author.E-mail address: [email protected] (S.D. Anton).
Contents lists available at ScienceDirect
Appetite
journal homepage: www.e lsev ier .com/ locate /appet
0195-6663/$ – see front matter . Published by Elsevier Ltd.doi:10.1016/j.appet.2010.03.009
Research report
Effects of stevia, aspartame, and sucrose on food intake, satiety, and postprandialglucose and insulin levels§
Stephen D. Anton a,b,d,*, Corby K. Martin a, Hongmei Han a, Sandra Coulon a, William T. Cefalu a,Paula Geiselman a,c, Donald A. Williamson a
a Pennington Biomedical Research Center, Baton Rouge, LA, United Statesb Department of Aging and Geriatric Research, University of Florida, United Statesc Department of Psychology, Louisiana State University, United Statesd Institute on Aging, University of Florida, 210 E Mowry Rd., Gainesville, FL 32611, United States
Introduction
The twin epidemics of obesity and Type 2 diabetes continue toincrease in industrialized nations. Approximately two thirds ofadult Americans are currently overweight or obese and therefore atincreased risk for a number of deleterious health conditionsincluding Type 2 diabetes, heart disease, and cancer (Roth, Qiang,
Marban, Redelt, & Lowell, 2004). Although there is not specificevidence that sucrose, a disaccharide that consists of 50% glucoseand 50% fructose, consumption affects the development of diabetes(Laville & Nazare, 2009), diets consisting of high amounts ofsucrose have been found to cause weight gain (Raben, Vasilaras,Moller, & Astrup, 2002) and to have adverse effects on glucosetolerance in healthy volunteers (Cohen, Teitelbaum, Balogh, &Groen, 1966). Overconsumption of fructose has also been found tocause dyslipidemia and ectopic lipid deposition in healthy subjectswith and without a family history of Type 2 diabetes (Le et al.,2009), as well as increase visceral adiposity and decrease insulinsensitivity in overweight individuals (Stanhope et al., 2009). Inanimal models, high glycemic diets and high consumption of thenatural sugar fructose have been shown to induce a number ofmetabolic complications including hyperinsulinemia, hyperglyce-mia, hypertension, and insulin resistance (Barros et al., 2007).Moreover, recent human studies demonstrate that fructoseinfusions can induce hepatic insulin resistance (Wei, Wang,Topczewski, & Pagliassotti, 2007).
Appetite 55 (2010) 37–43
A R T I C L E I N F O
Article history:Received 30 September 2009Received in revised form 1 December 2009Accepted 10 March 2010
Keywords:SteviaAspartameSucroseFood intakeSatietyHungerInsulinogenic indexInsulin sensitivity
A B S T R A C T
Consumption of sugar-sweetened beverages may be one of the dietary causes of metabolic disorders,such as obesity. Therefore, substituting sugar with low calorie sweeteners may be an efficacious weightmanagement strategy. We tested the effect of preloads containing stevia, aspartame, or sucrose on foodintake, satiety, and postprandial glucose and insulin levels. Design: 19 healthy lean (BMI = 20.0–24.9)and 12 obese (BMI = 30.0–39.9) individuals 18–50 years old completed three separate food test daysduring which they received preloads containing stevia (290 kcal), aspartame (290 kcal), or sucrose(493 kcal) before the lunch and dinner meal. The preload order was balanced, and food intake (kcal) wasdirectly calculated. Hunger and satiety levels were reported before and after meals, and every hourthroughout the afternoon. Participants provided blood samples immediately before and 20 min after thelunch preload. Despite the caloric difference in preloads (290 kcal vs. 493 kcal), participants did notcompensate by eating more at their lunch and dinner meals when they consumed stevia and aspartameversus sucrose in preloads (mean differences in food intake over entire day between sucrose andstevia = 301 kcal, p < .01; aspartame = 330 kcal, p < .01). Self-reported hunger and satiety levels did notdiffer by condition. Stevia preloads significantly reduced postprandial glucose levels compared tosucrose preloads (p < .01), and postprandial insulin levels compared to both aspartame and sucrosepreloads (p < .05). When consuming stevia and aspartame preloads, participants did not compensate byeating more at either their lunch or dinner meal and reported similar levels of satiety compared to whenthey consumed the higher calorie sucrose preload.
Published by Elsevier Ltd.
§ The authors would like to express their appreciation to the participants andresearch associates who made it possible to complete this research project. Thisresearch was supported by the Clinical Obesity Division of the PenningtonBiomedical Research Center, as well as by the P50AT002776-01 from the NationalCenter for Complementary and Alternative Medicine (NCCAM) and the Office ofDietary Supplements (ODS) which funds the Botanical Research Center ofPennington Biomedical Research Center. Stephen Anton is supported by a K23AT004251-01A2, and the Claude D. Pepper Center P30AG028740. Corby Martin issupported through a K23 DK068052-01A2. The authors have no conflicts of interestto disclose.
* Corresponding author.E-mail address: [email protected] (S.D. Anton).
Contents lists available at ScienceDirect
Appetite
journal homepage: www.e lsev ier .com/ locate /appet
0195-6663/$ – see front matter . Published by Elsevier Ltd.doi:10.1016/j.appet.2010.03.009
• Menor aumento de glucosa post carga de stevia y aspartame en relación a sacarosa
• Menor aumento de insulina post carga de stevia en relación a aspartame y sacarosa
• Sin diferencias en apeKto ni ingesta posterior
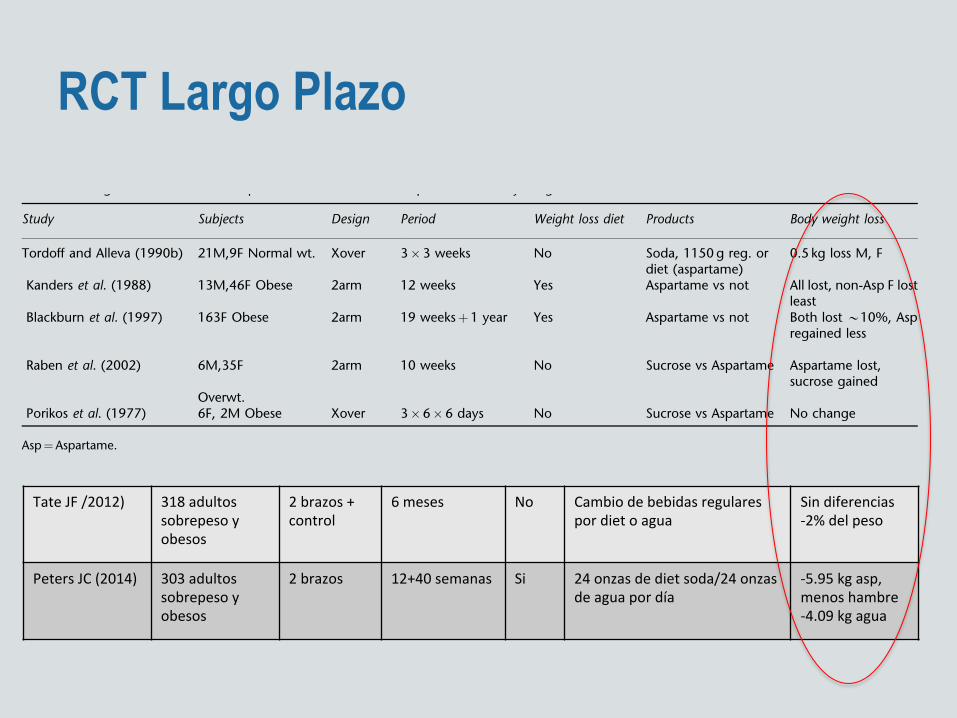
RCT Largo Plazo
reduction in sugar intake. On the other hand, Bellisle et al.(2001) found, in a cohort of 4278 French adults, aged 45–60years, that about 30% of women and 22% of men were atleast occasional users of intense sweeteners. As expected,higher body mass index (BMI) values and higher waist/hipratios were associated with more frequent use, suggestingthat overweight persons were using intense sweeteners as astrategy for weight control. Users had lower energy intakes(significant difference in men only) and consumed lesscarbohydrate than did nonusers. In a Spanish study of 2450persons (Serra-Majem et al., 1996), about 18% of thepopulation used cyclamate. Within the user group, higherBMI was associated with less frequent use. There is a dearth oflongitudinal studies on the dynamics of weight control.
The Gold Standard: the randomized controlledtrials (RCTs)
The above-cited literature covers many aspects of the broadresearch domain of intense sweeteners and their effects onappetite, intake and body weight control. They provide verydiverse and complementary pieces of information on a verycomplex subject. A recent meta-analysis (De La Hunty et al.,2006) considered only those RCTs that did measure energyintake for at least 24h and/or measured weight changes. TheRCT is considered the best experimental design, but in manycircumstances it is difficult to implement, especially whendealing with human subjects who have established habitsand preferences and will not easily be randomized. Forexample, it may be difficult to prevent sweetener use overa long period of time in a participant who has beenrandomized to a no sweetener group.
Out of dozens of works dealing with intense sweeteners’role in human nutrition, the meta-analysis addressed 15RCTs with 24-h intake data (Porikos et al., 1977, 1982; Foltinet al., 1988, 1990; Evans, 1989, 1992; Mattes, 1990a; Tordoffand Alleva, 1990b; Naismith and Rhodes, 1995; Blackburnet al., 1997; Gatenby et al., 1997; Lavin et al., 1997; Reid andHammersley, 1998; Raben et al., 2002; Van Wymelbeke et al.,2004) and nine RCTs with body weight data (Porikos et al.,
1977, 1982; Tordoff and Alleva, 1990b; Kanders et al., 1990;Naismith and Rhodes, 1995; Blackburn et al., 1997; Gatenbyet al., 1997; Reid and Hammersley, 1998; Raben et al., 2002).These RCTs showed considerable variations in their design,study population, duration and type of control. In addition,certain studies compared dietary conditions that did notonly differ by the presence or absence of intense sweeteners.For example the Foltin et al. (1988, 1992) studies did notfocus specifically on intense sweeteners but compared dietsvarying in fat as well as carbohydrate contents, therebymaking it impossible to single out the contribution ofsweeteners in the reported effects. The meta-analysis re-vealed significant reduction in energy intakes when aspar-tame was used, compared with all types of control exceptwhen aspartame was compared with non-sucrose controlssuch as water. The mean reduction was about 10% of totalenergy intake.
The meta-analysis also included consideration of potentialupward compensation for the missing energy. Such com-pensation was around 32%, but varied widely as a functionof numerous factors, among which the size of the energydeficit, the type of food or drink manipulated and thetimescale. The four studies that only manipulated soft drinkssugar content suggested a compensation of about 15.5%.Since sugar consumption is not thought to be underphysiological control (Berthoud and Seeley, 1999), there isno theoretical reason to expect that any compensation formissing sugar energy – if it occurs – will be selectivelydirected at sweet foods. Replacing sugar with intensesweeteners should, therefore, help reduce sugar intakes.The authors of the meta-analysis calculated that a conserva-tive figure for the energy deficit in aspartame users wouldpredict a weight loss of about 0.2 kg/week.
The nine studies of aspartame use including body weightdata suggested a significant weight reduction of the order of0.2 s.d. for an average diet duration of 12 weeks. For a 75-kgperson, this would represent a weight loss of around 0.2kg/week. According to de la De La Hunty et al. (2006), theclose agreement between the predicted and the observedweight loss suggests that the 0.2 kg/week estimated is robustand applicable to a variety of aspartame-containing foods.
Table 4 Long-term studies of the impact of intense sweetener aspartame on body weight
Study Subjects Design Period Weight loss diet Products Body weight loss
Tordoff and Alleva (1990b) 21M,9F Normal wt. Xover 3!3 weeks No Soda, 1150 g reg. ordiet (aspartame)
0.5 kg loss M, F
Kanders et al. (1988) 13M,46F Obese 2arm 12 weeks Yes Aspartame vs not All lost, non-Asp F lostleast
Blackburn et al. (1997) 163F Obese 2arm 19 weeksþ1 year Yes Aspartame vs not Both lost B10%, Aspregained less
Raben et al. (2002) 6M,35F 2arm 10 weeks No Sucrose vs Aspartame Aspartame lost,sucrose gained
Overwt.Porikos et al. (1977) 6F, 2M Obese Xover 3!6!6 days No Sucrose vs Aspartame No change
Asp¼Aspartame.
Intense sweeteners, energy intake and the control of body weightF Bellisle and A Drewnowski
697
European Journal of Clinical Nutrition
Tate JF /2012) 318 adultos sobrepeso y obesos
2 brazos + control
6 meses No Cambio de bebidas regulares por diet o agua
Sin diferencias -‐2% del peso
Peters JC (2014) 303 adultos sobrepeso y obesos
2 brazos 12+40 semanas Si 24 onzas de diet soda/24 onzas de agua por día
-‐5.95 kg asp, menos hambre -‐4.09 kg agua
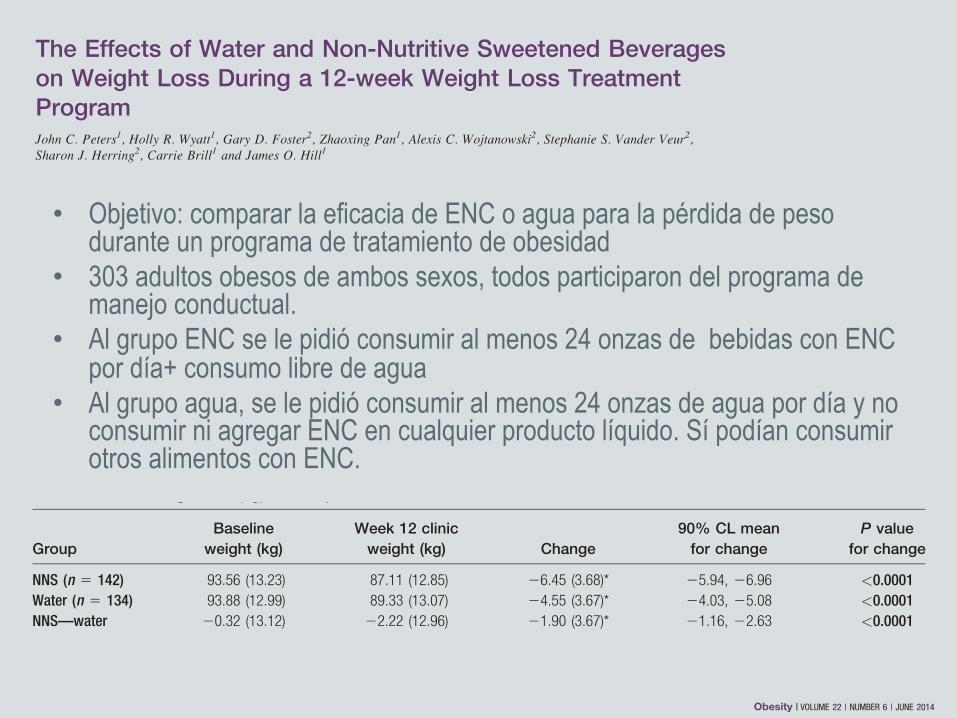
• Objetivo: comparar la eficacia de ENC o agua para la pérdida de peso durante un programa de tratamiento de obesidad
• 303 adultos obesos de ambos sexos, todos participaron del programa de manejo conductual.
• Al grupo ENC se le pidió consumir al menos 24 onzas de bebidas con ENC por día+ consumo libre de agua
• Al grupo agua, se le pidió consumir al menos 24 onzas de agua por día y no consumir ni agregar ENC en cualquier producto líquido. Sí podían consumir otros alimentos con ENC.
had confidence that it would not hinder their success. The popularmedia continues to raise questions about the value of NNS bever-ages in weight loss (21,22) citing concerns from some experts thatNNS beverage usage is associated with obesity and weight gain inobservational studies (21-23). The current results, along with resultsof Tate et al. (14), provide strong evidence from large randomizedcontrolled trials that NNS beverages do not hinder and can helpwith weight loss when compared to water. In addition, Phelan andWing examined the use of NNS beverages by those in the NationalWeight Control Registry and found that successful weight losersdrank three times the NNS beverages compared to those who hadnever lost weight (24).
We chose 12 weeks as the weight loss phase because most studiesshow that weight loss slows considerably after 6 months of treat-ment with more than half of the weight loss occurring in the first 12weeks (25,26), probably owing to difficulty with longer term adher-ence to a hypocaloric regimen. Furthermore, it is now recognizedthat weight loss is a different process from weight maintenance,both behaviorally and physiologically, so it is important to studytreatment effects on these two processes separately (27). The benefitof the current 1 year trial is that we will be able to compare bothweight loss and weight loss maintenance within the same group ofparticipants. The trial was designed to allow preplanned analysis ofthe treatment effects after just the 12-week weight loss phase aswell as after 9 months of weight maintenance (still underway) whichwill be reported separately.
While most secondary outcomes were not different between thegroups, the NNS group showed greater reductions in total- andLDL-cholesterol. This may be due to the greater weight loss in the
NSS group. There was also no significant difference between thegroups in urine osmolality although osmolality decreased slightly inthe water and increased slightly in the NNS group. It is unlikely thatchanges in hydration status were responsible for the significant dif-ferences in body weight between treatments. The small changesobserved were well within the normal range for urine osmolality(500-800 mOsmol kg21) suggesting no adverse effect on fluid intakeregulation. Physical activity increased significantly in both groups asa function of the behavioral treatment but was not significantly dif-ferent between groups. Sedentary behavior actually decreased signif-icantly in the Water group over time but not the NNS group. Thechanges over time were not significant between groups. Takentogether, changes in physical activity and sedentary behaviors cannotaccount for the difference in weight loss observed.
Based on the design of this study we are unable to say, what is themechanism for the greater weight loss in the NNS group comparedto the water group. Weekly hunger scores were significantly loweramong the NNS group than the water group although the absolutechanges were small. While it is plausible that the NNS participantswere more likely to adhere to the dietary recommendations due toless hunger than the Water group we cannot conclude this based onthis study. Some authors (3,5,6) have suggested that use of NNSmay increase appetite for sweet foods and disrupt regulation ofenergy balance. Weight loss results for the present study suggestthat NNS consumption did not increase energy intake from otherfoods compared to water. This is consistent with other studies thathave not found increased consumption of sweet or high energyfoods while using NNS (28,29). Further studies will be needed toascertain the mechanism(s) that may be responsible for the weightloss results.
TABLE 2 Baseline-carried-forward analysis for absolute weight loss (kg)
GroupBaseline
weight (kg)Week 12 clinic
weight (kg) Change90% CL
mean changeP value
for change
NNS (n 5 154) 93.91 (13.46) 87.97 (13.39) 25.95 (3.94)* 25.42, 26.47 <0.0001Water (n 5 149) 93.15 (12.94) 89.06 (12.86) 24.09 (3.74)* 23.59, 24.60 <0.0001NNS—water 0.76 (13.21) 21.09 (13.13) 21.85 (3.84)* 21.12, 22.58 <0.0001
Analysis includes those participants who dropped out of the study in the analysis, using the baseline observation carried forward. This analysis mimics the clinical setting.Although equivalence cannot be established, participants lost more weight in the NNS group as compared to the water group. All analyses were completed using a Sat-terthwaite two sample t test. All values are Mean (SD) unless otherwise noted. Statistically significant values (P < 0.05) are shown by an asterisk (*) and statistically signifi-cant P values are shown in bold.
TABLE 3 Absolute weight loss (kg) for completers
GroupBaseline
weight (kg)Week 12 clinic
weight (kg) Change90% CL mean
for changeP value
for change
NNS (n 5 142) 93.56 (13.23) 87.11 (12.85) 26.45 (3.68)* 25.94, 26.96 <0.0001Water (n 5 134) 93.88 (12.99) 89.33 (13.07) 24.55 (3.67)* 24.03, 25.08 <0.0001NNS—water 20.32 (13.12) 22.22 (12.96) 21.90 (3.67)* 21.16, 22.63 <0.0001
Analysis including participants who completed 12 weeks of the trial. Although equivalence cannot be established participants lost more weight in the NNS group as com-pared to the water group. All analyses were completed using a Satterthwaite two sample t test. All values are Mean (SD) unless otherwise noted. Statistically significantvalues (P < 0.05) are shown by an asterisk (*) and statistically significant P values are shown in bold.
Original Article ObesityCLINICAL TRIALS: BEHAVIOR, PHARMACOTHERAPY, DEVICES, SURGERY
www.obesityjournal.org Obesity | VOLUME 22 | NUMBER 6 | JUNE 2014 1419
The Effects of Water and Non-Nutritive Sweetened Beverageson Weight Loss During a 12-week Weight Loss TreatmentProgramJohn C. Peters1, Holly R. Wyatt1, Gary D. Foster2, Zhaoxing Pan1, Alexis C. Wojtanowski2, Stephanie S. Vander Veur2,Sharon J. Herring2, Carrie Brill1 and James O. Hill1
Objective: To compare the efficacy of non-nutritive sweetened beverages (NNS) or water for weight lossduring a 12-week behavioral weight loss treatment program.Methods: An equivalence trial design with water or NNS beverages as the main factor in a prospectiverandomized trial among 303 men and women was employed. All participants participated in a behavioralweight loss treatment program. The results of the weight loss phase (12 weeks) of an ongoing trial (1year) that is also evaluating the effects of these two treatments on weight loss maintenance werereported.Results: The two treatments were not equivalent with the NNS beverage treatment group losing signifi-cantly more weight compared to the water group (5.95 kg versus 4.09 kg; P < 0.0001) after 12 weeks.Participants in the NNS beverage group reported significantly greater reductions in subjective feelings ofhunger than those in the water group during 12 weeks.Conclusion: These results show that water is not superior to NNS beverages for weight loss during acomprehensive behavioral weight loss program.
Obesity (2014) 22, 1415–1421. doi:10.1002/oby.20737
IntroductionBeverage consumption recommendations (1) suggest water as thegold-standard beverage for optimal health. The US Dietary Guide-lines (2) suggest that while beverages with non-nutritive sweeteners(NNS) are preferable to those with caloric sweeteners, there is still aquestion about whether they are beneficial for weight management.While numerous clinical trials have examined the effects of nutritivesugar sweetened beverages (NS) compared to NNS beverages onweight loss, few studies have directly compared water and NNSbeverages on weight loss using an equivalence trial design.
NNS were introduced into the food supply over 50 years ago andare being used in hundreds of different food and beverage products.Despite the long history of usage there continues to be considerablecontroversy concerning their role in the diet, particularly whetherthey are a useful tool as an aid in weight loss and weight loss main-tenance (3-6). NNS provide sweetness equivalent to NS but contrib-ute essentially zero energy. Since the 1980s a number of short-termexperimental studies have compared NNS to NS and several com-prehensive reviews have concluded that the evidence supports either
a beneficial effect or no effect of NNS on appetite and energy intake(7-11). Other studies have reported findings of increased hungerwith consumption of NNS (11) but generally without an accompany-ing increase in caloric intake.
Several observational studies have reported a positive associationbetween NNS consumption and greater body weight and weight gainover time (4,12). Determining causality is not possible with thesestudies but it is possible that they represent “reverse causality”whereby obesity may cause people to seek diet beverages (10,13).
The largest and most recent randomized trial (14) to compare water,diet beverages and an attention control for their effects on weightloss used a superiority trial design. The authors found that the dietbeverage treatment, but not water, significantly increased the proba-bility of losing 5% of body weight over the 6-month study durationcompared to a standard weight loss education and monitoring pro-gram. Subjects in both treatment groups lost a significant amount ofweight but the amount of weight lost compared to the control wasnot different between treatment groups.
1 Anschutz Health and Wellness Center, University of Colorado, Anschutz Medical Campus, Aurora, CO, USA. Correspondence: John C. Peters([email protected]) 2 Temple University, Center for Obesity Research and Education, Department of Medicine, Philadelphia, PA, USA
Funding Agencies: The study was fully funded by The American Beverage Association.
Disclosure: JCP, JOH received consulting fees from The Coca-Cola Company outside of the submitted work. The remaining co-authors declared no conflict of interest.
Author contributions: JP, HW, GF, ZP, JH, were involved in study design, data analysis and data interpretation; CB, SH, SV, AW were involved in data collection. Allauthors were involved in writing the manuscript and approved the final submission.
Received: 16 January 2014; Accepted: 7 March 2014; Published online 27 May 2014. doi:10.1002/oby.20737
www.obesityjournal.org Obesity | VOLUME 22 | NUMBER 6 | JUNE 2014 1415
Original ArticleCLINICAL TRIALS: BEHAVIOR, PHARMACOTHERAPY, DEVICES, SURGERY
Obesity
This is an open access article under the terms of the Creative Commons Attribution-NonCommercial-NoDerivs License, which permits use and distribution in any medium,provided the original work is properly cited, the use is non-commercial and no modifications or adaptations are made.
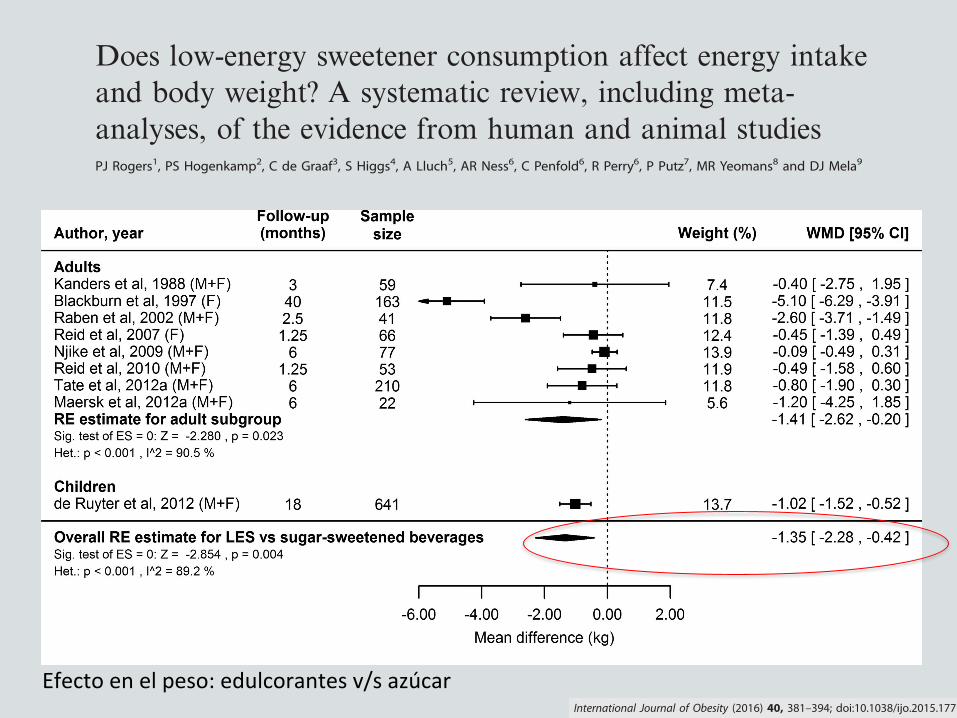
OPEN
REVIEW
Does low-energy sweetener consumption affect energy intakeand body weight? A systematic review, including meta-analyses, of the evidence from human and animal studiesPJ Rogers1, PS Hogenkamp2, C de Graaf3, S Higgs4, A Lluch5, AR Ness6, C Penfold6, R Perry6, P Putz7, MR Yeomans8 and DJ Mela9
By reducing energy density, low-energy sweeteners (LES) might be expected to reduce energy intake (EI) and body weight (BW). Toassess the totality of the evidence testing the null hypothesis that LES exposure (versus sugars or unsweetened alternatives) has noeffect on EI or BW, we conducted a systematic review of relevant studies in animals and humans consuming LES with ad libitumaccess to food energy. In 62 of 90 animal studies exposure to LES did not affect or decreased BW. Of 28 reporting increased BW, 19compared LES with glucose exposure using a specific ‘learning’ paradigm. Twelve prospective cohort studies in humans reportedinconsistent associations between LES use and body mass index (−0.002 kgm−2 per year, 95% confidence interval (CI) −0.009 to0.005). Meta-analysis of short-term randomized controlled trials (129 comparisons) showed reduced total EI for LES versus sugar-sweetened food or beverage consumption before an ad libitum meal (−94 kcal, 95% CI −122 to −66), with no difference versuswater (−2 kcal, 95% CI −30 to 26). This was consistent with EI results from sustained intervention randomized controlled trials(10 comparisons). Meta-analysis of sustained intervention randomized controlled trials (4 weeks to 40 months) showed thatconsumption of LES versus sugar led to relatively reduced BW (nine comparisons; −1.35 kg, 95% CI –2.28 to −0.42), and a similarrelative reduction in BW versus water (three comparisons; −1.24 kg, 95% CI –2.22 to −0.26). Most animal studies did not mimic LESconsumption by humans, and reverse causation may influence the results of prospective cohort studies. The preponderance ofevidence from all human randomized controlled trials indicates that LES do not increase EI or BW, whether compared with caloric ornon-caloric (for example, water) control conditions. Overall, the balance of evidence indicates that use of LES in place of sugar, inchildren and adults, leads to reduced EI and BW, and possibly also when compared with water.
International Journal of Obesity (2016) 40, 381–394; doi:10.1038/ijo.2015.177
INTRODUCTIONLow-energy sweeteners (LES), such as acesulfame-K, aspartame,saccharin, stevia and sucralose are consumed throughout theworld.1 The history of their use has been accompanied by debateand disagreements, not least about their potential nutritionalimpact. The use of LES to replace or partially replace added sugarin foods and beverages might well be expected to reduce energyintake (EI),2–4 yet over recent years there has been widely reportedspeculation that consumption of LES might increase the risk ofbecoming overweight and obese.5–7
Studies covertly manipulating energy density show higher EIafter consumption of a reduced-energy food or beverage, but thatthe degree of energy ‘compensation’ is variable.8 Crucially, energycompensation is usually lower than the difference in energycontent of the comparison foods/beverages, seemingly beinglowest of all for liquids.8 This suggests that consuming LES in placeof sugar-sweetened products should reduce overall EI, andparticularly so for consumption of beverages, the most popularvehicles for LES.1 The question also arises whether the presence ofLES in beverages affects appetite and EI relative to plain water.1,9
Although the imprecise control of short-term energy balancepredicts that LES consumption should help reduce EI andtherefore reduce risk of overweight and obesity,3,10 it is possiblethat, as consumed in everyday life, other effects of LES balance oreven outweigh the energy dilution effect. For example, a lowcalorie or ‘diet’ label may cause the consumer to eat a largerportion of the product or eat more of accompanying foods in themeal, or eat more later.11–14 More simply, adding sweetness to aproduct may increase intake owing to increased palatability.15,16
Or, by ‘uncoupling’ the relationship between sweetness andenergy content, the consumption of LES may undermine theusefulness of sweetness as a cue in the control of energybalance.5,17–20
The effects of LES consumption on EI and body weight (BW)have been the subject of many studies over the past 30 years;nonetheless there is no clear consensus about this body ofevidence. Taken together, a number of narrative reviews1–4,21–25
and systematic reviews of some types of studies26–30 lead to theconsistent but guarded conclusion that substitution of LES forsugar, especially in beverages, can help reduce EI, but that fully
1School of Experimental Psychology, University of Bristol, Bristol, UK; 2Department of Neuroscience, Uppsala University, Uppsala, Sweden; 3Division of Human Nutrition,Wageningen University, Wageningen, the Netherlands; 4The School of Psychology, University of Birmingham, Birmingham, UK; 5Danone Research, Centre Daniel Carasso, RD,Palaiseau Cedex, France; 6National Institute for Health Research Biomedical Research Unit in Nutrition, Diet and Lifestyle at the University Hospitals Bristol NHS Foundation Trustand the University of Bristol and School of Oral and Dental Sciences, University of Bristol, Level 3, University Hospitals Bristol Education Centre, Bristol, UK; 7European Branch, ILSIEurope a.i.s.b.l., Brussels, Belgium; 8School of Psychology, University of Sussex, Brighton, UK and 9Unilever R&D Vlaardingen, Vlaardingen, the Netherlands. Correspondence:Dr P Putz, European Branch, ILSI Europe a.i.s.b.l., Avenue E. Mounier 83, Box 6, Brussels B-1200, Belgium.E-mail: [email protected] 13 November 2014; revised 28 August 2015; accepted 28 August 2015; accepted article preview online 14 September 2015; advance online publication, 10 November 2015
International Journal of Obesity (2016) 40, 381–394© 2016 Macmillan Publishers Limited All rights reserved 0307-0565/16
www.nature.com/ijo
only, females only or both), BW category (all weights, overweightand obese only or obese only) and length of follow-up suggestedthese study characteristics are not important sources of hetero-geneity (Supplementary Table S15). Egger’s regression test(Supplementary Table S6) and visual inspection of funnel plots(Supplementary Figure S9) suggest that small-study bias is unlikelyto be present. However, these assessments of bias and sources ofheterogeneity are limited by the small number of studies and highlevel of heterogeneity.The secondary meta-analysis of BW change using LES products
versus water was based on three comparisons with 541 adults. Therandom effects model indicates a statistically significant reductionin BW in adults using LES products compared with water, with aneffect size only slightly smaller than that observed for compar-isons with sugar-sweetened products (Figure 4).Sensitivity analyses suggested that using imputed standard
deviations did not substantially alter the outcomes of the analyses(details in Supplementary Table S16).The results of the ‘risk of bias’ and ‘methodological quality’
assessments are summarised in Supplementary Tables S17 and S18.They highlight that full blinding of the interventions (forparticipants and some personnel) was not possible inmany studies. However, most papers also did not explicitlystate whether outcome assessors were blinded to the inter-ventions, or the methods of randomisation and allocation.Furthermore, there was inconsistent reporting of the nature ofdropouts, and some studies only reported on participants fullycompleting the treatment arm(s) despite significant (410%)dropouts.
CommentaryAlthough these sustained intervention studies vary in design andquality, and several were not primarily intended to test effects ofconsumption of LES, the results are nevertheless consistent.In all cases, the use of LES led to a relative reduction in EI, andgreater loss (or reduced gain) of BW. Notably, there was noexample of a sustained exposure intervention trial where LESuse led to a relative increase in mean EI or BW. This wassupported quantitatively by the results of the meta-analyses of BWchange, indicating lower relative BWs in LES intervention arms.Furthermore, outcomes were similar in studies with children andadults, and followed a similar pattern whether participants wereblinded or not blinded to the intervention. Consumption ofLES-sweetened beverages also reduced BW relative to consump-tion of water.In addition to the studies meeting the criteria for inclusion here,
there are also studies in adults and children where LES were acomponent of a mixed or more complex diet or lifestylemanipulation.95,186–190 Although these other studies provide onlyindirect evidence, their results were consistent with the ‘pure’ LESinterventions; that is, treatments that included LES wereassociated with reductions or no change in EI or BW. No examplewas found where an intervention specifically including LES led to arelative increase in EI or BW.Taken at face value, these results show that consumption of LES
compared with sugar leads to either no change or a relativereduction in EI and energy balance. More unexpectedly, however,LES also led to reductions in BW relative to water. There are,however, some possible limitations to this evidence base toconsider.
Figure 4. Forest plots showing individual and combined effect sizes for sustained intervention studies comparing the effects on BW of LESversus sugar (upper panel) and LES versus water (lower panel). Mean difference is weight change (end point minus baseline) in the LEScondition minus weight change in the sugar condition over the intervention period (a negative score favours LES). Squares represent meandifference in BW for the individual comparisons; square size is proportional to the weight of each comparison; horizontal lines represent 95%CIs; diamonds represent the summary estimates and 95% CIs from random effects models for comparisons in adults for LES versus sugar,adults and children for LES versus sugar, and adults for LES versus water. BW, body weight; LES, low-energy sweetener.
Low-energy sweeteners systematic reviewPJ Rogers et al
388
International Journal of Obesity (2016) 381 – 394 © 2016 Macmillan Publishers Limited
Efecto en el peso: edulcorantes v/s azúcar
Placer por lo dulce, azúcar y obesidad
Edulcorantes artificiales: no tan rápido!
Mecanismos propuestos para el “daño”
Evidencia actual
Conclusiones
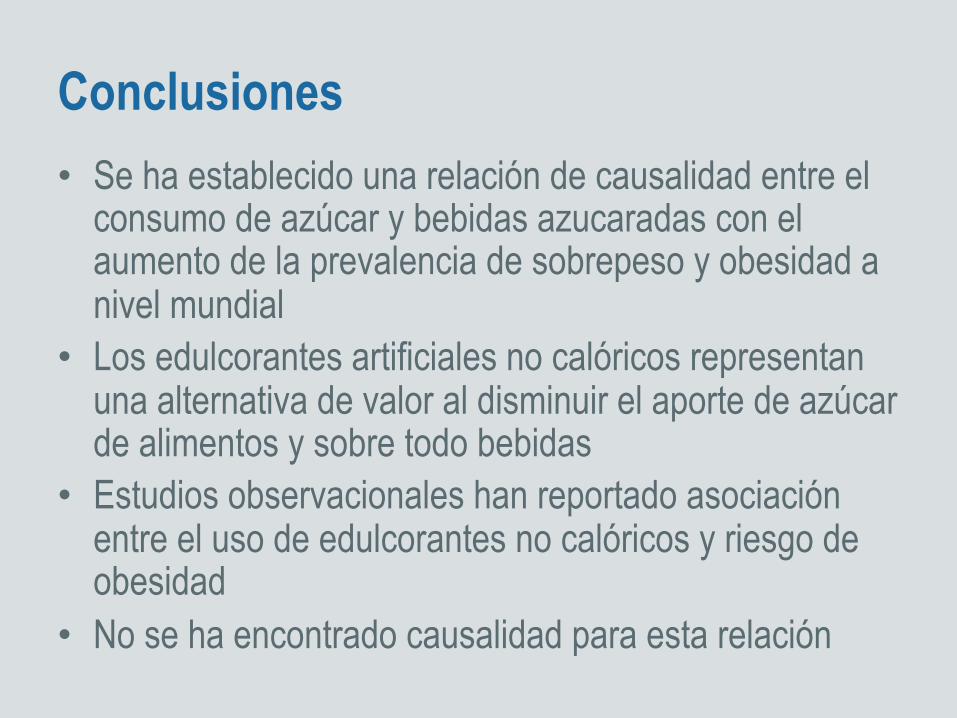
Conclusiones • Se ha establecido una relación de causalidad entre el
consumo de azúcar y bebidas azucaradas con el aumento de la prevalencia de sobrepeso y obesidad a nivel mundial
• Los edulcorantes artificiales no calóricos representan una alternativa de valor al disminuir el aporte de azúcar de alimentos y sobre todo bebidas
• Estudios observacionales han reportado asociación entre el uso de edulcorantes no calóricos y riesgo de obesidad
• No se ha encontrado causalidad para esta relación
• De la gran cantidad de estudios, de diferente diseño, publicados, se puede desprender que el uso de edulcorantes no tendría efectos adversos en baja de peso ni su mantención.
• No se ha demostrado beneficio significativo en la baja de peso con el uso de edulcorantes artificiales.
• Por qué habría de esperarse que sólo por el hecho de consumir edulcorantes no calóricos alguien pudiera perder peso??...
• Los edulcorantes no calóricos podrían promover la baja de peso en el contexto de una “dieta” o cambios activos en la conducta alimentaria.


