41
Euprimecare Modelos de Atención Primaria Calidad y Costes en Europa Grant Agreement No. 241595
| Date post: | 31-Dec-2015 |
| Category: |
Documents |
| Upload: | miriam-stone |
| View: | 48 times |
| Download: | 6 times |

EuprimecareModelos de
Atención PrimariaCalidad y Costes en Europa
Grant Agreement No. 241595

Equipo ISCIII
Almudena Albertos Sonia García Javier Prado Galbarro Virginia del Pino
Patricia García Cediel Ely Parody Xily Martín
Mª Angeles Guzmán Carlos Segovia

Triangulo de Hierro
Coste
Calidad
Acceso

Triangulo de Hierro
Eficiencia
Efectividad
Equidad

Atención primaria “fuerte”
¿Qué es una Atención Primaria fuerte?

Modelo conceptual común para describir los modelos de Atención Primaria en Europa
Consenso trans-nacional sobre cómo medir Calidad en Atención Primaria
Las diferencias en los modelos de financiación y pago dificultan saber los Costes en Atención Primaria
Necesidades de información

Objetivo
Þ Explorar las relaciones que pueden existir entre Calidad y Costes de los Modelos de Atención Primaria en Europa

• Institute of Health Carlos III. ISCIII. Spain • Universität Bielefeld. UNIBI. Germany • University of Tartu. UTartu. Estonia • National Institute for Strategic Health Research. GYEMSZI.
Hungary • Országos Alapellátási Intezet. OALI. Hungary • Institute for health and Welfare. THL. Finland • Kaunas University of Medicine. LSMU. Lithuania• Universitá Commerciale Luigi Bocconi. UB. Italy
Partners

Marco Conceptual
Desarrollar una metodología y medir Calidad
WP 5 & 6
WP 3 & 4
WP 7
WP2
CO
OR
DIN
AC
ION
W
P 1
DIS
EM
INA
CIO
N
W
P 8
MODELOS
REGULACION
FINANCIACION
PAGOORGANIZACION
COMPORTAMIENTO ORGANIZATIVO
Desarrollar una metodología y medir Costes

• Costes
• Calidad
Perspectivas

Modelos de Atención Primaria
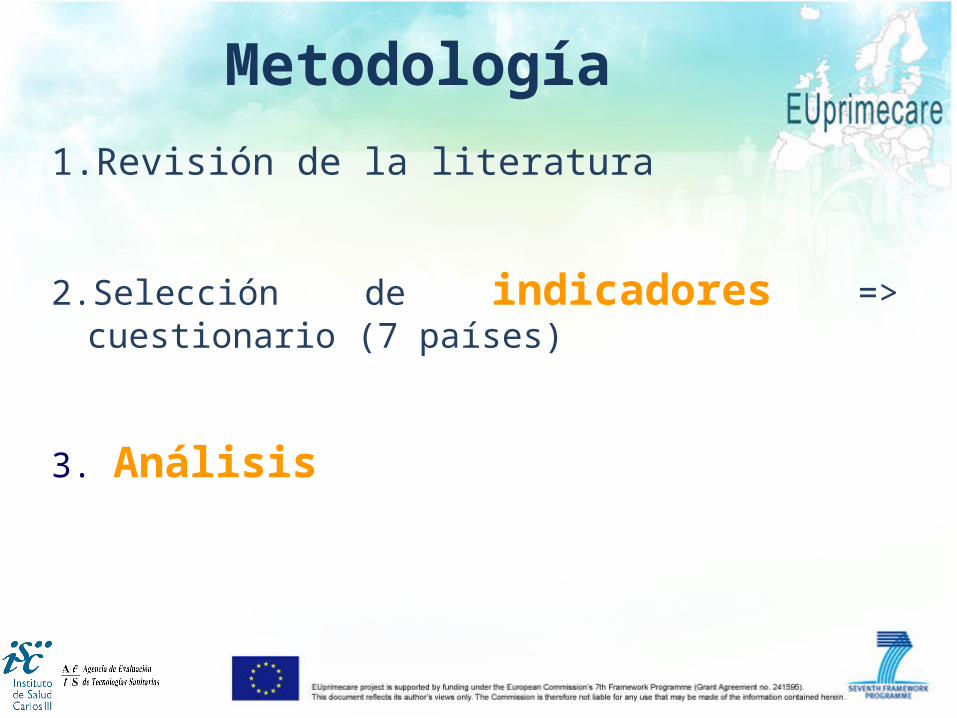
Metodología
1. Revisión de la literatura
2. Selección de indicadores => cuestionario (7 países)
3. Análisis

Results of Qualitative analysis
Based on a functional perspective, allowed to proposing 5 models:
1.Direct access to specialist
2.Referral required from GP, mainly solo-practices in PC3.Referral required from GP, mainly group-practices in PC
4.Health care centers5.Polyclinics
• Modelo 1, Acceso directo a especialista, AP solos (Alemania)
• Modelo 2, Derivación al especialista, AP solos (Hungría, Italia)
• Modelo 3, Derivación al especialista, AP grupos(Estonia, Lituania)
• Modelo 4, Derivación al especialista, redes (Finlandia, España)
• Modelo 5, Policlínicos (Shemasko), no necesariamente AP
Modelos funcionales
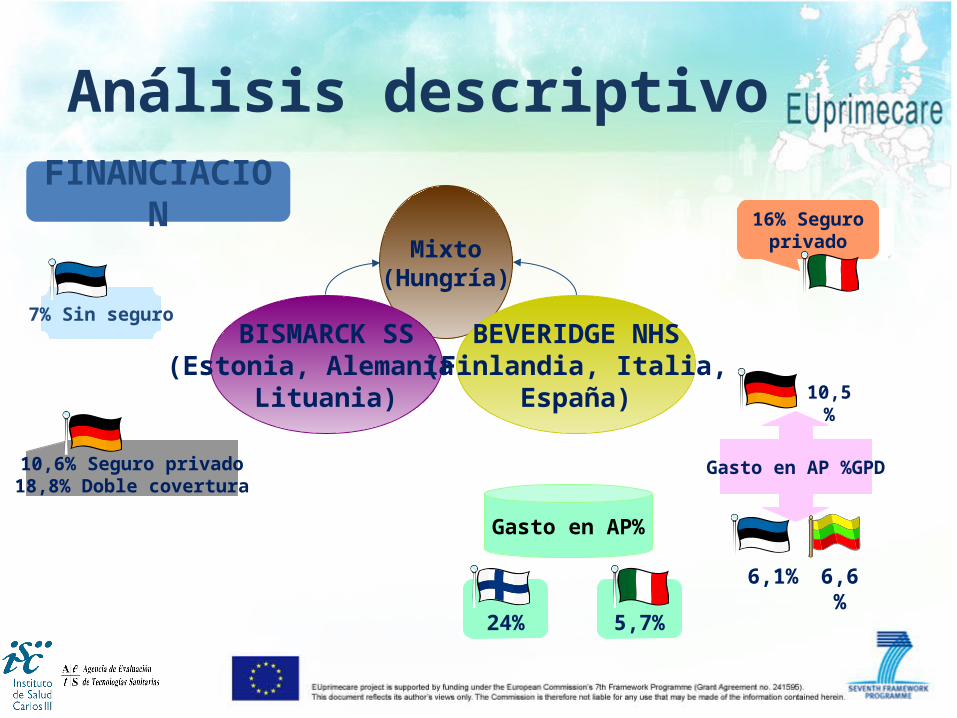
FINANCIACIONMixto
(Hungría)
BISMARCK SS(Estonia, Alemania,
Lituania)
BEVERIDGE NHS(Finlandia, Italia,
España)
7% Sin seguro
10,6% Seguro privado18,8% Doble covertura
Gasto en AP %GPD
10,5%
6,1% 6,6%
24%
Gasto en AP%
5,7%
16% Seguro privado
Análisis descriptivo

• Mecanismos formales para garantizar accessibilidad/equidad, calidad
• Derivaciones (excepto en Alemania)
• Centros:• Mayoritariamente pública: Finlandia, España, Hungría, Lituania• Totalmente privada: Alemania, Estonia, Italia
• Modelos de trabajo: • Red integrada: Finlandia y España• Solo & grupo: Alemania, Italia Lituania, Hungría
REGULACION
ORGANIZACION
Análisis descriptivo

Servicios en AP

Sistema nacional/regiona/loca (SI/NO) Seguro voluntario privado (SI/NO)
Planificación de la distribución de servicios de AP (SI/NO)
Pago a profesionales (Capitación/Salario/Pago por acto/Pago pacientes)
Derivación a especialistas (SI/NO) Centros públicos-privados Forma de trabajo (Solo/Grupo/Redes)
Gestión y mejora de calidad (SI/NO) Formación continuada (SI/NO) Guías de práctica clínica locales (SI/NO)
FINANCIACION
REGULACION
ORGANIZACION
PAGO
CONDUCTAORGANIZATIVA
Características para definir modelos de AP

Multidimensional => Complejo => Realista
Servicios y actividadesFinanciación
Pago a profesionalesDerivaciones
Público-privadoFormas de trabajo
Conclusiones

Costes

• Viñetas clínicas
Agudos Crónicos Promoción y educación para la salud Prevención (vacuna)
Micro-costes
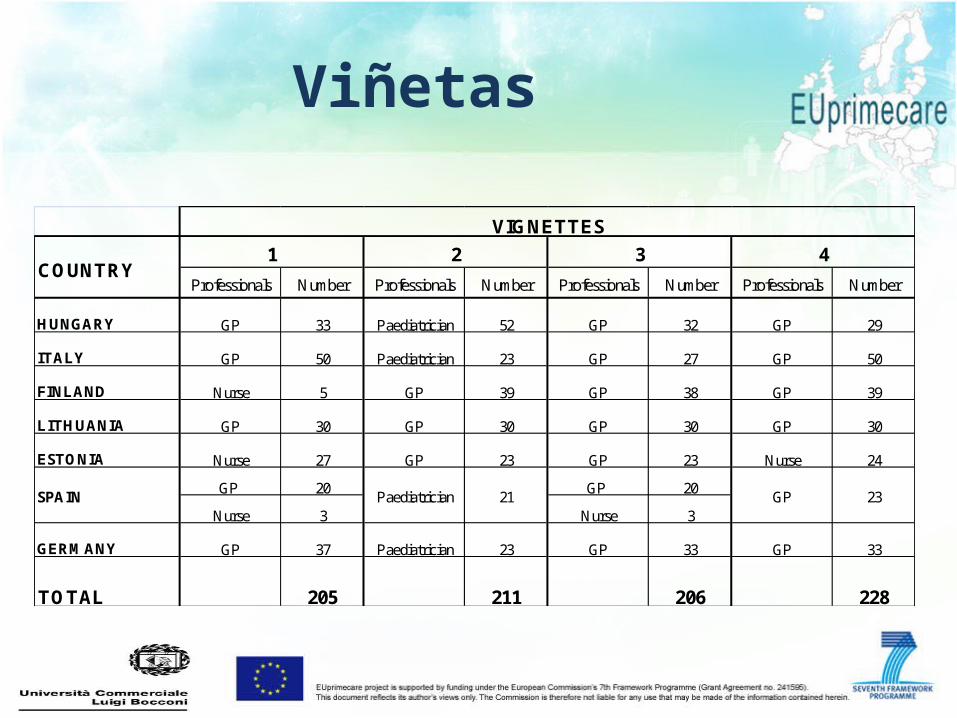
Viñetas
Professionals Number Professionals Number Professionals Number Professionals Number
HUNGARY GP 33 Paediatrician 52 GP 32 GP 29
ITALY GP 50 Paediatrician 23 GP 27 GP 50
FINLAND Nurse 5 GP 39 GP 38 GP 39
LITHUANIA GP 30 GP 30 GP 30 GP 30
ESTONIA Nurse 27 GP 23 GP 23 Nurse 24
GP 20 GP 20
Nurse 3 Nurse 3
GERMANY GP 37 Paediatrician 23 GP 33 GP 33
TOTAL 205 211 206 228
4
SPAIN GP 23Paediatrician 21
VIGNETTES
COUNTRY1 2 3

V2 – Niño de 2 años: Profesionales
Country Total cases PaediatricianGeneral
Physician Nurse SecretaryOther PC
professional
Hungary 52 100,00% 50,00% 28,85% 30,77%
Italy 23 100,00% 8,70% 21,74% 0,00%
Finland 39 100,00% 66,67% 33,33% 10,26%
Lithuania 30 100,00% 60,00% 10,00% 10,00%
Estonia 23 100,00% 69,57% 8,70% 17,39%
Spain 21 100,00% 47,62% 9,52% 0,00%
Germany 23 100,00% 0,00% 86,96% 0,00%
All countries 211 100,00% 46,45% 28,44% 12,80%

V2 – Niño de 2 años: Tiempos
Hungary Italy Finland Lithuania Estonia Spain Germany
Paediat./General Physician
Average time per case 13,9 16,3 13,8 15,7 14,7 13,4 12,7
Nurse
Average time per case 3,3 0,7 6,3 5,3 4,0 6,2 0,0
Other PC professional
Average time per case 2,5 0,0 0,8 0,4 0,7 0,0 0,0
Total time per case 19,8 17,0 20,9 21,4 19,3 19,6 12,7

V2 – Niño de 2 años: Variabilidad
Hungary Italy Finland Lithuania Estonia Spain Germany
Paediat./General Physician
Min 5 10 1 1 1 6 5
Max 30 38 30 30 20 40 30
ST.DEV. 6,64 5,92 5,82 5,97 5,48 7,70 5,90
Average time per patient 13,88 16,35 13,85 15,67 14,65 13,38 12,65

V2 – Niño de 2 años: Patrones clínicos
Hungary Italy Finland Lithuania Estonia Spain GermanyAll
countries
Pharmacological Treatment 94,23% 95,65% 87,18% 76,67% 65,22% 100,00% 95,65% 88,15% Categories of drugs Fever reducer 24,49% 54,55% 5,88% 26,09% 0,00% 42,86% 9,09% 23,12%Bronchodilator 81,63% 50,00% 97,06% 73,91% 80,00% 85,71% 100,00% 82,26%Antibiotics 18,37% 36,36% 2,94% 21,74% 20,00% 4,76% 0,00% 14,52%Anti-inflammatory 10,20% 36,36% 0,00% 4,35% 0,00% 0,00% 0,00% 7,53%
Hungary Italy Finland Lithuania Estonia Spain Germany All countries
Diagnostic tests 38,46% 30,43% 46,15% 50,00% 82,61% 0,00% 26,09% 40,28%
Specialist involved 40,38% 8,70% 64,10% 23,33% 17,39% 4,76% 0,00% 28,44%

V2 – Niño de 2 años: Micro-costes
Hungary Italy Finland Lithuania Estonia Spain GermanyPaediat./General Physician € 3,86 € 26,83 € 14,13 € 4,17 € 5,05 € 16,24 € 59,51
Nurse € 0,74 € 0,27 € 3,01 € 0,79 € 0,58 € 5,34
Secretary € 0,55 € 0,67 € 0,45 € 0,02 € 0,06 € 0,04 Assistant/Trainee € 0,70 € - € 0,61 € 0,03 € 0,09 € -
TOTAL LABOUR COST € 5,86 € 27,78 € 18,20 € 5,01 € 5,78 € 21,62 € 59,51
DRUGS COST € 8,47 € 11,83 € 9,28 € 5,11 € 3,59 € 4,66 € 13,07
TESTS COST € 3,40 € 4,71 € 2,92 € 4,29 € 4,52 € - € 16,03
OUT-OF-POCKET € - € - € - € - € - € - € - TOTAL COST € 17,72 € 44,32 € 30,39 € 14,41 € 13,88 € 26,27 € 88,62
Ho
url
y c
ost
Calidad

• Grupos Focales:Pacientes (n= 53)Profesionales (n= 64)7 países
• Identificar sus perspectivas sobre la calidad y proponer una lista de criterios de calidad
• Revisión de la literatura para buscar Indicadores no-clínicos para cada criterio priorizados de acuerdo a su importancia y factibilidad
• Consenso entre los investigadores
Metodología

60 Indicadores
Methodology Quality Indicators

Encuesta poblacional: 3.020 persons 25-75 años de edad 7 países DominiosDomains:
Medida de calidad a nivel poblacional
Socio-demográficos
Utilización
SatisfacciónEstado de
salud
Prevención y promoción de
la salud

INDICADORES DE SATISFACCION
Mean SD
The way how available appointments with Primary Care (PC) suit your needs 4.05 .993
The average waiting time for an appointment with PC to get non-urgent care 3.81 1.078
Waiting time in the waiting room in PC 3.69 1.080
Appropriate length of consultations with the PC doctor 4.15 .898
Ease of talking about all your problems to the PC doctor 4.25 .894
Listening skills of your PC doctor 4.27 .867
Explanation of tests and treatments by the PC doctor 4.13 .918
Preventive activities and services to prevent illnesses (vaccines. counseling. diagnostic tests) offered in primary care 3.86 1.034
Diagnostic test offered in primary care 3.96 1.004
Helpfulness of staff of primary care (not including the PC doctor. but nurses. patient service staff. etc.) 4.26 .832
Overall satisfaction with the attention provided by PC services 4.03 .911
The average waiting time for an appointment with PC to get non-urgent care 3.81 1.078
Waiting time in the waiting room in PC 3.69 1.080
Preventive activities and services to prevent illnesses (vaccines. counseling. diagnostic tests) offered in primary care 3.86 1.034
Diagnostic test offered in primary care 3.96 1.004
Ease of talking about all your problems to the PC doctor 4.25 .894
Listening skills of your PC doctor 4.27 .867
Helpfulness of staff of primary care (not including the PC doctor. but nurses. patient service staff. etc.) 4.26 .832

SATISFACCION SEGÚN PAISESCountry Mean SD
Hungary 4.39 .81
Italy 4.38 .77
Estonia 4.27 .86
Spain 3.93 .70
Finland 3.88 .94
Lithuania 3.77 .92
Germany 3.57 0.99
Media=4.03

Estonia Germany Spain Lithuania Italy Hungary Finland0
10
20
30
40
50
60
70
80
90
100
0.724.02
0.46 1.64 0.70 0.47 2.572.42
8.27
2.557.03
0.70 1.86
5.84
15.70
30.50
18.10
25.53
11.86 12.35
17.52
31.88
40.90
61.25
44.26
33.72 28.44
48.83
49.28
16.31 17.6321.55
53.0256.88
25.23
Overall satisfaction with the attention provided by PC services (%)/Countries
Totally satisfied Very satisfiedSatisfied DissatisfiedVery dissatisfied
SATISFACCION (%)

OVERALL SATISFACTION ACCORDING TO SOCIO-DEMOGRAPHIC CHARACTERISTICS
Categories Mean SD
Sexo
Hombres 4.00 .90
Mujeres 4.05 .92
Edad
25-34 3.91 .89
35-49 3.92 .94
50-64 4.05 .90
65-75 4.26 .84
Lugar de residencia
Rural (<10.000) 4.09 .89
Urbano (10.000+) 3.99 .92

SATISFACCION SEGÚN MODELOS DE FINANCIACION
SS NHS p value
The way how available appointments with Primary Care (PC) suit your needs 4.12 3.95 p<0.001
The average waiting time for an appointment with PC to get non-urgent care 3.85 3.77 p=0.004
Waiting time in the waiting room in PC 3.75 3.61 p<0.001
Appropriate length of consultations with the PC doctor 4.25 4.02 p<0.001
Ease of talking about all your problems to the PC doctor 4.33 4.14 p<0.001
Listening skills of your PC doctor 4.39 4.11 p<0.001
Explanation of tests and treatments by the PC doctor 4.19 4.5 p<0.001
Preventive activities and services to prevent illnesses (vaccines. counseling. diagnostic tests) offered in primary care 3.81 3.92 p=0.019
Diagnostic test offered in primary care 3.82 4.12 p<0.001
Helpfulness of staff of primary care (not including the PC doctor. but nurses. patient service staff. etc.) 4.35 4.11 p<0.001
Overall satisfaction (SD) 4.00(0.96)
4.06(0.84) p<0.301
Explanation of tests and treatments by the PC doctor 4.19
Preventive activities and services to prevent illnesses (vaccines. counseling. diagnostic tests) offered in primary care 3.81
Diagnostic test offered in primary care 3.82

UTILIZACION SEGÚN MODELOS DE FINANCIACION

UTILIZACIÓN DE SERVICIOS SEGÚN MODELO DE FINANCIACIÓN
NHS SS
% Toma de tensión 67,7 81,6
% Medida colesterol 42,6 53,4
% Medida azúcar 43,3 58,1
% Consejos sobre dieta (alcohol, menos de un año) 8,5 5,4
% Consejos sobre ejercicio (menos de un año) 43,1 29,6
% Mamografías (menos de un año) 32,4 24,1
% Citología (menos de un año) 39,1 37,8

Encuesta a profesionales:
Historias clínicas:
Diabetes e hipertensión9 indicadores Metodología específicas en cada país
Medida de calidad a nivel poblacional

INDICADOR Estonia Lituania Finlandia Hungría Alemania Italia
TA EN HTA≤ 140/90 ≤140/90 ≤ 140/85 ≤140/90 NA NA
TA EN DM2 ≤130/85 ≤130/80 <130/80 ≤130/80 <140/90 ≤ 130/80
Diferencias entre países

Dank! Tänan!
Kiitos!KÖSZÖNÖM!
Grazie!ačiū!
Gracias!

Lecciones de coordinar un proyecto
http://www.youtube.com/watch?feature=player_embedded&v=wA1_aw2wAYI
http://www.youtube.com/watch?v=AaO1FzE6J9I&feature=player_embedded
http://www.youtube.com/watch?feature=player_embedded&v=LCLeuJiEXOQ
http://www.youtube.com/watch?feature=player_detailpage&v=ll-nIv1oakM


