Hipoglucemia Diabética al día de hoy: Manejo y conecciones con ECV 1 Noviembre 2019 Punta Cana, República Dominicana Traído para Usted por miembros del International Hypoglycaemia Study Group Un evento exclusivo del Grupo Internacional para el Estudio de la hipoglucemia (IHSG) En el Congreso de la Asociación Latinoamericana de Diabetes 2019
Transcript
Hipoglucemia Diabética al día de hoy: Manejo y conecciones con ECV
1 Noviembre 2019
Punta Cana, República Dominicana
Traído para Usted por miembros del International Hypoglycaemia Study Group
Un evento exclusivo del Grupo Internacional para el Estudio de la hipoglucemia (IHSG)En el Congreso de la Asociación Latinoamericana de Diabetes 2019
Bienvenida del Coordinador
Pablo Aschner, MD, MSc
Profesor Asociado de Endocrinología,
Escuela de Medicina de la Universidad Javeriana
Asesor de investigaciones, Hospital Universitario San Ignacio
Director Científico, Asociación Colombiana de Diabetes
Bogotá, Colombia
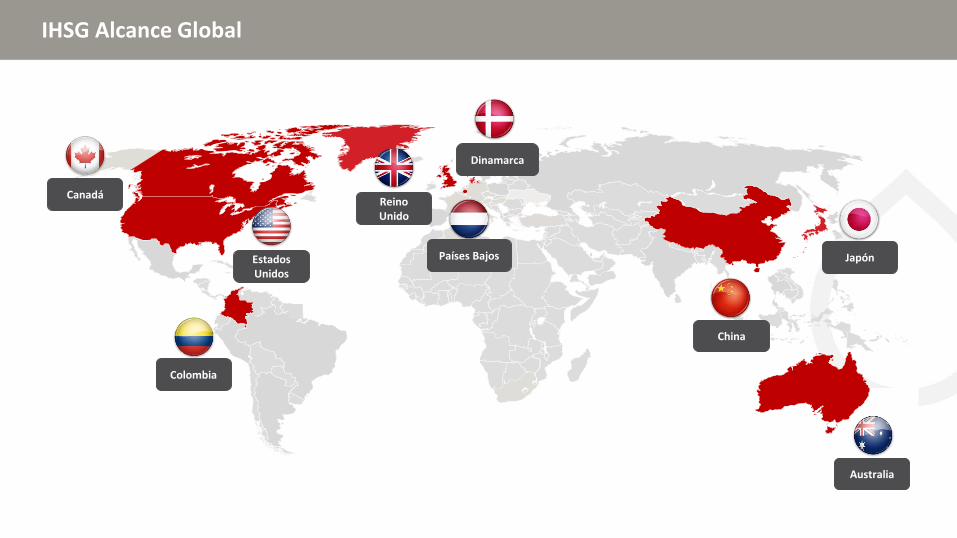
ReinoUnido
EstadosUnidos
Canadá
Colombia
Dinamarca
Países Bajos
China
Australia
Japón
IHSG Alcance Global
IHSG Miembros
Stephanie Amiel Pablo Aschner
Linda Gonder-Frederik
Belinda Childs Philip Cryer Brian Frier
Munehide Matsuhisa
Kamlesh KhuntiSimon Heller
Bastiaan de Galan
Tim Jones Lawrence Leiter
Yingying Luo Rory McCrimmon Ulrik Pedersen-Bjergaard Elizabeth Seaquist Sofia Zoungas
Miren hasta dónde hemos llegado
ADA ChicagoPrimera reunión
2013
EASD VienaSimposio
2014
IDF VancouverEncuentro con
experto
2015
Set diapositivaspara educación
de Profesionalesde la Salud
Publicación sobreClasificación de la
Hipoglucemia
WCPD9 AtlantaSimposio
2016
Lanzamientodel sitio web
del IHSG
EASD LisboaSimposio
IDF Abu Dhabi Simposio
2017
Herramientaspara
Profesionalesde la Saludy Pacientes
EASD BerlinSimposio
2018
Publicación Lancet Diabetes & Endocrinology
Módulo ECV e Hipoglucemia
Módulo ReconocimientoHipoglucemia Alterado
Módulo Educando Pacientescon Diabetes y sus
Cuidadores*
ALAD Punta Cana Simposio
Se establece como Grupo de Estudio de la EASD
2019
* Módulo disponible en español
Por qué la hipoglucemia importa
La incidencia de hipoglucemia aumenta enla medida que el pacientese acerca a las metas de HbA1c en el tratamiento
Es un problema no suficientementereconocido que
amerita mayor estadode alerta
Hay una falta de entendimiento tanto por
los profesionales como por los pacientes
Entenderla mejorpuede mejorar la
calidad de vida del paciente
Una mirada al Simposio de hoy
6:10 pm – 6:30 pmPanel P&RPablo Aschner, Simon Heller, Lawrence Leiter, Elizabeth Seaquist
5:10 pm – 5:30 pmLa clasificación de hipoglucemia del IHSGSimon Heller
5:30 pm – 5:50 pmHipoglucemia y Enfermedad Cardiovascular Lawrence Leiter
5:50 pm – 6:10 pmManejando Riesgo de Hipoglucemia con Nueva TecnologíaElizabeth Seaquist
El International Hypoglycaemia Study Group (IHSG) está apoyado por un grant de Novo Nordisk A/S y es
consistente con su compromiso continuado con la Diabetes
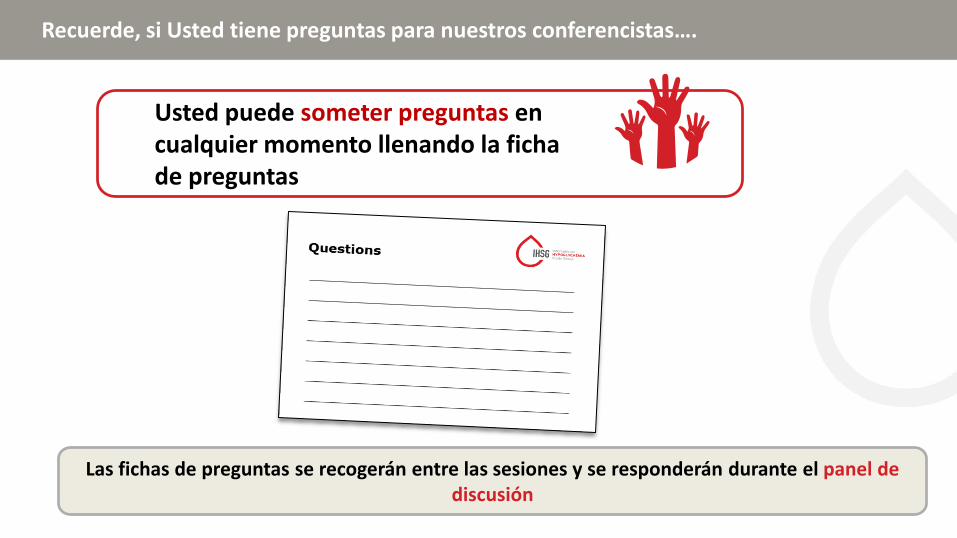
Recuerde, si Usted tiene preguntas para nuestros conferencistas….
Las fichas de preguntas se recogerán entre las sesiones y se responderán durante el panel de discusión
Usted puede someter preguntas encualquier momento llenando la fichade preguntas
La clasificación de hipoglucemia del IHSG
Simon Heller, BA, MB, Bchir, DM, FRCP Profesor de Diabetes Clínica
Universidad de SheffieldDirector de Investigación y Desarrollo
y Médico Consultante HonorarioHospitales Docentes de Sheffield
NHS Foundation Trust
Sheffield, Reino Unido
Disclosures
Advisory board member
• Eli Lilly, Novo Nordisk, Boehringer Ingelheim, Sanofi Aventis, Zealand
Speaker’s Bureau
• Eli Lilly, Novo Nordisk
Agenda
IHSG, International Hypoglycaemia Study Group
Issues addressed by IHSG and others
Background and history
Conclusions
1
2
3
Agenda
IHSG, International Hypoglycaemia Study Group
Issues addressed by IHSG and others
Background and history
Conclusions
1
2
3
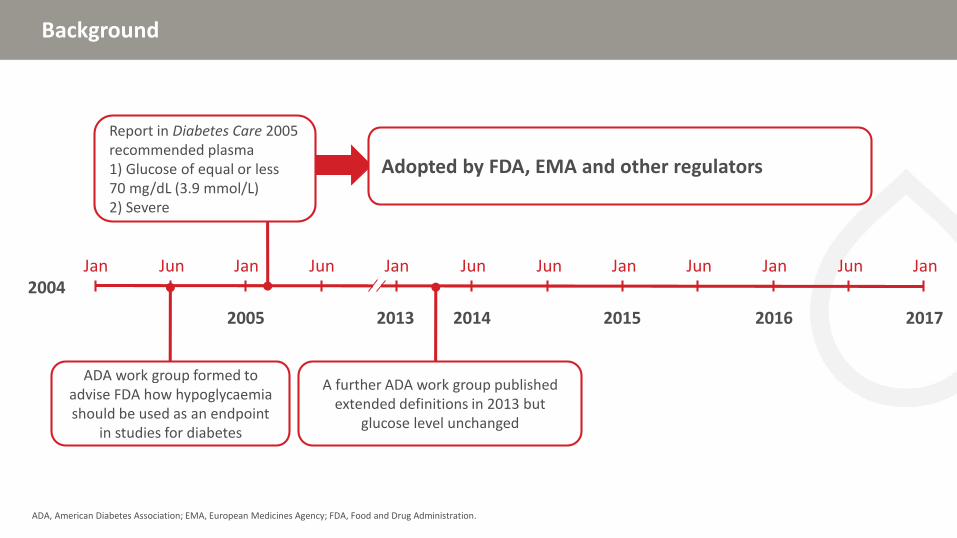
Background
ADA, American Diabetes Association; EMA, European Medicines Agency; FDA, Food and Drug Administration.
Jan Jun Jan Jun Jan Jun Jun Jan Jun Jan Jun Jan2004
2005 2013 2014 2015 2016 2017
ADA work group formed to advise FDA how hypoglycaemia should be used as an endpoint
in studies for diabetes
A further ADA work group published extended definitions in 2013 but
glucose level unchanged
Adopted by FDA, EMA and other regulators
Report in Diabetes Care 2005 recommended plasma 1) Glucose of equal or less 70 mg/dL (3.9 mmol/L)2) Severe
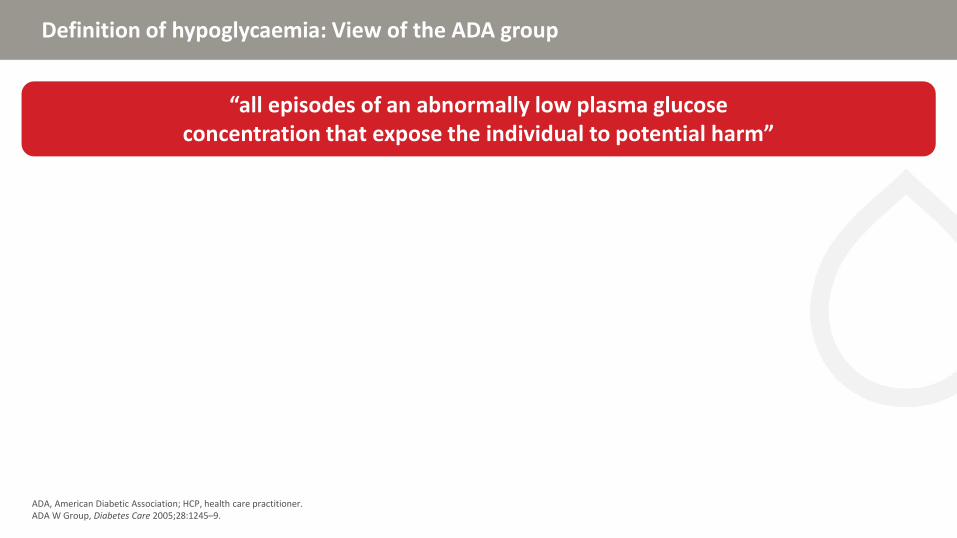
Definition of hypoglycaemia: View of the ADA group
ADA, American Diabetic Association; HCP, health care practitioner.ADA W Group, Diabetes Care 2005;28:1245–9.
“all episodes of an abnormally low plasma glucose concentration that expose the individual to potential harm”
Definition of hypoglycaemia: View of the ADA group
ADA, American Diabetic Association; HCP, health care practitioner.ADA W Group, Diabetes Care 2005;28:1245–9.
• Clinical decisions by people with diabetes and HCPs
• Studies of diabetes drugs, devices, or management strategies
The definition should apply to…
Definition of hypoglycaemia: View of the ADA group
ADA, American Diabetic Association; HCP, health care practitioner.ADA W Group, Diabetes Care 2005;28:1245–9.
• Free from reporting biases• Clinically important• Applicable to all persons with diabetes
at any time of day• Measurable by practical and widely
available methods• Reportable in a standardized fashion
and should be…
Critique of ADA consensus
ADA, American Diabetes Association.Frier BM. Diabetologia; 2009;52:31–4; Cryer PE Diabetologia 2009;52:35–7.
• Plasma glucose falls to lower levels in health • Defining hypoglycaemia as any value <3.9 mmol/L leads
to overestimation of clinically significant hypoglycaemia• Short-lived hypoglycaemia does not lead to impaired symptomatic
or counterregulatory responses
Response of the chair
• Not possible to state a single plasma glucose concentration that defines hypoglycaemia because the glycaemic thresholds… are dynamic
• Clinical practice trumps differences in methods of measurement, needs of industry
• 70 mg/dL based on potential to induce hypoglycaemia unawareness
Symptoms requiring active assistance of another person to treat; independent of blood glucose
Symptoms with a measured low plasma glucose, self-treated
No typical symptoms but a measured low plasma glucose
Typical symptoms of hypoglycaemia with a measured plasma glucose concentration above 3.9 mmol/L
Symptoms typical of hypoglycaemia are not accompanied by a plasma glucose determination
Classification of hypoglycaemia in diabetes
Seaquist ER et al. 2013;36:1384–95.
Severe
Symptomatic
Asymptomatic
Pseudo
Probable symptomatic
Definition of hypoglycaemia remained a plasma glucose of equal or less than 70 mg/dL (3.9 mmol/L)
Agenda
IHSG, International Hypoglycaemia Study Group
Issues addressed by IHSG and others
Background and history
Conclusions
1
2
3
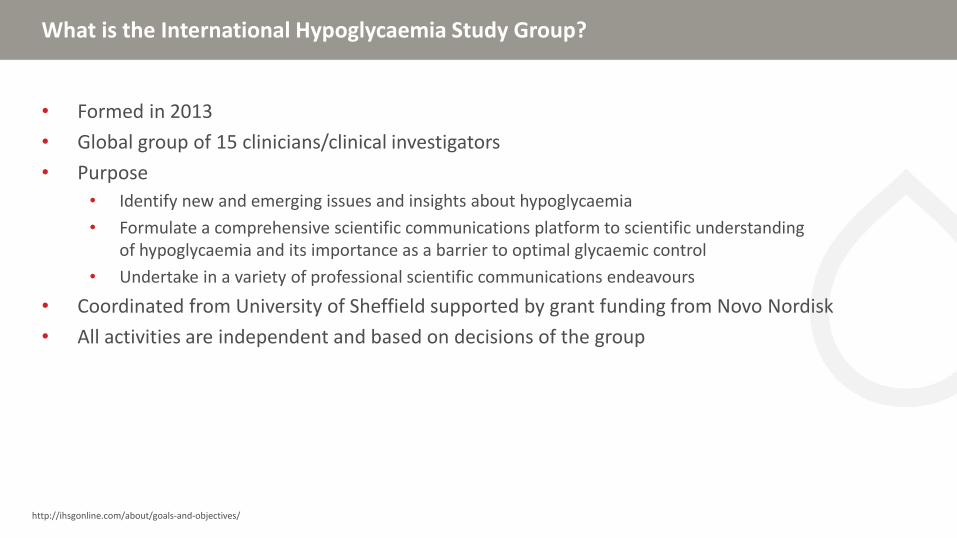
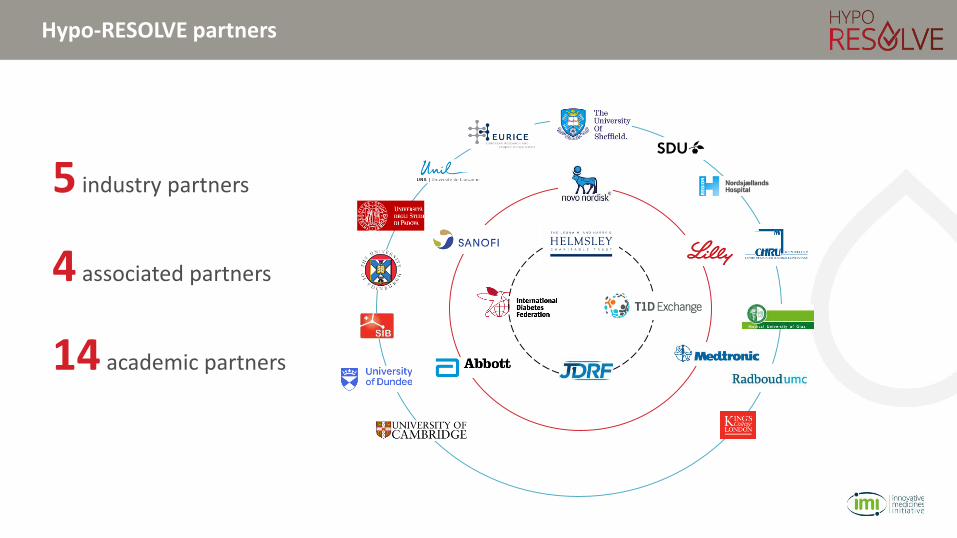
What is the International Hypoglycaemia Study Group?
• Formed in 2013
• Global group of 15 clinicians/clinical investigators
• Purpose
• Identify new and emerging issues and insights about hypoglycaemia
• Formulate a comprehensive scientific communications platform to scientific understanding of hypoglycaemia and its importance as a barrier to optimal glycaemic control
• Undertake in a variety of professional scientific communications endeavours
• Coordinated from University of Sheffield supported by grant funding from Novo Nordisk
• All activities are independent and based on decisions of the group
http://ihsgonline.com/about/goals-and-objectives/
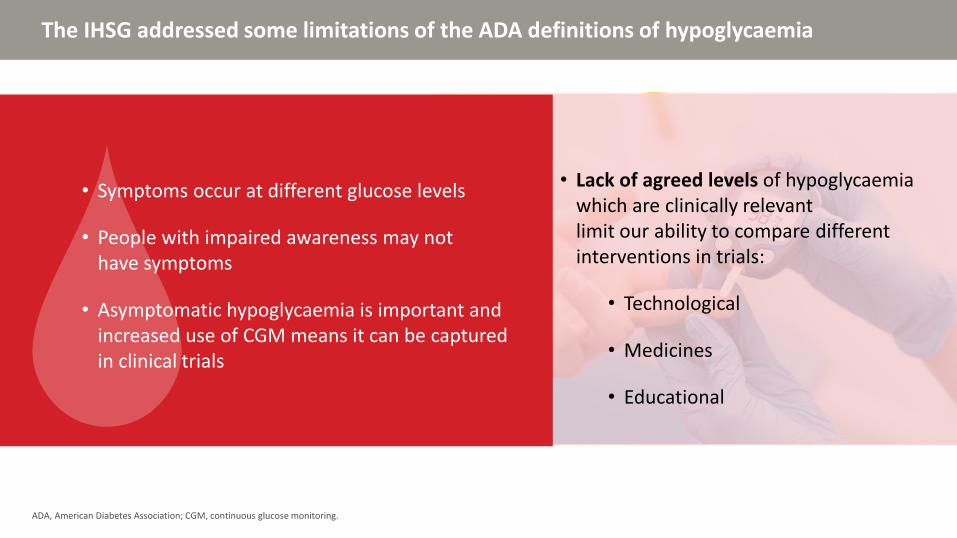
The IHSG addressed some limitations of the ADA definitions of hypoglycaemia
ADA, American Diabetes Association; CGM, continuous glucose monitoring.
• Symptoms occur at different glucose levels
• People with impaired awareness may not have symptoms
• Asymptomatic hypoglycaemia is important and increased use of CGM means it can be captured in clinical trials
• Lack of agreed levels of hypoglycaemia which are clinically relevant limit our ability to compare different interventions in trials:
• Technological
• Medicines
• Educational
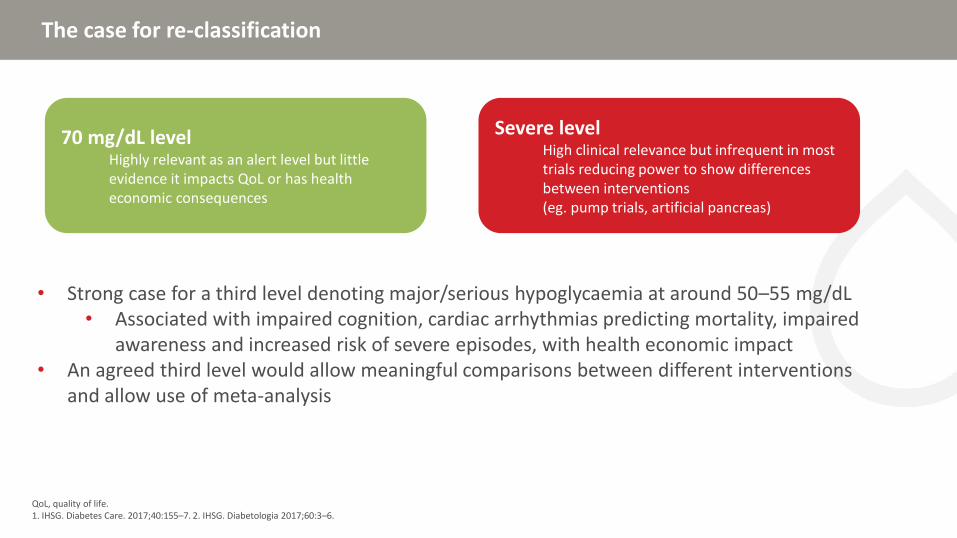
70 mg/dL levelHighly relevant as an alert level but little evidence it impacts QoL or has health economic consequences
Severe levelHigh clinical relevance but infrequent in most trials reducing power to show differences between interventions (eg. pump trials, artificial pancreas)
• Strong case for a third level denoting major/serious hypoglycaemia at around 50–55 mg/dL• Associated with impaired cognition, cardiac arrhythmias predicting mortality, impaired
awareness and increased risk of severe episodes, with health economic impact• An agreed third level would allow meaningful comparisons between different interventions
and allow use of meta-analysis
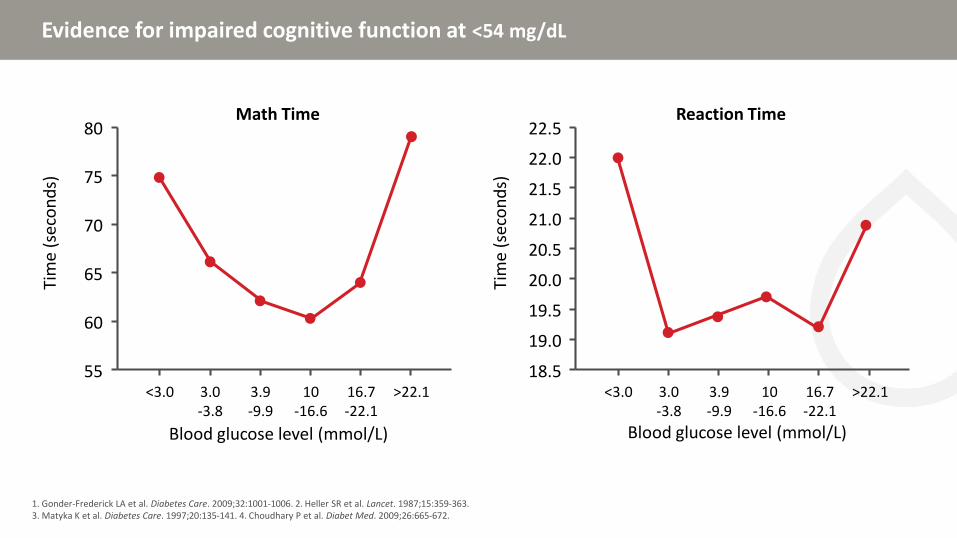
Evidence for impaired cognitive function at <54 mg/dL
1. Gonder-Frederick LA et al. Diabetes Care. 2009;32:1001-1006. 2. Heller SR et al. Lancet. 1987;15:359-363. 3. Matyka K et al. Diabetes Care. 1997;20:135-141. 4. Choudhary P et al. Diabet Med. 2009;26:665-672.
80
75
70
65
60
55<3.0 3.0
-3.83.9-9.9
10-16.6
16.7-22.1
>22.1
Blood glucose level (mmol/L)
Tim
e (s
eco
nd
s)
Math Time22.5
22.0
21.0
20.0
19.5
18.5<3.0 3.0
-3.83.9-9.9
10-16.6
16.7-22.1
>22.1
Blood glucose level (mmol/L)
Tim
e (s
eco
nd
s)
Reaction Time
19.0
20.5
21.5
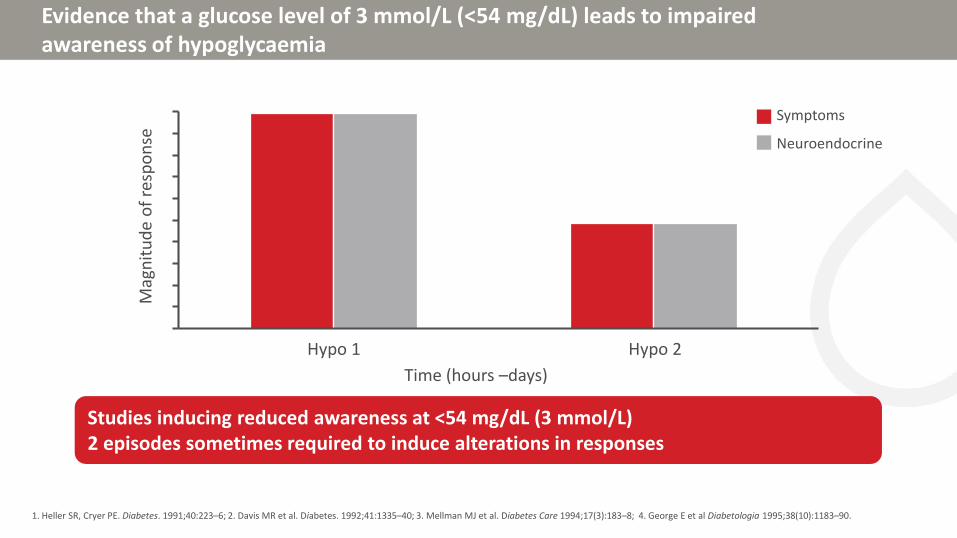
Evidence that a glucose level of 3 mmol/L (<54 mg/dL) leads to impaired awareness of hypoglycaemia
1. Heller SR, Cryer PE. Diabetes. 1991;40:223–6; 2. Davis MR et al. Diabetes. 1992;41:1335–40; 3. Mellman MJ et al. Diabetes Care 1994;17(3):183–8; 4. George E et al Diabetologia 1995;38(10):1183–90.
Studies inducing reduced awareness at <54 mg/dL (3 mmol/L)2 episodes sometimes required to induce alterations in responses
Symptoms
Neuroendocrine
Hypo 1 Hypo 2
Time (hours –days)
Mag
nit
ud
e o
f re
spo
nse
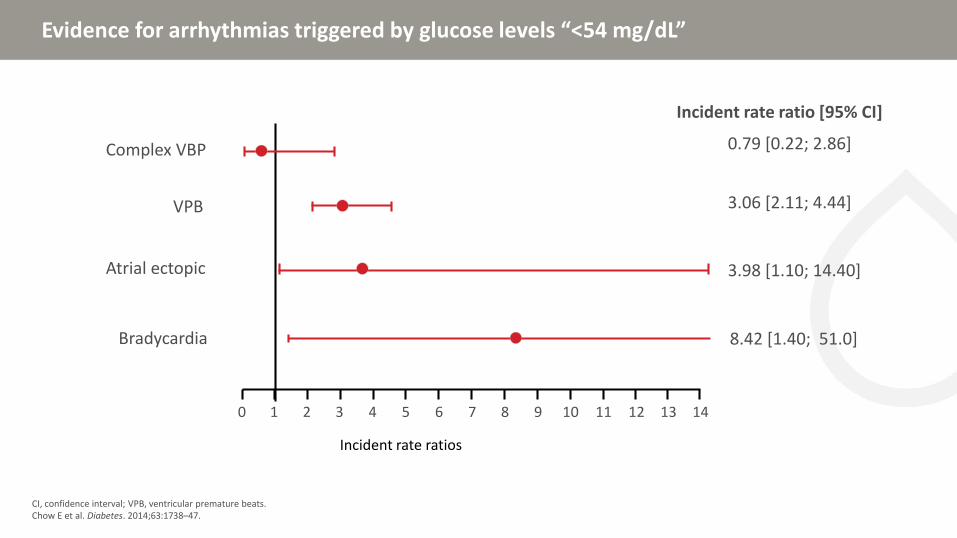
Evidence for arrhythmias triggered by glucose levels “<54 mg/dL”
CI, confidence interval; VPB, ventricular premature beats.Chow E et al. Diabetes. 2014;63:1738–47.
Incident rate ratio [95% CI]
7 81 90 3 102 4 115 6 12
Incident rate ratios
Bradycardia 8.42 [1.40; 51.0]
13 14
3.98 [1.10; 14.40]Atrial ectopic
VPB 3.06 [2.11; 4.44]
0.79 [0.22; 2.86]Complex VBP
ADA/EASD position statements
International Hypoglycaemia Study Group. Diabetes Care 2017; 40:155–57; International Hypoglycaemia Study Group. Diabetologia 2017;60:3–6.
5.0
4.0
1.0
3.0
2.0
Blood glucose
mmol/L
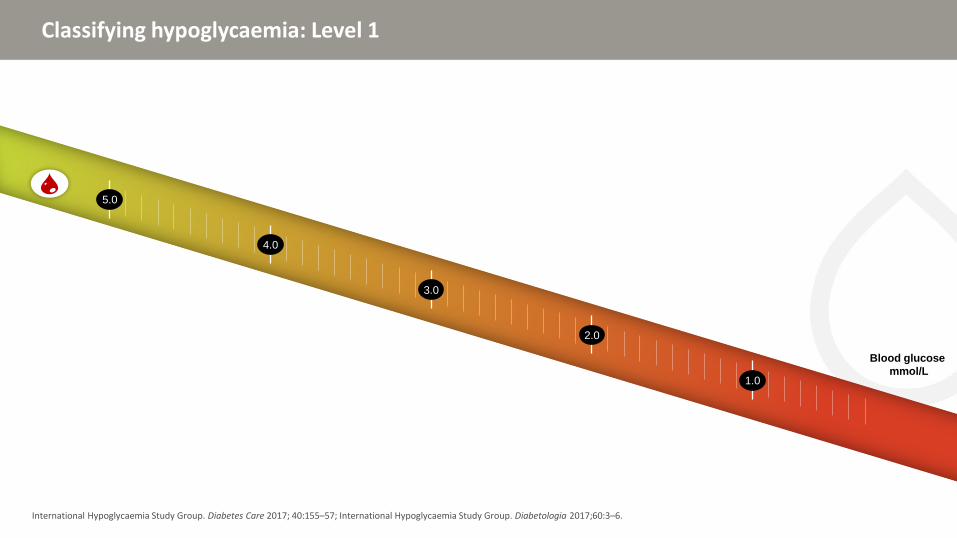
Classifying hypoglycaemia: Level 1
International Hypoglycaemia Study Group. Diabetes Care 2017; 40:155–57; International Hypoglycaemia Study Group. Diabetologia 2017;60:3–6.
5.0
4.0
1.0
3.0
2.0
• Alert value for patients and clinicians• Often asymptomatic • Requires re-checking• May require alterations in insulin dose/type
70 mg/dL (3.9 mM)
Alert value for patients (and clinicians)
Blood glucose
mmol/L
Classifying hypoglycaemia: Level 1
International Hypoglycaemia Study Group. Diabetes Care 2017; 40:155–57; International Hypoglycaemia Study Group. Diabetologia 2017;60:3–6.
5.0
4.0
1.0
3.0
2.0
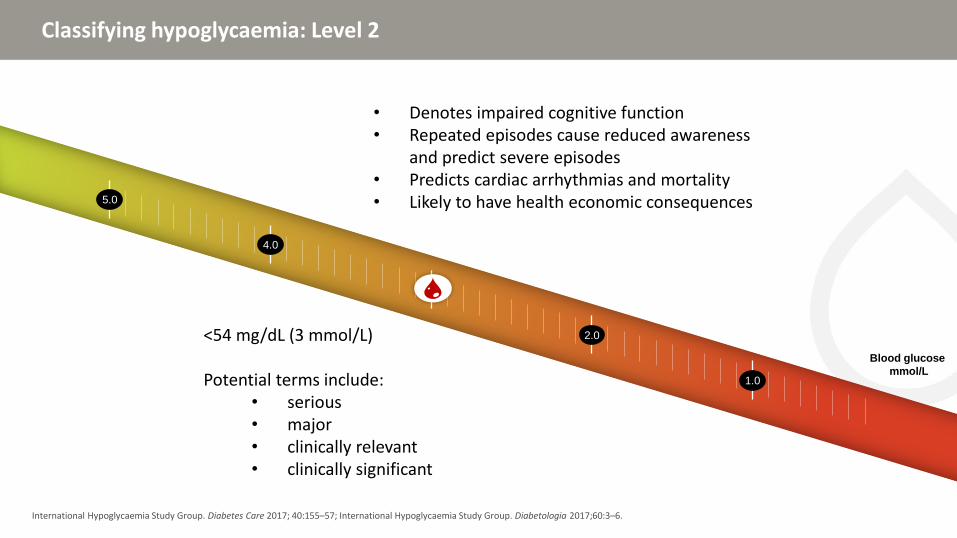
Classifying hypoglycaemia: Level 2
International Hypoglycaemia Study Group. Diabetes Care 2017; 40:155–57; International Hypoglycaemia Study Group. Diabetologia 2017;60:3–6.
• Denotes impaired cognitive function• Repeated episodes cause reduced awareness
and predict severe episodes• Predicts cardiac arrhythmias and mortality• Likely to have health economic consequences
Classifying hypoglycaemia: Level 2
International Hypoglycaemia Study Group. Diabetes Care 2017; 40:155–57; International Hypoglycaemia Study Group. Diabetologia 2017;60:3–6.
Blood glucose
mmol/L
5.0
4.0
1.0
3.0
2.0
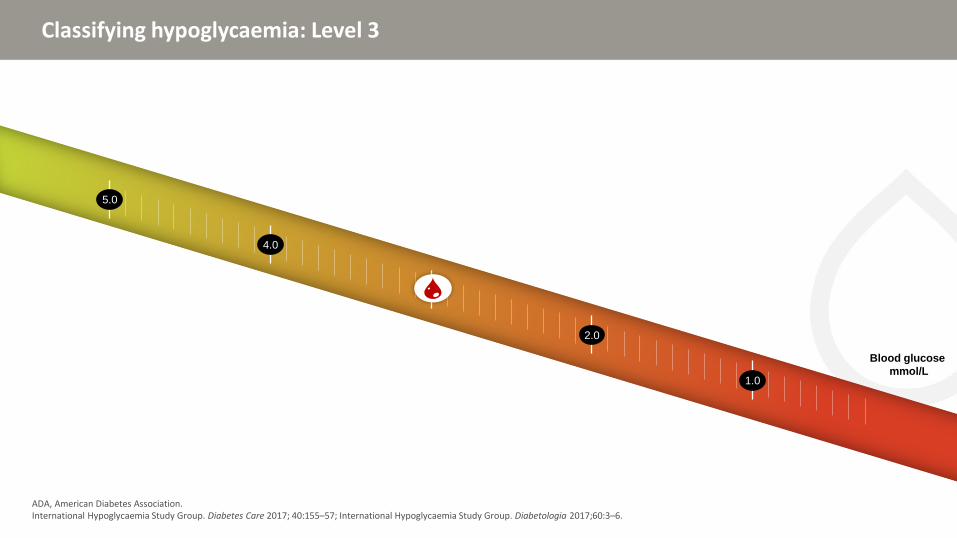
Classifying hypoglycaemia: Level 3
ADA, American Diabetes Association.International Hypoglycaemia Study Group. Diabetes Care 2017; 40:155–57; International Hypoglycaemia Study Group. Diabetologia 2017;60:3–6.
Blood glucose
mmol/L
5.0
4.0
1.0
3.0
2.0
Severe hypoglycaemia
• Severe cognitive impairment• Requiring external assistance • Coma/seizure• As defined by ADA working group• Does not require blood glucose measurement
Classifying hypoglycaemia: Level 3
ADA, American Diabetes Association.International Hypoglycaemia Study Group. Diabetes Care 2017; 40:155–57; International Hypoglycaemia Study Group. Diabetologia 2017;60:3–6.
Blood glucose
mmol/L?
Continuing progress
• Adopted as position statement by ADA/EASD
• Similar classification proposed by JDRF T1D Outcomes Program Statement
• Glucose level of 3.0 mmol/L (54 mg/dL) accepted by ATTD Consensus on continuous glucose measurement
• Classification incorporated into new ISPAD guidelines
• Classification included in draft EMA recommendations for clinical trials
• FDA position is presently unclear
ADA, American Diabetes Association; ATTD, Advanced Technologies & Treatments for Diabetes; EASD, European Association for the Study of Diabetes; EMA European Medicnes Agency JDRF, Juvenile Diabetes Research Foundation; ISPAD, International Society for Pediatric and Adolescent Diabetes; T1D, type 1 diabetes.
• AstraZeneca, Boehringer Ingelheim, Eli Lilly, GlaxoSmithKline, Janssen, Merck, Novo Nordisk, Sanofi, Servier
Agenda
CV, cardiovascular; CVD, cardiovascular disease.
Topic
Epidemiology of hypoglycemia and CVD
Risk of hypoglycemia in large cardiovascular outcomes trials
Hypoglycemia: mediator or marker of CVD risk
Mechanisms of hypoglycemia-induced increased CV risk
Agenda
CV, cardiovascular; CVD, cardiovascular disease.
Topic
Epidemiology of hypoglycemia and CVD
Risk of hypoglycemia in large cardiovascular outcomes trials
Hypoglycemia: mediator or marker of CVD risk
Mechanisms of hypoglycemia-induced increased CV risk
The consequences of hypoglycemia
Desouza CV et al. Diabetes Care 2010;33:1389–94; Frier BM et al. Diabetes Care 2011;34(Suppl. 2):S132–S1377; Frier BM. Nat Rev Endocrinol 2014;10:711–22. Gjedde A et al. Diabetes 2015;64(Suppl. 1):A91.
The consequences of hypoglycemia
Desouza CV et al. Diabetes Care 2010;33:1389–94; Frier BM et al. Diabetes Care 2011;34(Suppl. 2):S132–S1377; Frier BM. Nat Rev Endocrinol 2014;10:711–22. Gjedde A et al. Diabetes 2015;64(Suppl. 1):A91.
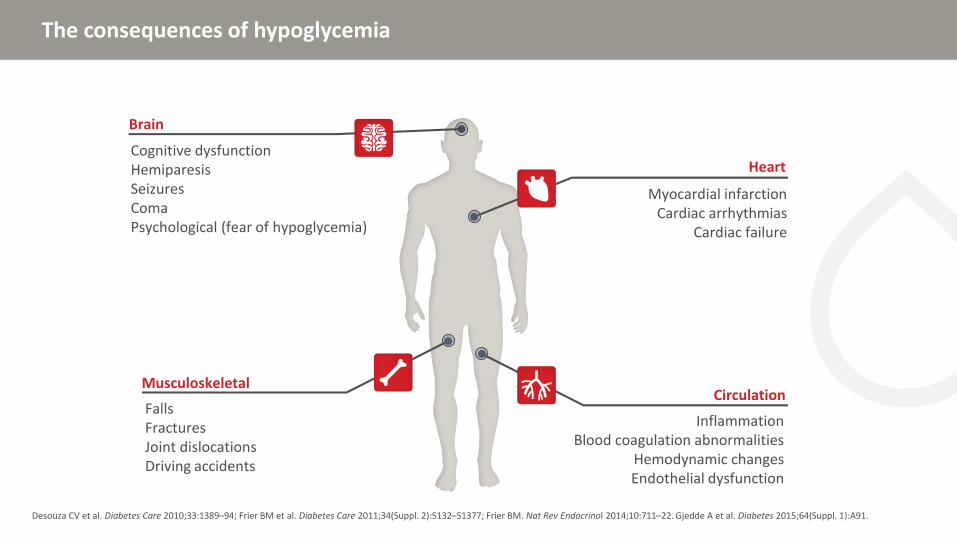
Brain
Cognitive dysfunctionHemiparesis SeizuresComaPsychological (fear of hypoglycemia)
The consequences of hypoglycemia
Desouza CV et al. Diabetes Care 2010;33:1389–94; Frier BM et al. Diabetes Care 2011;34(Suppl. 2):S132–S1377; Frier BM. Nat Rev Endocrinol 2014;10:711–22. Gjedde A et al. Diabetes 2015;64(Suppl. 1):A91.
Brain
HeartCognitive dysfunctionHemiparesis SeizuresComaPsychological (fear of hypoglycemia)
Myocardial infarctionCardiac arrhythmias
Cardiac failure
Musculoskeletal
FallsFracturesJoint dislocationsDriving accidents
The consequences of hypoglycemia
Desouza CV et al. Diabetes Care 2010;33:1389–94; Frier BM et al. Diabetes Care 2011;34(Suppl. 2):S132–S1377; Frier BM. Nat Rev Endocrinol 2014;10:711–22. Gjedde A et al. Diabetes 2015;64(Suppl. 1):A91.
Brain
HeartCognitive dysfunctionHemiparesis SeizuresComaPsychological (fear of hypoglycemia)
Myocardial infarctionCardiac arrhythmias
Cardiac failure
MusculoskeletalCirculation
InflammationBlood coagulation abnormalities
Hemodynamic changesEndothelial dysfunction
FallsFracturesJoint dislocationsDriving accidents
Hypoglycemia is associated with increased CVD events and mortality in type 1 and 2 diabetes
*p<0.001. †p<0.05.Population based on the Clinical Practice Research database, including 3 260 patients with T1D and 10 422 patients with T2D. CV events defined as myocardial infarction, stroke, or CV death. HR .CV, cardiovascular; CVD, cardiovascular disease.Khunti K et al. Diabetes Care 2015;38:316–22
1.10
1.95
1.70
1.941.922.05
1.50
2.39
0.00
0.50
1.00
1.50
2.00
2.50
3.00
History of CVD before indexNo CVD before index
CV events All-cause mortality
CV events All-cause mortality
T1D T2D
Ad
just
ed h
azar
d r
atio *
*
*
*
*
†
†
Epidemiological cohorts link hypoglycemia to CV events and mortalityin type 1 diabetes
*Type 1 and type 2 diabetes. ARIC, Atherosclerosis Risk in Communities; CHD, coronary heart disease; CV, cardiovascular; CVD, cardiovascular disease; SH, severe hypoglycemia.1. Lu CL et al. Diabetes Care 2016;39:1571–8; 2. Leong A et al. J Clin Endocrinol Metab 2016;101:659–68; 3. Sejling AS et al. Diabet Med 2016;33:77 –83; 4. Khunti K et al. Diabetes Care 2015;38:316 –22; 5. Lung TW et al. Diabetes Care 2014;37:2974–81.
Epidemiological cohorts Year Severity Follow up Effect Hazard ratio
Taiwan database1 (N=4361) 2016 SH 5 years CVD
US Academic Primary Care Network2* (N=9173)
2016 Not defined
6 years CHD without previous CADCHD in high vascular risk patientsCHD in those aged ≥65 years
Dutch (n=482)and Danish Cohorts (n=269)3
2016 SH 6.5 years12 years
All cause deathCV death
No associationNo association
UK GP database4 (N=3260) 2015 SH median 5.0 years
Type 1 CVD secondary Type 1 CVD
Swedish Diabetes Register5
(N=1839)2014 5 years All cause death
0 2 4 6 8 10 12
Epidemiological cohorts link hypoglycemia to CV events and mortalityin type 2 diabetes
*Type 1 and type 2 diabetes; **insulin treated.ARIC, Atherosclerosis Risk in Communities; CHD, coronary heart disease; CV, cardiovascular; CVD, cardiovascular disease; SH, severe hypoglycemia.1. Lee AK et al. Diabetes Care 2018;41:104–11; 2. Goto A et al. J Am Heart Assoc 2016;5:e002875; 3. Leong A et al. J Clin Endocrinol Metab 2016;101:659–68; 4. Cha SA et al. Diabetes Metab J 2016;40:202–10; 5. Luk AO et al. Medicine (Baltimore) 2016;95:e5183; 6. Freemantle N et al. Diabetes Obes Metab 2016;18:152–8; 7. Khunti K et al. Diabetes Care 2015;38:316 –22; 8. Bedenis R et al. Diabetes Care 2014;37:3301–8; 9. Rathmann W et al. Diabetes Obes Metab 2013;15:55–61; 10. Hsu PF et al. Diabetes Care 2013; 36:894–900; 11. Zhao Y et al. Diabetes Care 2012;35:1126–32; 12. Johnston SS et al. Diabetes Care 2011;34:1164–71.
Epidemiological cohorts Year Severity Follow up Effect Hazard ratioARIC1 (N-1209) 2018 SH median 15.3 y CHD
CV death All cause death
Japanese database2 (N=58223) 2016 SH mean 2.3 y CVDUS Academic Primary Care Network3*
(N=9173)2016 Not defined 6 y CHD without previous CAD
CHD in high vascular risk patientsCHD in those aged ≥65 years
Vincent Type 2 Diabetes Registry (Korea)4
(N=906)2016 SH median 10.4 y All cause death
CV deathJoint Asia Diabetes Registry5 (N=18589) 2016 Mild mean 3.9 y CVD
All cause deathCREDIT study6** (N=2999) 2016 SH 4·0 y CV death
All cause deathUK GP database7** (N=10422) 2015 SH median 4.8 y Type 2 CVD secondary
Type 2 CVDScottish8 (N=1066) 2014 SH mean 4.0 y CVDGerman Primary Care database9 (N=25712) 2013 SH mean 2.0 y CVDTaiwan database10 (N=2500) 2013 SH 10 y CVD
CHD Stroke
Mild CVDUS Veterans Network11 (N=1522) 2012 SH median 3.9 y CVDMedicare database12 (N=860845) 2011 SH mean 1 y CVD
0 2 4 6 8 10
AMI, acute myocardial infarction; BG, blood glucose; ICU, intensive care unit.Van den Berghe G et al. N Engl J Med 2001;345:1359–67; Finfer S et al. N Engl J Med 2009;360:1283–97; NICE-SUGAR Investigators. N Engl J Med 2012;367:1108–18; Kosiborod M et al. J Am Med Assoc 2009;301:1556–64; Svensson AM et al. Eur J Heart 2005;26:1255–61; Pinto DS et al. J Am Coll Cardiol 2005;46:178–80; Mellbin LG et al. Heart 2009l95:721–7.
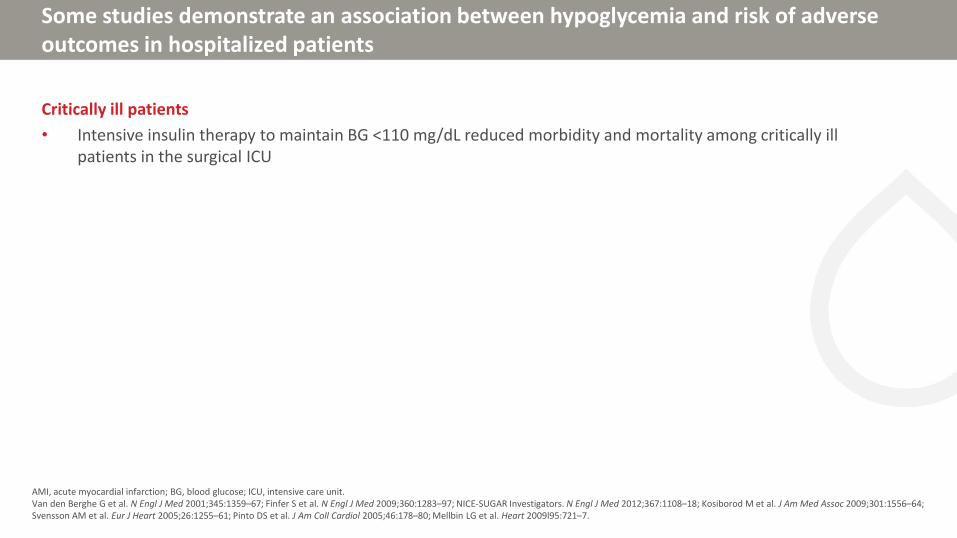
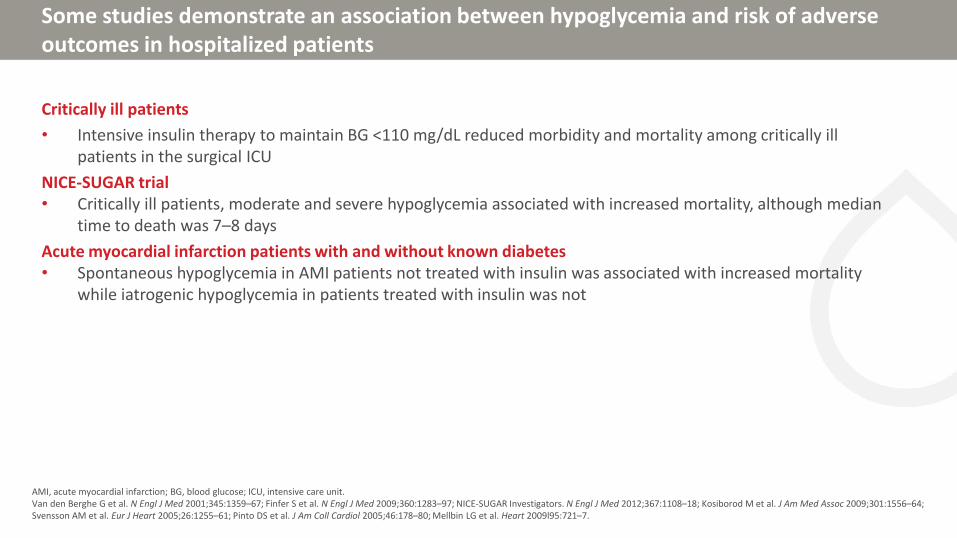
Some studies demonstrate an association between hypoglycemia and risk of adverse outcomes in hospitalized patients
Critically ill patients
• Intensive insulin therapy to maintain BG <110 mg/dL reduced morbidity and mortality among critically ill patients in the surgical ICU
AMI, acute myocardial infarction; BG, blood glucose; ICU, intensive care unit.Van den Berghe G et al. N Engl J Med 2001;345:1359–67; Finfer S et al. N Engl J Med 2009;360:1283–97; NICE-SUGAR Investigators. N Engl J Med 2012;367:1108–18; Kosiborod M et al. J Am Med Assoc 2009;301:1556–64; Svensson AM et al. Eur J Heart 2005;26:1255–61; Pinto DS et al. J Am Coll Cardiol 2005;46:178–80; Mellbin LG et al. Heart 2009l95:721–7.
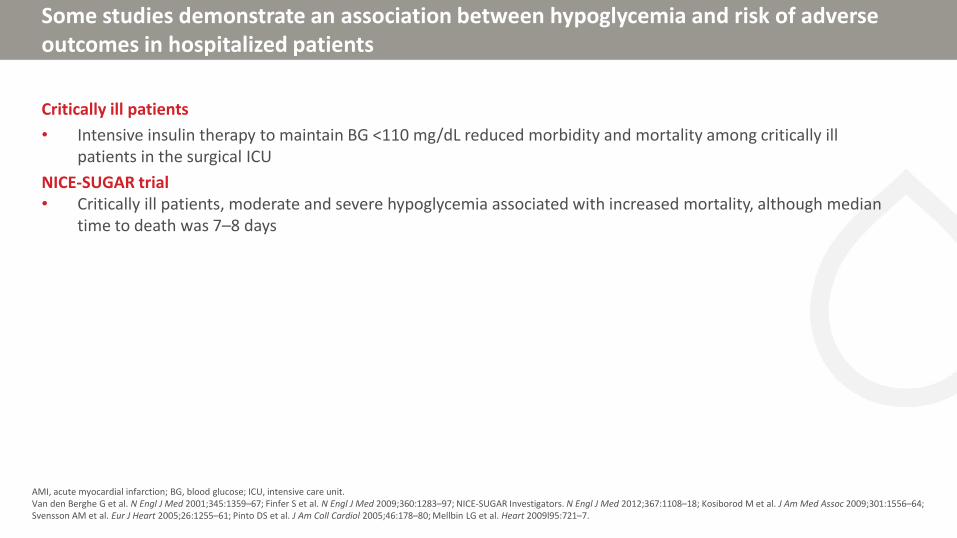
Some studies demonstrate an association between hypoglycemia and risk of adverse outcomes in hospitalized patients
Critically ill patients
• Intensive insulin therapy to maintain BG <110 mg/dL reduced morbidity and mortality among critically ill patients in the surgical ICU
NICE-SUGAR trial• Critically ill patients, moderate and severe hypoglycemia associated with increased mortality, although median
time to death was 7–8 days
AMI, acute myocardial infarction; BG, blood glucose; ICU, intensive care unit.Van den Berghe G et al. N Engl J Med 2001;345:1359–67; Finfer S et al. N Engl J Med 2009;360:1283–97; NICE-SUGAR Investigators. N Engl J Med 2012;367:1108–18; Kosiborod M et al. J Am Med Assoc 2009;301:1556–64; Svensson AM et al. Eur J Heart 2005;26:1255–61; Pinto DS et al. J Am Coll Cardiol 2005;46:178–80; Mellbin LG et al. Heart 2009l95:721–7.
Some studies demonstrate an association between hypoglycemia and risk of adverse outcomes in hospitalized patients
Critically ill patients
• Intensive insulin therapy to maintain BG <110 mg/dL reduced morbidity and mortality among critically ill patients in the surgical ICU
NICE-SUGAR trial• Critically ill patients, moderate and severe hypoglycemia associated with increased mortality, although median
time to death was 7–8 days
Acute myocardial infarction patients with and without known diabetes• Spontaneous hypoglycemia in AMI patients not treated with insulin was associated with increased mortality
while iatrogenic hypoglycemia in patients treated with insulin was not
AMI, acute myocardial infarction; BG, blood glucose; ICU, intensive care unit.Van den Berghe G et al. N Engl J Med 2001;345:1359–67; Finfer S et al. N Engl J Med 2009;360:1283–97; NICE-SUGAR Investigators. N Engl J Med 2012;367:1108–18; Kosiborod M et al. J Am Med Assoc 2009;301:1556–64; Svensson AM et al. Eur J Heart 2005;26:1255–61; Pinto DS et al. J Am Coll Cardiol 2005;46:178–80; Mellbin LG et al. Heart 2009l95:721–7.
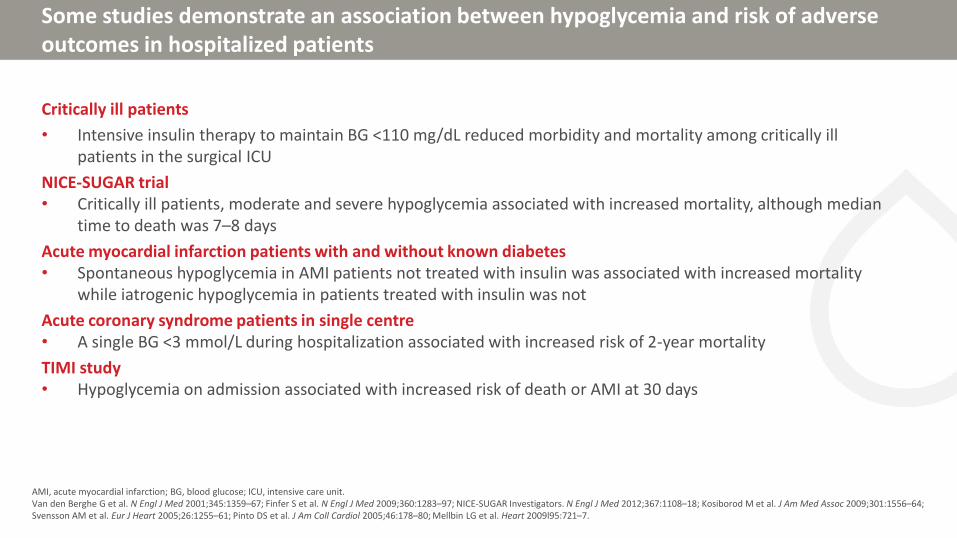
Some studies demonstrate an association between hypoglycemia and risk of adverse outcomes in hospitalized patients
Critically ill patients
• Intensive insulin therapy to maintain BG <110 mg/dL reduced morbidity and mortality among critically ill patients in the surgical ICU
NICE-SUGAR trial• Critically ill patients, moderate and severe hypoglycemia associated with increased mortality, although median
time to death was 7–8 days
Acute myocardial infarction patients with and without known diabetes• Spontaneous hypoglycemia in AMI patients not treated with insulin was associated with increased mortality
while iatrogenic hypoglycemia in patients treated with insulin was not
Acute coronary syndrome patients in single centre• A single BG <3 mmol/L during hospitalization associated with increased risk of 2-year mortality
TIMI study• Hypoglycemia on admission associated with increased risk of death or AMI at 30 days
AMI, acute myocardial infarction; BG, blood glucose; ICU, intensive care unit.Van den Berghe G et al. N Engl J Med 2001;345:1359–67; Finfer S et al. N Engl J Med 2009;360:1283–97; NICE-SUGAR Investigators. N Engl J Med 2012;367:1108–18; Kosiborod M et al. J Am Med Assoc 2009;301:1556–64; Svensson AM et al. Eur J Heart 2005;26:1255–61; Pinto DS et al. J Am Coll Cardiol 2005;46:178–80; Mellbin LG et al. Heart 2009l95:721–7.
Some studies demonstrate an association between hypoglycemia and risk of adverse outcomes in hospitalized patients
Critically ill patients
• Intensive insulin therapy to maintain BG <110 mg/dL reduced morbidity and mortality among critically ill patients in the surgical ICU
NICE-SUGAR trial• Critically ill patients, moderate and severe hypoglycemia associated with increased mortality, although median
time to death was 7–8 days
Acute myocardial infarction patients with and without known diabetes• Spontaneous hypoglycemia in AMI patients not treated with insulin was associated with increased mortality
while iatrogenic hypoglycemia in patients treated with insulin was not
Acute coronary syndrome patients in single centre• A single BG <3 mmol/L during hospitalization associated with increased risk of 2-year mortality
TIMI study• Hypoglycemia on admission associated with increased risk of death or AMI at 30 days
DIGAMI 2 study (type 2 diabetes and AMI)• Hypoglycemia during hospitalization not associated with future morbidity or mortality
• Most data from observational studies show an association between hypoglycemia (but not necessarily severe hypoglycemia) and CV events in type 1 and type 2 diabetes
• The relationship persists over a long period: median time from first hypoglycemia to first CV event was 1.5 years in people with T1D or T2D
• Some conflicting results: clinic/hospital-based cases have different exposures than population cases
• Avoidance of severe hypoglycemia is an important consideration in selecting a glucose-lowering strategy
Agenda
CV, cardiovascular; CVD, cardiovascular disease.
Topic
Epidemiology of hypoglycemia and CVD
Risk of hypoglycemia in large cardiovascular outcomes trials
Hypoglycemia: mediator or marker of CVD risk
Mechanisms of hypoglycemia-induced increased CV risk
Clinical trials linking hypoglycemia to CV events and mortality in patients with type 2 diabetes
CV, cardiovascular; CVD, cardiovascular disease; int, intensive therapy; SH, severe hypoglycemia; st, standard therapy.1. Pieber TR et al. Diabetologia 2018;61:58–65; 2. Heller SR et al. Diabetes Obes Metab 2017;19:664–71; 3. Mellbin LG et al. Eur heart J 2013;34:3137–44; 4. Duckworth W et al. N Engl J Med 2009;360:129–39;5. Zoungas S et al. N Engl J Med 2010;363:1410–8; 6. Bonds DE et al. BMJ 2010;340:b4909.
Clinical trial cohorts Year Severity Follow up Effect size (adjusted) Hazard ratioDEVOTE 31 (N=7637) 2018 SH median 2.0 y CVD
All cause deathORIGIN3 (N=12,537) 2013 SH median 6.2 y CVD
CV deathAll cause deathArrhythmic death
Non-severe hypoglycemia
No association
VADT4 (N=1791) 2011 SH median 5.6 y CVD
ADVANCE5 (N=11,140) 2010 SH median 5.0 y CVDCV deathAll cause death
ACCORD6 (N=10,194) 2010 SH mean 3.5 y All cause death intAll cause death st
0 2 4 6 8 10
VADT: predictors for CV mortality
N=1791 subjects enrolled in VADT.CVD, cardiovascular disease; HbA1c, glycated hemoglobin; HDL, high density lipoprotein; VADT, Veterans’ Affairs Diabetes Trial.1. Davis SN et al. Diabetes Care 2019;42:157–63; 2. Adapted from Duckworth WC, Abraira C. Veterans Affairs Diabetes Trial. 44th EASD Annual Meeting; Rome. September 2008; Oral presentation at plenary session.
0.01
0.0001
<0.0001
0.015
0.0079
Relative risk
Severe hypoglycemia inprevious three months1
Higher HDL2
Higher baseline HbA1c
2
Older age2
Previous CVD2
3.7 (1.3–10.4)
3.1 (1.7–5.6)
2.1 (1.5–2.9)
1.2 (1.0–1.4)
0.7 (0.5–0.9)
Relative risk p-value
0 1 2 3 4 5 6
Outcome Adjusted HR with propensity score
p-value Event rate, n/N (%)†
Severe hypoglycemia
CV death or non-fatal MI or stroke
1.58 (1.24–2.02) <0.001 75/450 (16.7)
Total mortality 1.74 (1.39–2.19) <0.001 88/472 (18.6)
Total CV death 1.71 (1.27–2.30) <0.001 52/472 (11.0)
Arrhythmic death 1.77 (1.17–2.67) 0.007 28/470 (6.0)
ORIGIN: severe hypoglycemia increases risk for MACE
N=12 537 patients with dysglycemia and high CV risk.*Primary endpoint: composite of CV death, non-fatal MI or stroke. †Participants with at least one episode of severe hypoglycemia and the listed outcome/total participants with at least one episode of severe hypoglycemia, expressed as n/N (%). N = 12,537 patients with diabetes and high CV risk. CI, confidence interval; CV, cardiovascular; MACE, major adverse cardiovascular event; MI, myocardial infarction.Origin Trial Investigators. Eur Heart J. 2013;34:3137–3144.
1.0 2.0 3.0
HR (95% CI)
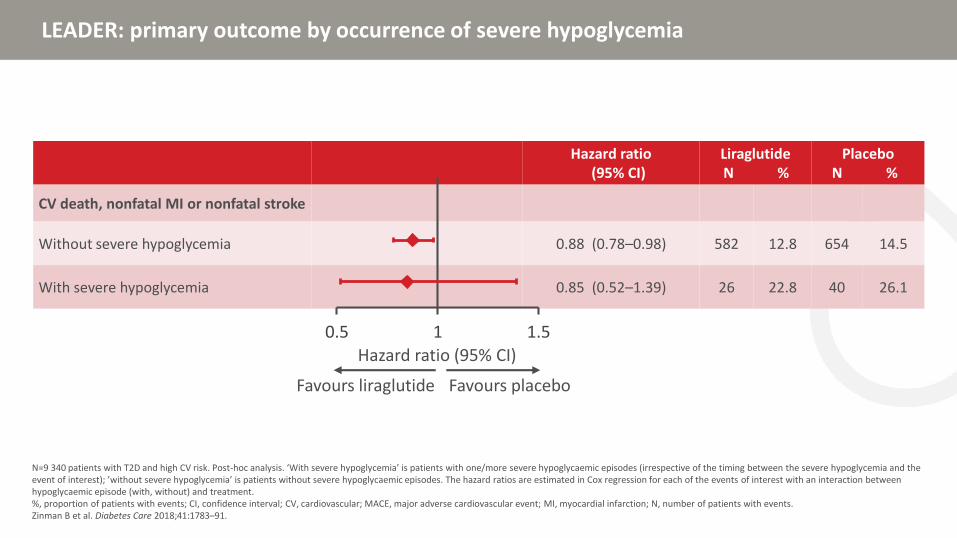
LEADER: primary outcome by occurrence of severe hypoglycemia
N=9 340 patients with T2D and high CV risk. Post-hoc analysis. ‘With severe hypoglycemia’ is patients with one/more severe hypoglycaemic episodes (irrespective of the timing between the severe hypoglycemia and the event of interest); ’without severe hypoglycemia’ is patients without severe hypoglycaemic episodes. The hazard ratios are estimated in Cox regression for each of the events of interest with an interaction between hypoglycaemic episode (with, without) and treatment.%, proportion of patients with events; CI, confidence interval; CV, cardiovascular; MACE, major adverse cardiovascular event; MI, myocardial infarction; N, number of patients with events.Zinman B et al. Diabetes Care 2018;41:1783–91.
Hazard ratio(95% CI)
LiraglutideN %
PlaceboN %
CV death, nonfatal MI or nonfatal stroke
Without severe hypoglycemia 0.88 (0.78–0.98) 582 12.8 654 14.5
With severe hypoglycemia 0.85 (0.52–1.39) 26 22.8 40 26.1
0.5 1 1.5
Favours placeboFavours liraglutide
Hazard ratio (95% CI)
LEADER: risk of all-cause mortality and cardiovascular outcomes is increased especially with shorter follow-up periods post-hypoglycemia
N=9 340 patients with T2D and high CV risk.*Adjusted for concomitant insulin use during the trial.CI, confidence interval; MACE, major adverse cardiovascular event.Zinman B et al. Diabetes Care 2018;41:1783–91.
Risk of all-cause mortality in patients with vs. without severe hypoglycemia
Risk of MACE in patients with vs. without severe hypoglycemia*
Any time
≤365 days after
≤180 days
≤90 days
≤60 days
≤30 days
≤15 days
≤7 days
Hazard ratio (95% CI) Hazard ratio (95% CI)0.1 1 10 100 0.1 1 10 100
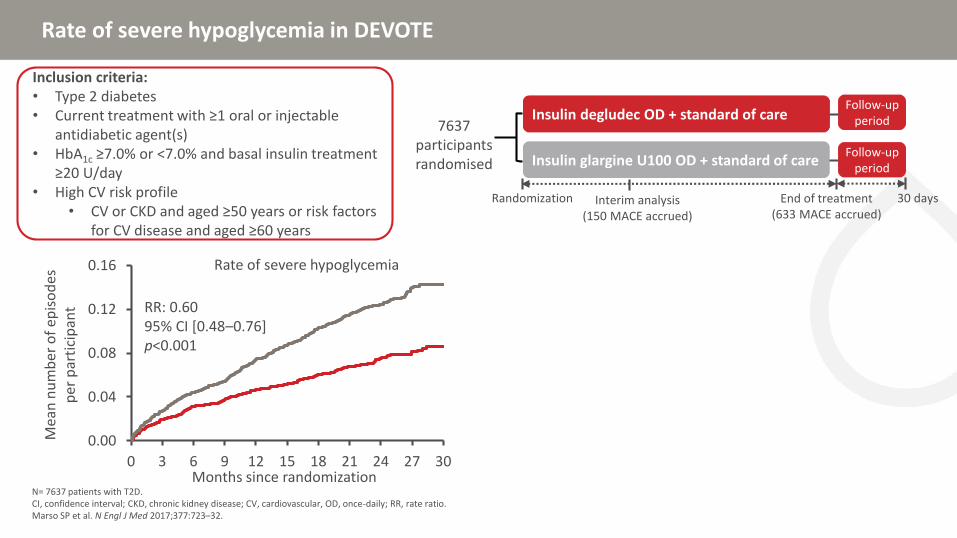
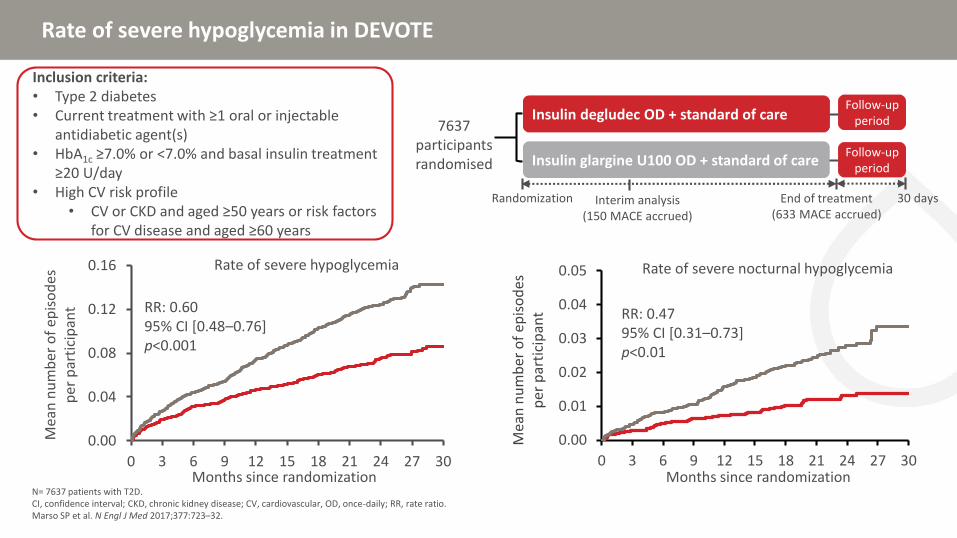
Rate of severe hypoglycemia in DEVOTE
N= 7637 patients with T2D. CI, confidence interval; CKD, chronic kidney disease; CV, cardiovascular, OD, once-daily; RR, rate ratio.Marso SP et al. N Engl J Med 2017;377:723–32.
Insulin degludec OD + standard of care
Insulin glargine U100 OD + standard of care
Randomization
7637 participants randomised
End of treatment(633 MACE accrued)
Follow-up period
30 days
Follow-up period
Interim analysis(150 MACE accrued)
Inclusion criteria:• Type 2 diabetes• Current treatment with ≥1 oral or injectable
antidiabetic agent(s)• HbA1c ≥7.0% or <7.0% and basal insulin treatment
≥20 U/day• High CV risk profile
• CV or CKD and aged ≥50 years or risk factors for CV disease and aged ≥60 years
0.00
0.04
0.08
0.12
0.16
0 3 6 9 12 15 18 21 24 27 30
Mea
n n
um
ber
of
epis
od
es
per
par
tici
pan
t RR: 0.60 95% CI [0.48–0.76]p<0.001
Months since randomization
Rate of severe hypoglycemia
0.00
0.01
0.02
0.03
0.04
0.05
0 3 6 9 12 15 18 21 24 27 30
Mea
n n
um
ber
of
epis
od
es
per
par
tici
pan
t RR: 0.4795% CI [0.31–0.73]p<0.01
Months since randomization
Rate of severe nocturnal hypoglycemia
DEVOTE 3: severe hypoglycaemia is associated with all-cause mortality with no relationship to time following hypoglycaemic event
n=439 patients who experienced a severe hypoglycaemia. CI, confidence interval; MACE, major adverse cardiovascular event.Pieber TR et al. Diabetologia 2018;61:58–65.
Window (days)Hazard ratio
(95% CI)
Any time 2.51 (1.79–3.50)
365 days 2.78 (1.92–4.04)
180 days 3.13 (1.99–4.90)
90 days 3.28 (1.85–5.83)
60 days 2.74 (1.30–5.79)
30 days 3.66 (1.51–8.84)
15 days 4.20 (1.35–13.09)
Hazard ratio (95% CI)
Higher risk of all-cause mortality any time following severe hypoglycaemia
0.25 0.5 1 2 4 8 16
Risk of all-cause mortality following a severe hypoglycaemic event by time period
Window (days)Hazard ratio
(95% CI)
Any time 1.38 (0.96–1.96)
365 days 1.15 (0.74–1.79)
180 days 1.24 (0.72–2.15)
90 days 1.12 (0.53–2.37)
60 days 1.16 (0.48–2.80)
30 days 1.28 (0.41–3.99)
15 days 0.82 (0.11–5.80)
0.06250.125 0.25 0.5 1 2 4 8Hazard ratio (95% CI)
Higher risk of MACE any time following severe hypoglycaemia
Risk of MACE following a severe hypoglycaemic event by time period
0
4
8
12
16
0 1 2 3 4 5 6 7
Part
icip
ants
(%
)
Follow-up (years)
CAROLINA: Time to first occurrence of 3P-MACE(CV death, non-fatal MI, non-fatal stroke)
Treated set; Kaplan-Meier estimate; hazard ratio and 95% CI derived from Cox regression with factor treatment; 1-sided P value for non-inferiority and 2-sided p-value for superiority.3P-MACE, 3-point major adverse CV events; CI, confidence interval; CV, cardiovascular; HR, hazard ratio; MI, myocardial infarction; PY, patient-years.Presented at the ADA 79th Scientific Session, 2019, San Francisco, CA, USA.
Glimepiride (n=362)Rate: 2.1/100 PY
Linagliptin (n=356)Rate: 2.1/100 PY
HR 0.98(95.47% CI 0.84, 1.14)p<0.0001 for non-inferiorityp=0.76 for superiority
CAROLINA: Hypoglycemia
Treated set without duplicate participants (events occurring between first study drug intake until 7 days after last permanent study drug stop. *Hypoglycemic event requiring the assistance of another person to actively administer carbohydrate, glucagon or other resuscitative actions.CI, confidence interval; HR, hazard ratio; PY, patient-years.Presented at the ADA 79th Scientific Session, 2019, San Francisco, CA, USA.
• Most CVOTs demonstrate an association between severe hypoglycemia and CV events
• Non-severe hypoglycemia which are frequently undocumented may also have measured effects
• Evidence can be conflicting, with additional confounders and causality contributing to findings
Agenda
CV, cardiovascular; CVD, cardiovascular disease.
Topic
Epidemiology of hypoglycemia and CVD
Risk of hypoglycemia in large cardiovascular outcomes trials
Hypoglycemia: mediator or marker of CVD risk
Mechanisms of hypoglycemia-induced increased CV risk
Is severe hypoglycemia a cause or a marker of increased risk for adverse outcomes?
Zoungas S et al. N Engl J Med 2010;363:1410–8.
Severe hypoglycemia Adverse outcomes
Is severe hypoglycemia a cause or a marker of increased risk for adverse outcomes?
Zoungas S et al. N Engl J Med 2010;363:1410–8.
Severe hypoglycemia Adverse outcomes
Vulnerable patients?(long duration of diabetes/high
age/years of insulin treatment/nephropathy/etc.)
15.9
11.5
19.5
9.5 10.010.2 10.19.0
4.8 4.3
0
5
10
15
20
25
Majormacrovascular
event
Majormicrovascular
event
Death from anycause
CV disease Non-CV disease
Severe hypo No severe hypo
HR (95% CI):3.53 (2.41–5.17)a
HR (95% CI):2.19 (1.40–3.45)a
HR (95% CI):3.27 (2.29–4.65)a
HR (95% CI):3.79 (2.36–6.08)a
HR (95% CI):2.80 (1.64–4.79)a
b
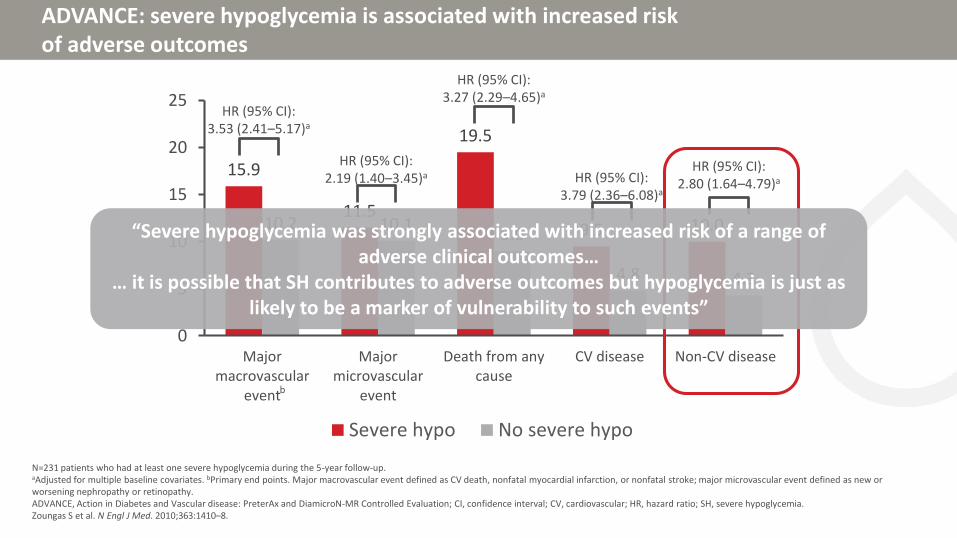
ADVANCE: severe hypoglycemia is associated with increased risk of adverse outcomes
N=231 patients who had at least one severe hypoglycemia during the 5-year follow-up.aAdjusted for multiple baseline covariates. bPrimary end points. Major macrovascular event defined as CV death, nonfatal myocardial infarction, or nonfatal stroke; major microvascular event defined as new or worsening nephropathy or retinopathy.ADVANCE, Action in Diabetes and Vascular disease: PreterAx and DiamicroN-MR Controlled Evaluation; CI, confidence interval; CV, cardiovascular; HR, hazard ratio; SH, severe hypoglycemia.Zoungas S et al. N Engl J Med. 2010;363:1410–8.
15.9
11.5
19.5
9.5 10.010.2 10.19.0
4.8 4.3
0
5
10
15
20
25
Majormacrovascular
event
Majormicrovascular
event
Death from anycause
CV disease Non-CV disease
Severe hypo No severe hypo
HR (95% CI):3.53 (2.41–5.17)a
HR (95% CI):2.19 (1.40–3.45)a
HR (95% CI):3.27 (2.29–4.65)a
HR (95% CI):3.79 (2.36–6.08)a
HR (95% CI):2.80 (1.64–4.79)a
b
ADVANCE: severe hypoglycemia is associated with increased risk of adverse outcomes
N=231 patients who had at least one severe hypoglycemia during the 5-year follow-up.aAdjusted for multiple baseline covariates. bPrimary end points. Major macrovascular event defined as CV death, nonfatal myocardial infarction, or nonfatal stroke; major microvascular event defined as new or worsening nephropathy or retinopathy.ADVANCE, Action in Diabetes and Vascular disease: PreterAx and DiamicroN-MR Controlled Evaluation; CI, confidence interval; CV, cardiovascular; HR, hazard ratio; SH, severe hypoglycemia.Zoungas S et al. N Engl J Med. 2010;363:1410–8.
“Severe hypoglycemia was strongly associated with increased risk of a range of adverse clinical outcomes…
… it is possible that SH contributes to adverse outcomes but hypoglycemia is just as likely to be a marker of vulnerability to such events”
Antidiabetic agents with less hypoglycemic risk reduce the risk of MACE
The size of the circle represents the weight of each trial and is inversely proportional to the standard error of the effect estimate. Beta coefficient depicts a change in absolute or relative effect of antihyperglycemic treatment for each 1% difference in achieved HbA1c between intervention and control groups.HbA1c, glycated haemoglobin.Huang CJ et al. Diabetes Obes Metab 2018;20:2131–9.
0.2 0.3 0.4 0.5 0.6 0.7 0.8 0.90.9
0.0
0.5
1.0
1.5
2.0
2.5
3.0
Reduction in achieved HbA1c (%)
Ab
solu
te r
isk
red
uct
ion
(%)
Reduction in achieved HbA1c (%)
0.6 0.7 0.8 0.9 1.0 1.1 1.2 1.3 1.4 1.5−1.0
0.0
1.0
2.0
3.0
4.0
Ab
solu
te r
isk
red
uct
ion
(%
)
β=4.4277, p=0.0005
β=0.3778, p=0.8868
Conventional antidiabetic agentsAntidiabetic agents with minimal hypoglycemia risk
MACE, major adverse cardiovascular evemts.1. Huang CJ et al. Diabetes Obes Metab 2018;20:2131–9.
Summary
• Severe hypoglycemia:
• Is associated with increased risk of vascular events
• Identifies a patient vulnerable to adverse vascular events
• May cause adverse vascular events
• Less severe hypoglycemia events that are unrecorded may also be contributing to risk
• Recent evidence suggests that antihyperglycemic agents that improve HbA1c with less hypoglycemia risk may confer risk reduction in MACE1
Agenda
CV, cardiovascular; CVD, cardiovascular disease.
Topic
Epidemiology of hypoglycemia and CVD
Risk of hypoglycemia in large cardiovascular outcomes trials
Hypoglycemia: mediator or marker of CVD risk
Mechanisms of hypoglycemia-induced increased CV risk
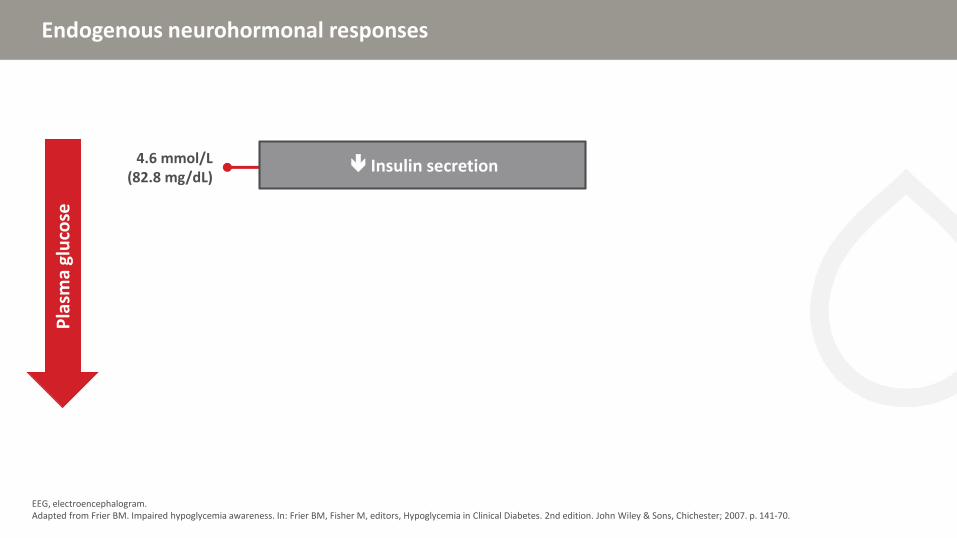
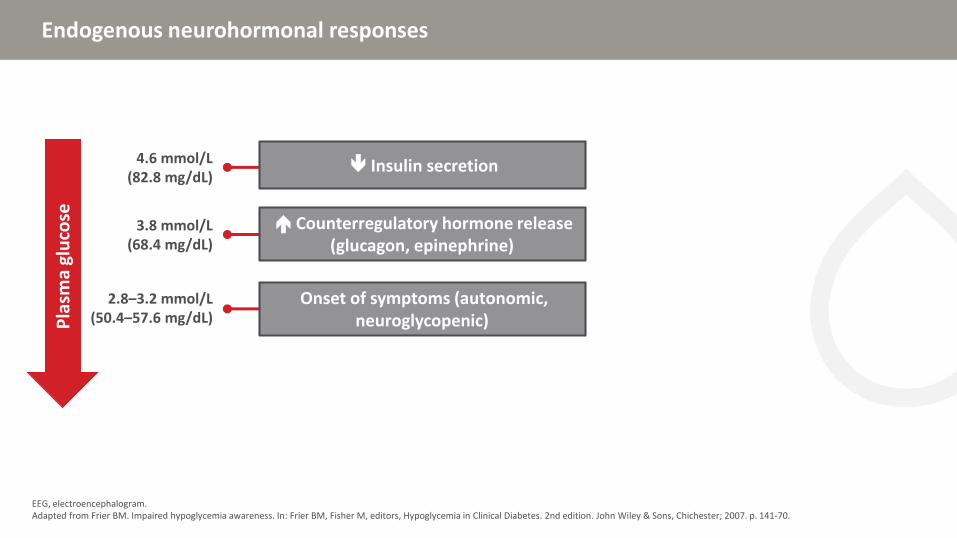
Endogenous neurohormonal responses
EEG, electroencephalogram.Adapted from Frier BM. Impaired hypoglycemia awareness. In: Frier BM, Fisher M, editors, Hypoglycemia in Clinical Diabetes. 2nd edition. John Wiley & Sons, Chichester; 2007. p. 141-70.
Pla
sma
glu
cose
Endogenous neurohormonal responses
EEG, electroencephalogram.Adapted from Frier BM. Impaired hypoglycemia awareness. In: Frier BM, Fisher M, editors, Hypoglycemia in Clinical Diabetes. 2nd edition. John Wiley & Sons, Chichester; 2007. p. 141-70.
Pla
sma
glu
cose
4.6 mmol/L(82.8 mg/dL)
Insulin secretion
Endogenous neurohormonal responses
EEG, electroencephalogram.Adapted from Frier BM. Impaired hypoglycemia awareness. In: Frier BM, Fisher M, editors, Hypoglycemia in Clinical Diabetes. 2nd edition. John Wiley & Sons, Chichester; 2007. p. 141-70.
Severe hypoglycemia and coronary artery calcification in DCCT/EDIC
N=1 205 participants form DCCT/EDIC on whom computed tomography was performed 7–9 years after the end of DCCT was performed.CAC, coronary artery calcification; DCCT/EIDC, diabetes control and complications trial/epidemiology of diabetes interventions and complications; Entire cohort, entire DCCT-cohort Fährmann ER et al. Diabetes Res Clin Pract 2015;107(2):280–9.
0.14
0.08
0.06
0.04
0.02
0.00
-0.02
Part
ial S
pea
rman
co
rrel
atio
n c
oef
fici
ent
Entire cohortp=0.12
HbA1c DCCT/EDIC <7.5%p=0.015
HbA1c DCCT/EDIC ≥7.5%p=0.66
Correlation Between DCCT-severe hypoglycemia and CAC ≥100 Agatston units for the entire cohort and subgroups
0.12
0.10
VADT: serious hypoglycemia and progression of coronary artery calcification
N=197 patients (97 with severe hypoglycemia) from the Risk Factors, Atherosclerosis, and Clinical Events in Diabetes substudy of VADT.CAC, coronary artery calcium; CT, computed tomography; SH, serious hypoglycemia; VADT, Veterans’ Affairs Diabetes Trial.Saremi A et al. Diabetes Care 2016:39;448–54.
• CT scans measured CAC at baseline and after ~4.5 years
• SH was more common in intensive treatment group (74%) than in standard treatment group (21%)
• In the standard group, CAC progressed (~50%) with SH in a dose-response relationship
• SH was not associated with CAC progression in the intensive group (perhaps because of a suppressed sympathoadrenal response)
16
14
12
10
8
6
4
2
0All Standard Intensive
CA
C p
rogr
essi
on
(m
m3)
No serious hypoglycemia
Serious hypoglycemia
p=0.02
Multiple plausible mechanisms can explain how severe hypoglycemia may cause cardiovascular morbidity or mortality
CRP, C-reactive protein; CV, cardiovascular; IL-6, interleukin-6; VEGF, vascular endothelial growth factor.Adapted from Desouza CV et al. Diabetes Care 2010;33:1389–94; 2. Frier BM et al. Diabetes Care 2011;34 (Suppl. 2):S132–7; Wright RJ et al. Diabetes Care 2010;33:1591–7; Chow EYK et al. Diabetologia 2013;56 (Suppl. 1):S243.
VEGF IL-6 CRP
Neutrophilactivation
Plateletactivation
Factor VIII
Blood coagulationabnormalities
Epinephrine
Inflammation
Endothelialdysfunction
Vasodilatation
Heart rate variability
Rhythm abnormalities Hemodynamic changes
Heart workload Contractility Oxygen consumption
HYPOGLYCEMIA
Sympathoadrenalresponse
Persists for up to 24 hours3
Effects last up to 7 days4
MACE, major adverse cardiovascular events; RCT, randomized controlled trial.
Overall conclusions
• Most data from both observational studies as well as RCTs show an association between severe hypoglycemia and both MACE and mortality
MACE, major adverse cardiovascular events; RCT, randomized controlled trial.
Overall conclusions
• Most data from both observational studies as well as RCTs show an association between severe hypoglycemia and both MACE and mortality
• Severe hypoglycemia may be both a mediator of adverse outcomes as well as a marker of vulnerability to such events
• Avoidance of severe hypoglycemia must therefore be an important therapeutic goal
Recuerde, si Usted tiene preguntas para nuestros conferencistas….
Las preguntas se responderán durante el panel de discusión
Levante la mano para que recojan su ficha de preguntas
Manejando Riesgo de Hipoglucemia con Nueva Tecnología
Elizabeth Seaquist, MD, CDEProfesora de Medicina y Directora,
División de Endocrinología y Diabetes,Escuela de Medicina de la Universidad de Minnesota
Minneapolis, EUA
Disclosures
• Eli Lilly (Advisory Board, Consultant, Research support through grants to UMN)
• Sanofi (Consultant)
• Zucara (Consultant)
• Novo Nordisk (Sponsor of the International Hypoglycemia Study Group of which I am a member)
• MannKind (Consultant)
• American Diabetes Association (Advisor)
• American Board of Internal Medicine Exam Committee (Exam Committee Member)
Outline
Evidence based methods to reduce hypoglycaemia in patients with diabetes
New technology and impact on hypoglycaemia
Use of new technology to prevent/reverse impaired awareness of hypoglycaemia
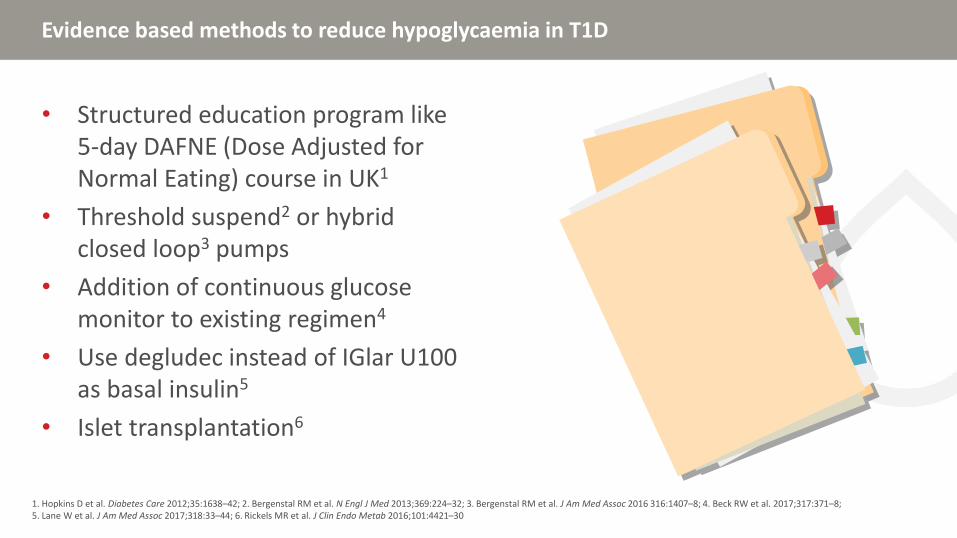
Evidence based methods to reduce hypoglycaemia in T1D
• Structured education program like 5-day DAFNE (Dose Adjusted for Normal Eating) course in UK1
• Threshold suspend2 or hybrid closed loop3 pumps
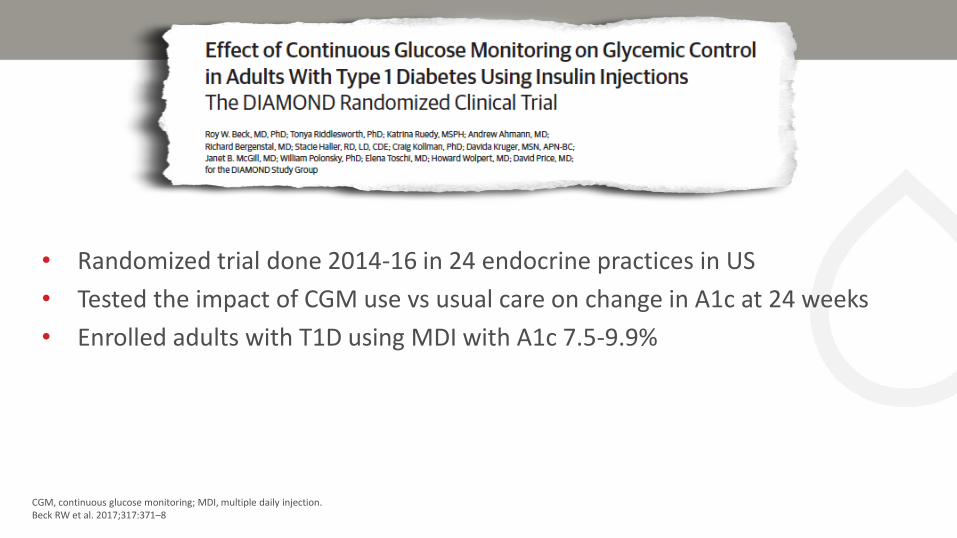
• Addition of continuous glucose monitor to existing regimen4
• Use degludec instead of IGlar U100 as basal insulin5
• Islet transplantation6
1. Hopkins D et al. Diabetes Care 2012;35:1638–42; 2. Bergenstal RM et al. N Engl J Med 2013;369:224–32; 3. Bergenstal RM et al. J Am Med Assoc 2016 316:1407–8; 4. Beck RW et al. 2017;317:371–8; 5. Lane W et al. J Am Med Assoc 2017;318:33–44; 6. Rickels MR et al. J Clin Endo Metab 2016;101:4421–30
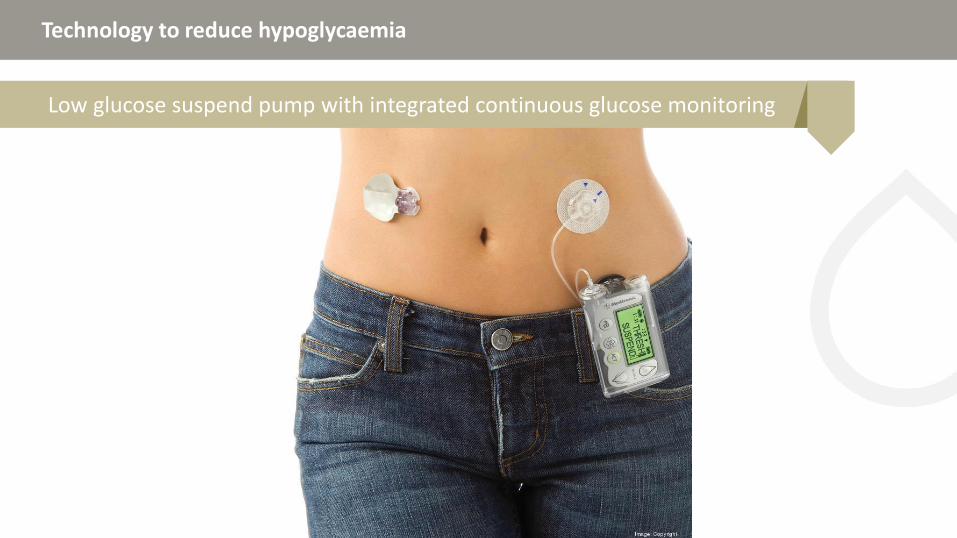
Technology to reduce hypoglycaemia
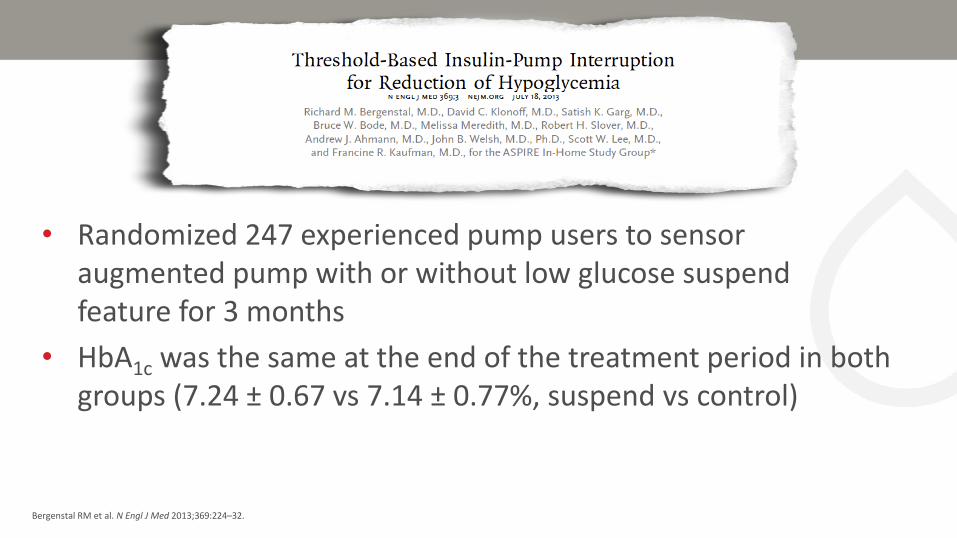
Low glucose suspend pump with integrated continuous glucose monitoring
• Randomized 247 experienced pump users to sensor augmented pump with or without low glucose suspend feature for 3 months
• HbA1c was the same at the end of the treatment period in both groups (7.24 ± 0.67 vs 7.14 ± 0.77%, suspend vs control)
Bergenstal RM et al. N Engl J Med 2013;369:224–32.
AUC, area under the curve.Bergenstal RM et al. N Engl J Med 2013;369:224–32.
1547 ±2035 1406 ±
1950980 ±1200
1568 ±1995
0
500
1000
1500
2000
AU
C (
mg
/dL
x m
in)
Threshold-suspend Control
38% reductionp<0.001
Mean AUC for nocturnal hypoglycaemia events
Run-in phase Study phase
1.22.8
0.9 1.91.8
3.1
1.6
2.5
3
4.1
2.8
3.7
0
2
4
6
8
10
12
Threshold-suspend
Control Threshold-suspend
Control
Perc
ent
Nocturnal Combined day and night
Sensor glucose <70 mg/dL
<50 mg/dL 50–<60 mg/dL 60–<70 mg/dL
Technology to reduce hypoglycaemia
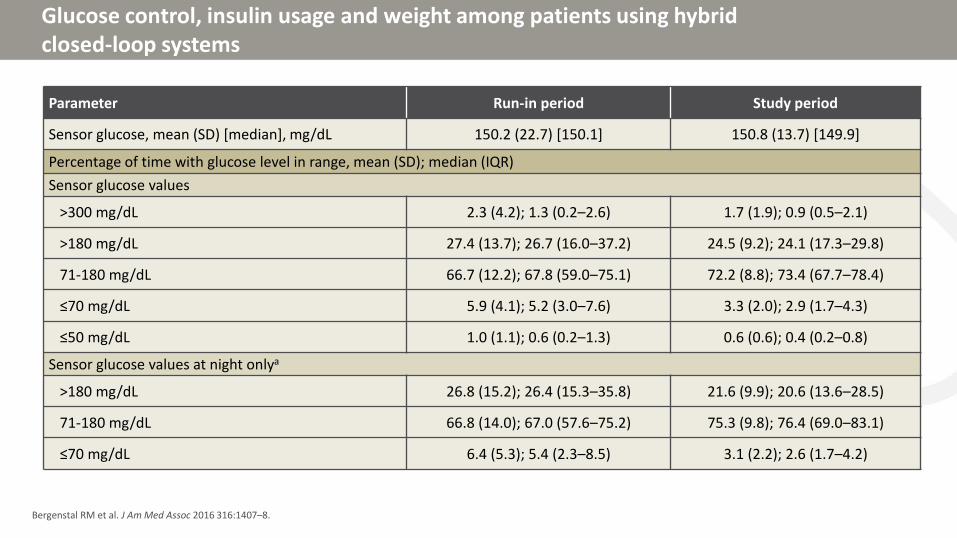
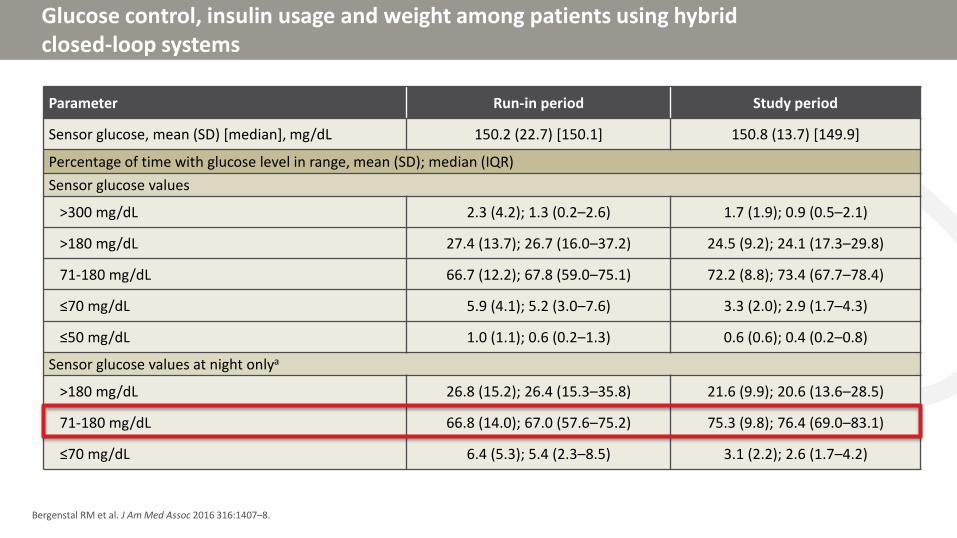
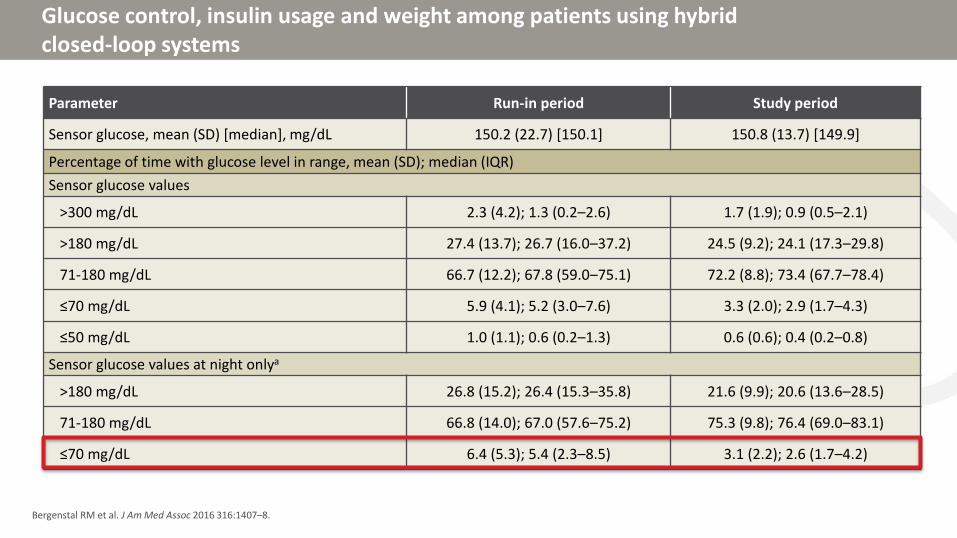
Hybrid closed loop system
Automates rate of basal infusion
Requires manual food and correction boluses
• 124 T1D adults with history of pump use
• Study consisted of 2 week run in period and 3 month treatment period where the first 6 days were used to collect data for the algorithm
• System adjusted algorithm every midnight based on data collected
• System was in closed loop mode for 87.2% of study period
• HbA1c changed from 7.4% to 6.9%
Bergenstal RM et al. J Am Med Assoc 2016 316:1407–8.
Glucose control, insulin usage and weight among patients using hybrid closed-loop systems
Bergenstal RM et al. J Am Med Assoc 2016 316:1407–8.
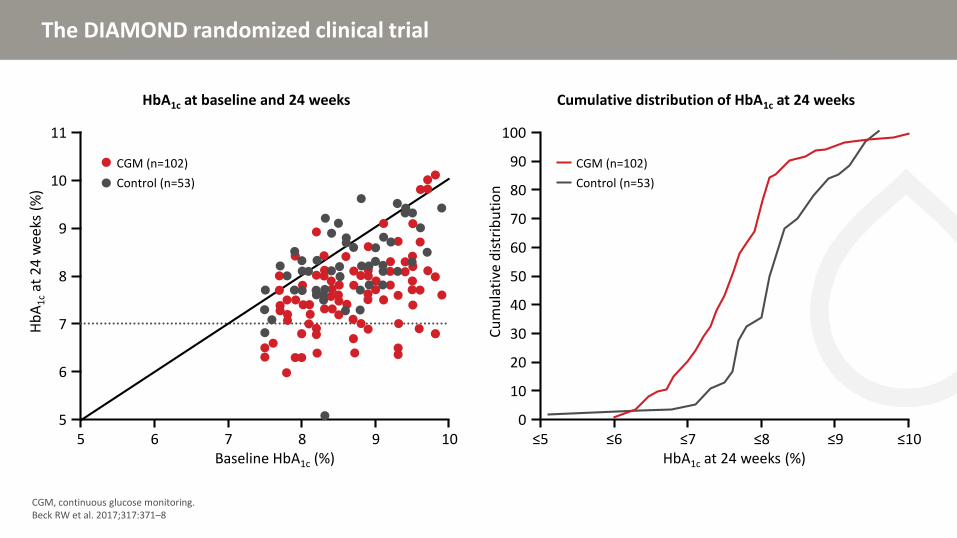
CGM, continuous glucose monitoring.Beck RW et al. 2017;317:371–8
11
10
9
8
7
6
5
HbA1c at baseline and 24 weeks
Hb
A1
cat
24
wee
ks (
%)
Baseline HbA1c (%)5 6 7 8 9 10
CGM (n=102)
Control (n=53)
100
80
60
50
30
20
0
Cumulative distribution of HbA1c at 24 weeks
Cu
mu
lati
ve d
istr
ibu
tio
n
HbA1c at 24 weeks (%)≤5 ≤6 ≤7 ≤8 ≤9 ≤10
CGM (n=102)
Control (n=53)
10
40
70
90
Baseline 12 and 24 weeks pooleda
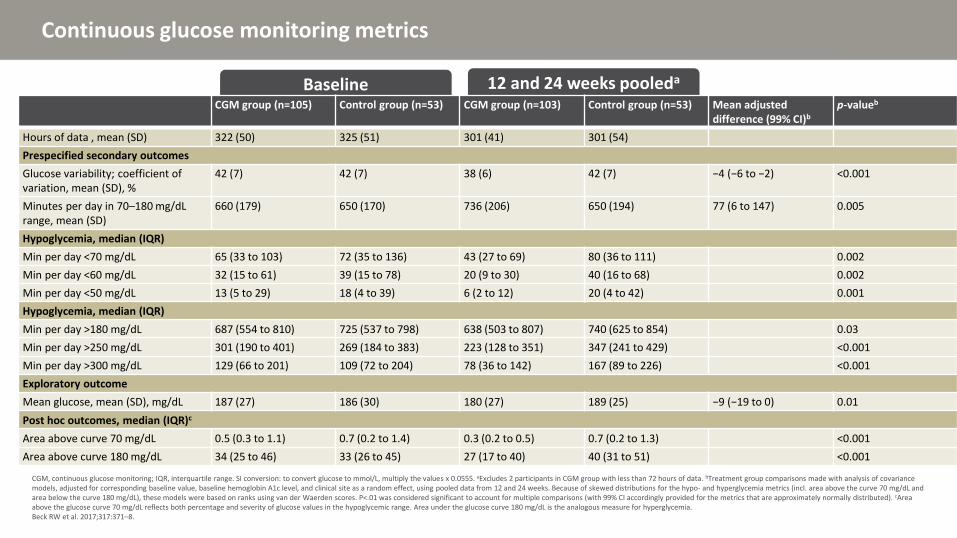
Continuous glucose monitoring metrics
CGM, continuous glucose monitoring; IQR, interquartile range. SI conversion: to convert glucose to mmol/L, multiply the values x 0.0555. aExcludes 2 participants in CGM group with less than 72 hours of data. bTreatment group comparisons made with analysis of covariance models, adjusted for corresponding baseline value, baseline hemoglobin A1c level, and clinical site as a random effect, using pooled data from 12 and 24 weeks. Because of skewed distributions for the hypo- and hyperglycemia metrics (incl. area above the curve 70 mg/dL and area below the curve 180 mg/dL), these models were based on ranks using van der Waerden scores. P<.01 was considered significant to account for multiple comparisons (with 99% CI accordingly provided for the metrics that are approximately normally distributed). cAreaabove the glucose curve 70 mg/dL reflects both percentage and severity of glucose values in the hypoglycemic range. Area under the glucose curve 180 mg/dL is the analogous measure for hyperglycemia.Beck RW et al. 2017;317:371–8.
CGM group (n=105) Control group (n=53) CGM group (n=103) Control group (n=53) Mean adjusted difference (99% CI)b
p-valueb
Hours of data , mean (SD) 322 (50) 325 (51) 301 (41) 301 (54)
Prespecified secondary outcomes
Glucose variability; coefficient of variation, mean (SD), %
Min per day <70 mg/dL 65 (33 to 103) 72 (35 to 136) 43 (27 to 69) 80 (36 to 111) 0.002
Min per day <60 mg/dL 32 (15 to 61) 39 (15 to 78) 20 (9 to 30) 40 (16 to 68) 0.002
Min per day <50 mg/dL 13 (5 to 29) 18 (4 to 39) 6 (2 to 12) 20 (4 to 42) 0.001
Hypoglycemia, median (IQR)
Min per day >180 mg/dL 687 (554 to 810) 725 (537 to 798) 638 (503 to 807) 740 (625 to 854) 0.03
Min per day >250 mg/dL 301 (190 to 401) 269 (184 to 383) 223 (128 to 351) 347 (241 to 429) <0.001
Min per day >300 mg/dL 129 (66 to 201) 109 (72 to 204) 78 (36 to 142) 167 (89 to 226) <0.001
Exploratory outcome
Mean glucose, mean (SD), mg/dL 187 (27) 186 (30) 180 (27) 189 (25) −9 (−19 to 0) 0.01
Post hoc outcomes, median (IQR)c
Area above curve 70 mg/dL 0.5 (0.3 to 1.1) 0.7 (0.2 to 1.4) 0.3 (0.2 to 0.5) 0.7 (0.2 to 1.3) <0.001
Area above curve 180 mg/dL 34 (25 to 46) 33 (26 to 45) 27 (17 to 40) 40 (31 to 51) <0.001
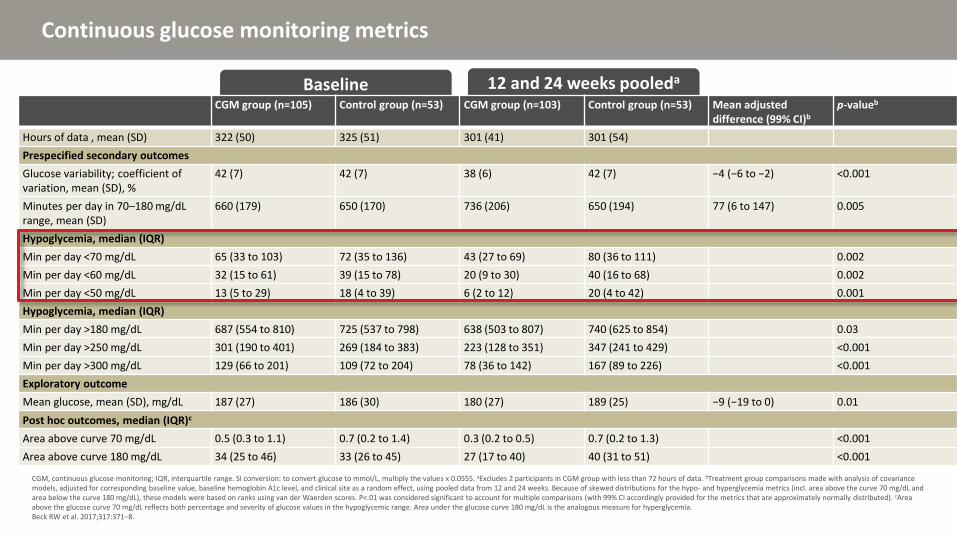
Baseline 12 and 24 weeks pooleda
Continuous glucose monitoring metrics
CGM, continuous glucose monitoring; IQR, interquartile range. SI conversion: to convert glucose to mmol/L, multiply the values x 0.0555. aExcludes 2 participants in CGM group with less than 72 hours of data. bTreatment group comparisons made with analysis of covariance models, adjusted for corresponding baseline value, baseline hemoglobin A1c level, and clinical site as a random effect, using pooled data from 12 and 24 weeks. Because of skewed distributions for the hypo- and hyperglycemia metrics (incl. area above the curve 70 mg/dL and area below the curve 180 mg/dL), these models were based on ranks using van der Waerden scores. P<.01 was considered significant to account for multiple comparisons (with 99% CI accordingly provided for the metrics that are approximately normally distributed). cAreaabove the glucose curve 70 mg/dL reflects both percentage and severity of glucose values in the hypoglycemic range. Area under the glucose curve 180 mg/dL is the analogous measure for hyperglycemia.Beck RW et al. 2017;317:371–8.
CGM group (n=105) Control group (n=53) CGM group (n=103) Control group (n=53) Mean adjusted difference (99% CI)b
p-valueb
Hours of data , mean (SD) 322 (50) 325 (51) 301 (41) 301 (54)
Prespecified secondary outcomes
Glucose variability; coefficient of variation, mean (SD), %
Min per day <70 mg/dL 65 (33 to 103) 72 (35 to 136) 43 (27 to 69) 80 (36 to 111) 0.002
Min per day <60 mg/dL 32 (15 to 61) 39 (15 to 78) 20 (9 to 30) 40 (16 to 68) 0.002
Min per day <50 mg/dL 13 (5 to 29) 18 (4 to 39) 6 (2 to 12) 20 (4 to 42) 0.001
Hypoglycemia, median (IQR)
Min per day >180 mg/dL 687 (554 to 810) 725 (537 to 798) 638 (503 to 807) 740 (625 to 854) 0.03
Min per day >250 mg/dL 301 (190 to 401) 269 (184 to 383) 223 (128 to 351) 347 (241 to 429) <0.001
Min per day >300 mg/dL 129 (66 to 201) 109 (72 to 204) 78 (36 to 142) 167 (89 to 226) <0.001
Exploratory outcome
Mean glucose, mean (SD), mg/dL 187 (27) 186 (30) 180 (27) 189 (25) −9 (−19 to 0) 0.01
Post hoc outcomes, median (IQR)c
Area above curve 70 mg/dL 0.5 (0.3 to 1.1) 0.7 (0.2 to 1.4) 0.3 (0.2 to 0.5) 0.7 (0.2 to 1.3) <0.001
Area above curve 180 mg/dL 34 (25 to 46) 33 (26 to 45) 27 (17 to 40) 40 (31 to 51) <0.001
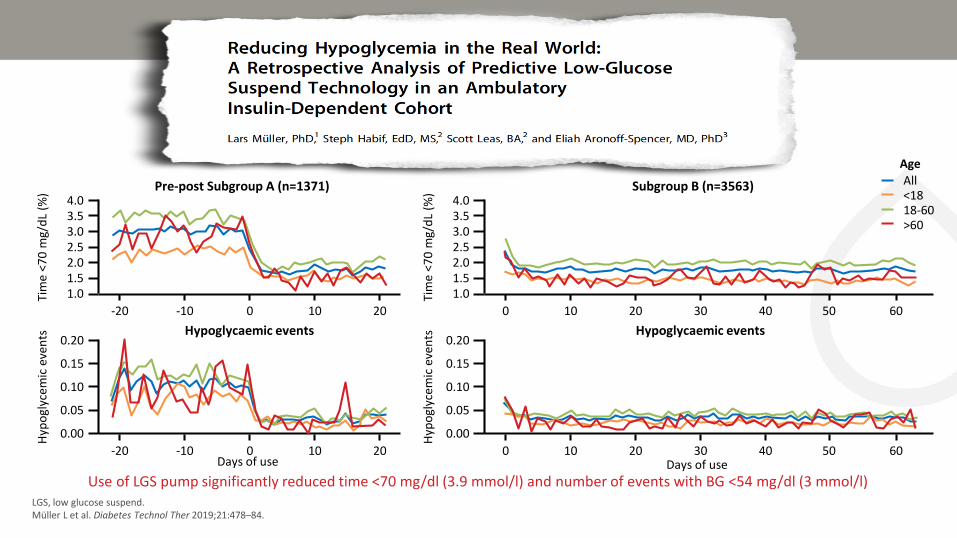
• Retrospective analysis of low glucose suspend (Tandem IQ) users who uploaded 21+ days of data between 8/31/18-3/14/19
• Group A were experienced pump users who had CGM data before and after starting low glucose suspend pump
• Group B were new pump users without CGM data before low glucose suspend pump was started
CGM, continuous glucose monitoring.Müller L et al. Diabetes Technol Ther 2019;21:478–84.
Cohort demographics Overall (n=8123) Subgroup A (n=1371) Subgroup B (n=3563)
Mean days of use 65 (±35) 50 (±19) 63
Age, mean (SD) 32.4 (±19) 33.7 (±20) 31.9 (±19)
Age, range 6-90 9-87 6-87
Under 18, n (%) 2696 (33) 491 (36) 1220 (34)
18-60, n (%) 4729 (58) 750 (55) 2054 (58)
Over 60, n (%) 698 (9) 130 (10) 289 (8)
Female, n (%) 4211 (52) 688 (50) 1851 (52)
Type 1, n (%) 7814 (96) 1316 (96) 3455 (97)
Type 2, n (%) 309 (4) 55 (4) 108 (3)
SD, standard deviation.Müller L et al. Diabetes Technol Ther 2019;21:478–84.
Use of LGS pump significantly reduced time <70 mg/dl (3.9 mmol/l) and number of events with BG <54 mg/dl (3 mmol/l)
Pre-post Subgroup A (n=1371) Subgroup B (n=3563) All<1818-60>60
Age
4.03.53.02.52.01.51.0
-20 -10 0 10 20
Tim
e <7
0 m
g/d
L (%
)
4.03.53.02.52.01.51.0
0 10 20 30 40
Tim
e <7
0 m
g/d
L (%
)
50 60
0.20
0.15
0.10
0.05
0.00
-20 -10 0 10 20
Hyp
ogl
ycem
ic e
ven
ts
Days of use
0.20
0.15
0.10
0.05
0.00
0 10 20 30 40
Hyp
ogl
ycem
ic e
ven
ts
50 60Days of use
Hypoglycaemic events Hypoglycaemic events
LGS, low glucose suspend.Müller L et al. Diabetes Technol Ther 2019;21:478–84.
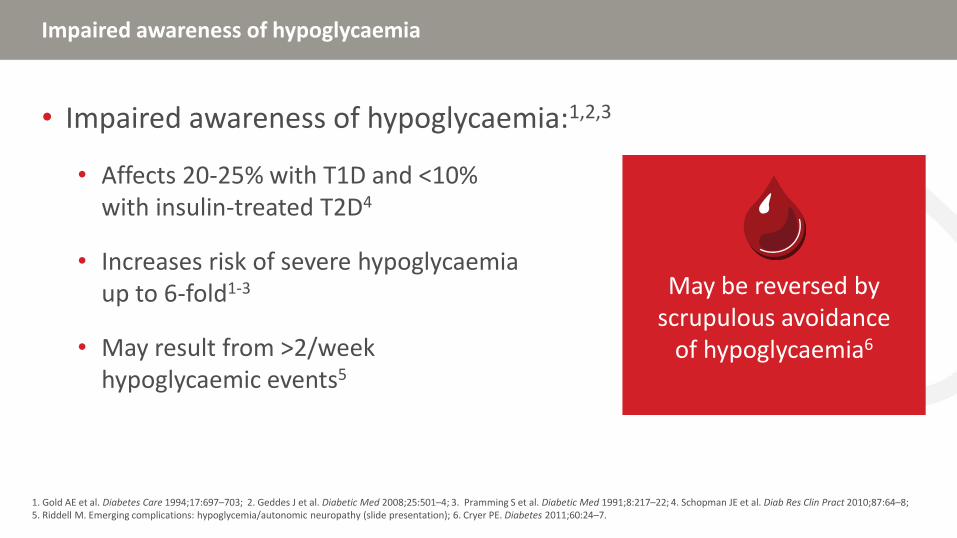
Impaired awareness of hypoglycaemia
• Impaired awareness of hypoglycaemia:1,2,3
• Affects 20-25% with T1D and <10% with insulin-treated T2D4
• Increases risk of severe hypoglycaemia up to 6-fold1-3
• May result from >2/week hypoglycaemic events5
1. Gold AE et al. Diabetes Care 1994;17:697–703; 2. Geddes J et al. Diabetic Med 2008;25:501–4; 3. Pramming S et al. Diabetic Med 1991;8:217–22; 4. Schopman JE et al. Diab Res Clin Pract 2010;87:64–8; 5. Riddell M. Emerging complications: hypoglycemia/autonomic neuropathy (slide presentation); 6. Cryer PE. Diabetes 2011;60:24–7.
May be reversed by scrupulous avoidance
of hypoglycaemia6
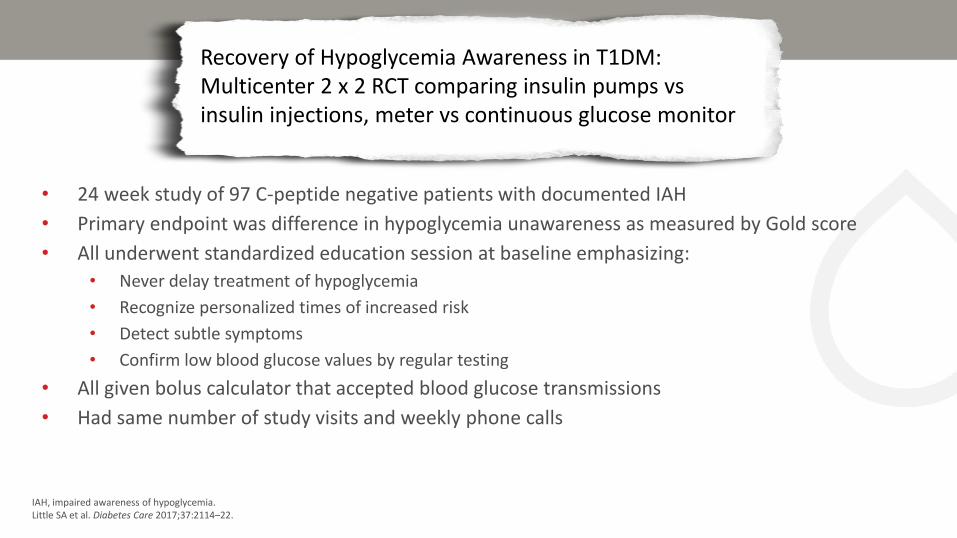
• 24 week study of 97 C-peptide negative patients with documented IAH
• Primary endpoint was difference in hypoglycemia unawareness as measured by Gold score
• All underwent standardized education session at baseline emphasizing:
• Never delay treatment of hypoglycemia
• Recognize personalized times of increased risk
• Detect subtle symptoms
• Confirm low blood glucose values by regular testing
• All given bolus calculator that accepted blood glucose transmissions
• Had same number of study visits and weekly phone calls
IAH, impaired awareness of hypoglycemia.Little SA et al. Diabetes Care 2017;37:2114–22.
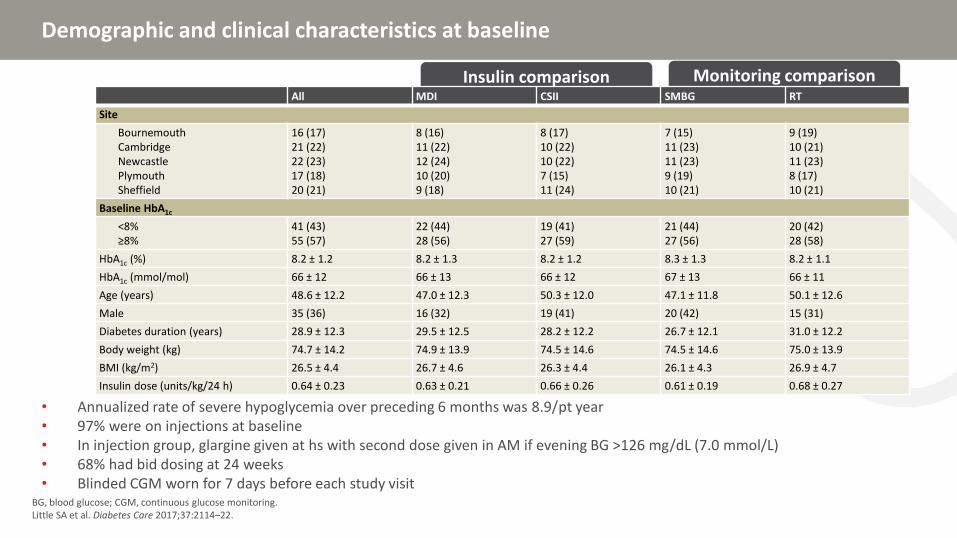
Recovery of Hypoglycemia Awareness in T1DM: Multicenter 2 x 2 RCT comparing insulin pumps vsinsulin injections, meter vs continuous glucose monitor
Insulin comparison Monitoring comparison
Demographic and clinical characteristics at baseline
• Annualized rate of severe hypoglycemia over preceding 6 months was 8.9/pt year• 97% were on injections at baseline• In injection group, glargine given at hs with second dose given in AM if evening BG >126 mg/dL (7.0 mmol/L) • 68% had bid dosing at 24 weeks• Blinded CGM worn for 7 days before each study visit
BG, blood glucose; CGM, continuous glucose monitoring.Little SA et al. Diabetes Care 2017;37:2114–22.
Hypoglycaemia awareness, severe hypoglycaemia, and PROs
• No differences found in primary endpoint between injection vs pump or meter vs continuous glucose monitor• Both groups had a 8 unit reduction in total daily insulin dose by 24 weeks• Higher satisfaction scores in pump group
CSII, continuous subcutaneous insulin infusion; IAH, impaired awareness of hypoglycaemia; MDI, multiple daily injections; PRO, patient-reported outcomes; RT, real-time; SH, severe hypoglycemia; SMBG, self-measured blood glucose.Little SA et al. Diabetes Care 2017;37:2114–22.
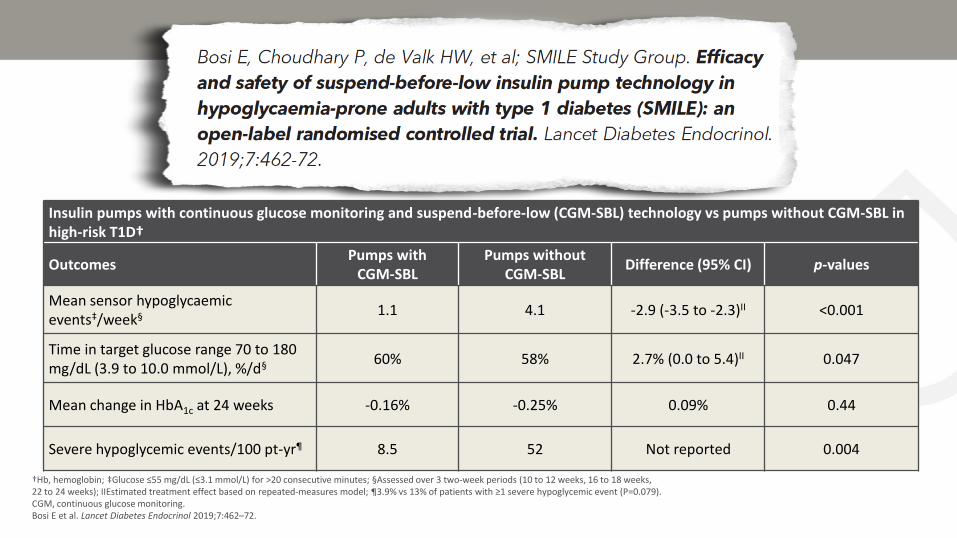
• 24 weeks multicenter randomized trial comparing Medtronic 670 g pump with CGM and suspend before low technology or CSII without CGM
• Subjects selected because of severe hypoglycaemia or Clarke score >4 in last 12 months
• 24-75 years, HbA1c 5.8–10%, no CSII for 6 months and no CGM for 3 months
• Completed 2 week run-in period
• Primary outcome was BG <3.1 mmol/L (55 mg/dL) for 20+ min
BG, blood glucose; CGM, continuous glucose monitoring; CSII, continuous subcutaneous insulin infusion.Bosi E et al. Lancet Diabetes Endocrinol 2019;7:462–72.
Insulin pumps with continuous glucose monitoring and suspend-before-low (CGM-SBL) technology vs pumps without CGM-SBL in high-risk T1D†
OutcomesPumps with
CGM-SBLPumps without
CGM-SBLDifference (95% CI) p-values
Mean sensor hypoglycaemic events‡/week§ 1.1 4.1 -2.9 (-3.5 to -2.3)II <0.001
Time in target glucose range 70 to 180 mg/dL (3.9 to 10.0 mmol/L), %/d§ 60% 58% 2.7% (0.0 to 5.4)II 0.047
Mean change in HbA1c at 24 weeks -0.16% -0.25% 0.09% 0.44
Severe hypoglycemic events/100 pt-yr¶ 8.5 52 Not reported 0.004
†Hb, hemoglobin; ‡Glucose ≤55 mg/dL (≤3.1 mmol/L) for >20 consecutive minutes; §Assessed over 3 two-week periods (10 to 12 weeks, 16 to 18 weeks, 22 to 24 weeks); IIEstimated treatment effect based on repeated-measures model; ¶3.9% vs 13% of patients with ≥1 severe hypoglycemic event (P=0.079).CGM, continuous glucose monitoring.Bosi E et al. Lancet Diabetes Endocrinol 2019;7:462–72.
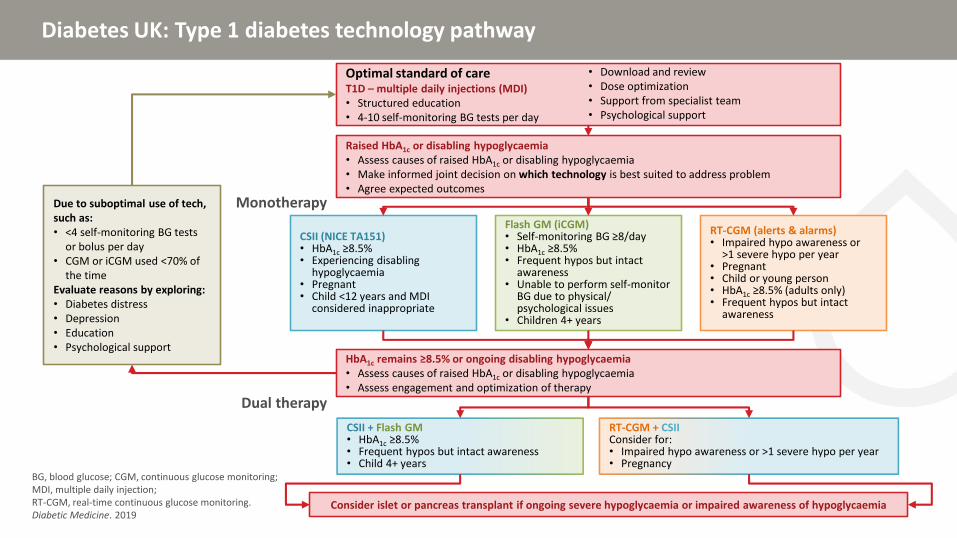
Due to suboptimal use of tech, such as:• <4 self-monitoring BG tests
or bolus per day• CGM or iCGM used <70% of
the timeEvaluate reasons by exploring:• Diabetes distress• Depression• Education• Psychological support
Optimal standard of careT1D – multiple daily injections (MDI)• Structured education• 4-10 self-monitoring BG tests per day
• Download and review• Dose optimization• Support from specialist team• Psychological support
Raised HbA1c or disabling hypoglycaemia• Assess causes of raised HbA1c or disabling hypoglycaemia• Make informed joint decision on which technology is best suited to address problem• Agree expected outcomes
RT-CGM (alerts & alarms)• Impaired hypo awareness or
>1 severe hypo per year• Pregnant• Child or young person• HbA1c ≥8.5% (adults only)• Frequent hypos but intact
awareness
Monotherapy
HbA1c remains ≥8.5% or ongoing disabling hypoglycaemia• Assess causes of raised HbA1c or disabling hypoglycaemia• Assess engagement and optimization of therapy
Dual therapy
CSII + Flash GM• HbA1c ≥8.5%• Frequent hypos but intact awareness• Child 4+ years
RT-CGM + CSIIConsider for:• Impaired hypo awareness or >1 severe hypo per year• Pregnancy
Consider islet or pancreas transplant if ongoing severe hypoglycaemia or impaired awareness of hypoglycaemia
Recuerde, si Usted tiene preguntas para nuestros conferencistas….
Las preguntas se responderán durante el panel de discusión
Levante la mano para que recojan su ficha de preguntas
Panel P&R
Pablo Aschner, MD, MSc
Simon Heller, BA, MB, Bchir, DM, FRCP
Lawrence Leiter, MD, FRCPC, FACP, FACE, FAHA
Elizabeth Seaquist, MD, CDE
Si Usted desea hacer una pregunta a nuestros conferencistas ….
Use el micrófono Llene la ficha de preguntas
Un resumen de todas las P&R estará disponible en IHSGonline.com después de la reunión
Comentarios finales
Pablo Aschner, MD, MSc
Profesor Asociado de Endocrinología,
Escuela de Medicina de la Universidad Javeriana
Asesor de investigaciones, Hospital Universitario San Ignacio
Director Científico, Asociación Colombiana de Diabetes
Bogotá, Colombia
Por favor recuerde completar su formatode evaluación
Incluya su dirección de email para vincularse a la lista de correo de IHSGonline.com y recibir más detallessobre el progreso de IHSG para conver-tirse en Grupo de Estudio de la EASD
Visite IHSGonline.com para las últimas actualizaciones!
• Actualizaciones con regularidad y apuntesde opinión de miembros del IHSG
• Herramientas y materiales educativos
• Artículos de profundización por miembrosdel IHSG
Aparecerá pronto!Traducciones al Español, Francés, Hindi, Mandarin y Árabe de: • Módulo III – Reconocimiento alterado• Module IV – ECV
El simposio de hoy también estará disponible en nuestra página web
Siga al IHSG en los medios sociales
@IHSGonline IHSGonline
Síganos en Twitter y LinkedIn para mantenerse al día con las últimas actualizaciones del IHSG
Hipoglucemia Diabética al día de hoy: Manejo y conecciones con ECV
1 Noviembre 2019
Punta Cana, República Dominicana
Traído para Usted por miembros del International Hypoglycaemia Study Group
Un evento exclusivo del Grupo Internacional para el Estudio de la hipoglucemia (IHSG)En el Congreso de la Asociación Latinoamericana de Diabetes 2019