Long-term mortality in hospitalized patients with community-acquired pneumonia. Supervised by: Alberto Capelastegui Sáiz Jose María Quintana López Ane Uranga Echeverría 2016 PhD Thesis (c)2017 ANE URANGA ECHEVERRIA brought to you by CORE View metadata, citation and similar papers at core.ac.uk provided by Archivo Digital para la Docencia y la Investigación
Transcript
Long-term mortality in hospitalized patients with
community-acquired pneumonia.
Supervised by:
Alberto Capelastegui Sáiz
Jose María Quintana López
Ane Uranga Echeverría
2016
PhD Thesis
(c)2017 ANE URANGA ECHEVERRIA
brought to you by COREView metadata, citation and similar papers at core.ac.uk
provided by Archivo Digital para la Docencia y la Investigación
5. METHODS 57 STUDY I. ONE-YEAR MORTALITY PREDICTION AMONG HOSPITALIZED PATIENTS
WITH CAP IN GALDAKAO-USANSOLO HOSPITAL. 59 5.1. Study design 59 5.2. Setting and study population 59 5.3 Patient selection criteria 60 5.4 Sample size estimation 60 5.5 Missing data 61 5.6 Data collection 61 5.7 Ethics and confidentiality issues 61 5.8 Definitions of variables 62 5.9 Statistical analysis 65
STUDY II. ROLE OF BIOMARKERS FOR ONE-YEAR MORTALITY PREDICTION AMONG
HOSPITALIZED PATIENTS WITH CAP IN GALDAKAO-USANSOLO HOSPITAL. 67 5.1. Study design 67 5.2. Setting and study population 67 5.3 Patient selection criteria 67 5.4 Sample size estimation 68 5.5 Missing data 69 5.6 Data collection 69 5.7 Ethics and confidentiality issues 69 5.8 Definitions of variables 70 5.9 Statistical analysis 70
STUDY III. ONE-YEAR MORTALITY PREDICTION AMONG HOSPITALIZED PATIENTS
WITH CAP IN THE VETERANS AFFAIRS MEDICAL CENTER OF LOUISVILLE,
KENTUCKY. 72 5.1. Study design 72 5.2. Setting and study population 72 5.3 Patient selection criteria 73 5.4 Missing data 74 5.5 Data collection 74 5.6 Ethics and confidentiality issues 75 5.7 Definitions of variables 75 5.8 Statistical analysis 76
6. RESULTS 79 STUDY I. ONE-YEAR MORTALITY PREDICTION AMONG HOSPITALIZED PATIENTS
WITH CAP IN GALDAKAO-USANSOLO HOSPITAL. 81 6.1 Descriptive statistics. 81 6.2 Univariate analysis 87 6.3 Multivariate analysis 91 6.4 Score development 92 6.5 Validation, discrimination, calibration and classification measures 95 6.6 Comparison with other scores 97
STUDY II. ROLE OF BIOMARKERS FOR ONE-YEAR MORTALITY PREDICTION AMONG
HOSPITALIZED PATIENTS WITH CAP IN GALDAKAO-USANSOLO HOSPITAL. 107 6.1 Descriptive statistics 107 6.2 Biomarkers and risk scores predictive accuracy for one-year mortality, after the
exclusion of deaths within 15 days 113
6.3 Biomarkers and risk scores predictive accuracy for one-year mortality, with the
inclusion of all deaths within one year 116 6.4 Role of serial biomarkers levels in one-year mortality prediction 119
STUDY III. ONE-YEAR MORTALITY PREDICTION AMONG HOSPITALIZED PATIENTS
WITH CAP IN THE VETERANS AFFAIRS MEDICAL CENTER OF LOUISVILLE,
KENTUCKY. 122 6.1 Descriptive statistics 122 6.2 Univariate analysis 125 6.3 Multivariate analyses and score development 127
7. DISCUSSION 131 7.1 Overall interpretation of results 133 7.2. Comparison with the literature 135 7.3 Strengths and limitations 151 7.4 Potential clinical use and future research 152
8. CONCLUSIONS 153 STUDY I. One-year mortality prediction among hospitalized patients with CAP in Galdakao-
Usansolo Hospital. 154 STUDY II. Role of biomarkers in one-year mortality prediction among hospitalized patients
with CAP in Galdakao-Usansolo Hospital. 156 STUDY III. One-year mortality prediction among hospitalized patients with CAP in the
Veterans Affairs Medical Center of Louisville, Kentucky. 157
leukocytes/mm3; thrombocytopenia <100,000 platelets/mm3; hypothermia <36 ºC and
hypotension requiring aggressive fluid therapy). The presence of one major criterion or
the sum of at least three minor criteria will indicate the need for admission to intensive
care units or those with intensive monitoring. However, the obviousness of the major
criteria limits the operation of this score, even though it has a validated predictive
ability.
Charles et al. (109) created the SMART-COP (systolic blood pressure, multilobar
chest radiography involvement, albumin level, respiratory rate, tachycardia, confusion,
oxygenation, and arterial pH) score with the purpose of establishing the need for
intensive respiratory or vasopressor support. It consists of eight clinical and analytical
variables with different cut-off points according to age. The patients were classified
into four risk groups on the basis of the need for mechanical ventilation. España et al.
(110) created a new prognostic score (CAP-SCAP), to predict in-hospital mortality
and/or the need for mechanical ventilation and/or onset of septic shock during hospital
Introduction
47
admission in patients with CAP. This score consists of eight variables measured at the
time of diagnosis, namely: pH <7.30 and systolic blood pressure <90, as major criteria,
and confusion; respiratory rate >30 breaths/min; urea nitrogen >30; multilobar
radiographic infiltrates, PaO2/FiO2 <250; and age >80, as minor criteria. From a cut-
off point (>9 points would be equivalent to two minor criteria or one major criterion), it
is recommended that patients are monitored or admitted to intermediate respiratory
care units/intensive care units, whereas those with a score less than nine are
classified as low risk and can be treated as outpatients.
The objectives of stratifying patients with CAP in groups are multiple. On the one
hand, defining what type of patients can be treated as outpatients, and on the other
hand, identifying those patients that require greater control or being monitored in
intermediate respiratory care units/intensive care units. All these prognostic models
predict the probability of mortality in percentage terms and help decide which patients
require hospitalization and who can be treated as outpatients. However, the
heterogeneity of CAP limits their predictive ability. This limitation implies the need of
using "clinical judgment", which is certainly difficult to define in objective terms.
In addition, the scores are not able to measure the mechanisms of the inflammatory
response of the organ affected against the microorganism, nor can predict the
individual responses of the patients to the established treatments. They only predict
short-term mortality and, to date, scores to predict long-term mortality after a CAP
episode have not been created.
LONG‐TERM MORTALITY IN HOSPITALIZED PATIENTS WITH COMMUNITY‐ACQUIRED PNEUMONIA
48
49
3. JUSTIFICATION
Justification
51
CAP continues to be a leading cause of morbidity and mortality worldwide (14). The
annual incidence of CAP ranges from 5 to 11 cases per 1000 adults and accounts for
considerable healthcare costs (7,8). The severity of illness has been a matter of
concern in recent decades since it has been related to short-term prognosis. In this
sense, different CAP guidelines have suggested different risk scores in order to
predict 30-day mortality.
Recently, increasing interest has emerged concerning long-term prognosis. Despite
current evidence about risk factors for one-year mortality after CAP, it seems that
predicting long-term prognosis after an episode of CAP remains challenging. To date,
no risk scores have been developed in order to predict one-year mortality in
hospitalized patients with CAP.
In addition, the utility of biomarkers has been widely evaluated to predict poor
outcomes in CAP. Most researchers have focused on short-term outcomes. However,
several authors have suggested that a few biomarkers could also be useful to predict
long-term prognosis. Little is known about how the addition of biomarkers could
improve long-term prediction.
In an attempt to clarify this issue, three different cohorts were assessed in this study.
The first one was evaluated in order to develop a one-year prediction score among
hospitalized patients with CAP from January 2001 to July 2009 at the Hospital of
Galdakao-Usansolo.
The second one was tested in hospitalized patients with CAP in which blood samples
were obtained from June 2008 to July 2009 at the Hospital of Galdakao-Usansolo, to
assess whether biomarkers are useful for predicting one-year mortality. Finally, a third
cohort was assessed to investigate long-term prognosis among hospitalized patients
with CAP from June 2001 to November 2006 in the Veterans Affairs Medical Center of
Louisville, Kentucky.
LONG‐TERM MORTALITY IN HOSPITALIZED PATIENTS WITH COMMUNITY‐ACQUIRED PNEUMONIA
52
53
4. HYPOTHESES AND OBJECTIVES
Hypotheses and objectives
55
4.1 Hypotheses Study I. One-year mortality prediction among hospitalized patients with CAP in Galdakao-Usansolo Hospital 1. In patients admitted for CAP, it is possible to identify clinical variables relating to
one-year mortality after hospital admission.
2. Depending on the variables previously identified, it is possible to create a prognostic
index that can help in the stratification of one-year mortality prediction in patients
admitted for CAP.
3. A prognostic index specifically created for the prediction of one-year mortality may
have greater predictive ability than usual risk scores in patients admitted for CAP.
Study II. Role of biomarkers for one-year mortality prediction among hospitalized patients with CAP in Galdakao-Usansolo Hospital 1. The severity at the time of clinical diagnosis measured by biomarkers or risk scores
may be associated with one-year mortality in patients admitted for CAP.
2. The incorporation of inflammatory response biomarkers to risk scores could
improve the ability for predicting one-year mortality.
3. The decrease in levels of inflammation biomarkers from the time of diagnosis until
three to five days could help in predicting one-year mortality in patients admitted for
CAP.
Study III. One-year mortality prediction among hospitalized patients with CAP in the Veterans Affairs Medical Center of Louisville, Kentucky, USA 1. The variables of patients admitted for CAP to a Veterans Hospital in the United
States will differ from the sample of study I.
2. The creation of a prognostic index for long-term mortality in patients of an American
cohort admitted for CAP to a Veterans Hospital could help professional health teams
to better identify the patients with high mortality risk in order to perform enhanced
monitoring.
LONG‐TERM MORTALITY IN HOSPITALIZED PATIENTS WITH COMMUNITY‐ACQUIRED PNEUMONIA
56
4.2 Objectives
Primary Study I. One-year mortality prediction among hospitalized patients with CAP in Galdakao-Usansolo Hospital 1. To assess the factors associated with one-year mortality in patients admitted after a
CAP episode.
2. To create and validate a prognostic index for one-year mortality in patients admitted
after a CAP episode.
3. To compare the predictive ability of existing severity scores and the new prognostic
index for one-year mortality.
Secondary: Study II. Role of biomarkers for one-year mortality prediction among hospitalized patients with CAP in Galdakao-Usansolo Hospital 1. To assess the relationship between severity scores and levels of biomarkers of
systemic inflammation (CRP, proADM, and PCT) obtained at the time of diagnosis and
one-year mortality in patients admitted for CAP.
2. To determine the predictive ability of biomarkers and prognostic scores and
associate them in order to improve the predictive value.
3. To assess the relationship between the evolution of biomarkers levels from
admission to three to five days and one-year mortality in patients admitted for CAP.
Study III. One-year mortality prediction among hospitalized patients with CAP in the Veterans Affairs Medical Center of Louisville, Kentucky, USA 1. To assess the differences between the variables of a sample from a Veterans
Hospital in the United States and the variables of study I.
2. To create a predictive score for long-term mortality in an American cohort of
patients admitted for CAP to a Veterans Hospital.
57
5. METHODS
Methods
59
STUDY I. ONE-YEAR MORTALITY PREDICTION AMONG HOSPITALIZED PATIENTS WITH CAP IN GALDAKAO-USANSOLO HOSPITAL.
5.1. Study design
This was an observational, prospective study of adults aged ≥18 years admitted to the
Hospital of Galdakao-Usansolo, from January 2001 to July 2009 with a diagnosis of
CAP. The entire cohort was divided into two parts in order to develop a one-year
mortality predictive model in the first cohort (the derivation cohort) that was validated
using the second cohort (the validation cohort).
Firstly, a subset of variables considered clinically important to predict one-year
mortality were selected. Secondly, the relationships between those variables and one-
year mortality was assessed and statistically significant variables were considered in a
multivariate analysis. Once the predictive variables were identified, a weighted score
was developed and validated in the validation cohort. At the same time, the score was
divided into three categories: mild, moderate and high risk groups. Finally, the
predictive accuracy of the score was compared to other risk scores.
5.2. Setting and study population
The study was carried out at the Hospital of Galdakao-Usansolo (Galdakao, Spain), a
400-bed teaching hospital in the Basque Country (northern Spain) that serves a
population of 300,000 inhabitants. This medical institution belongs to the network of
public hospitals of the Basque Health Care Service, which provides free unrestricted
care to nearly 100% of the population.
The Pneumology Department staff is composed of full-time physicians qualified in
standardized national residency programs. Since 2000, the team has developed a
consolidated line of research with a clear influence on science confirmed by loads of
publications. The Infections Division of the Pneumology Department has developed a
clinical guideline for CAP management that is still working and that has led to many
publications. It should be highlighted that this team developed a specific score to
predict severe CAP, the SCAP score, with a clear impact on the literature.
LONG‐TERM MORTALITY IN HOSPITALIZED PATIENTS WITH COMMUNITY‐ACQUIRED PNEUMONIA
60
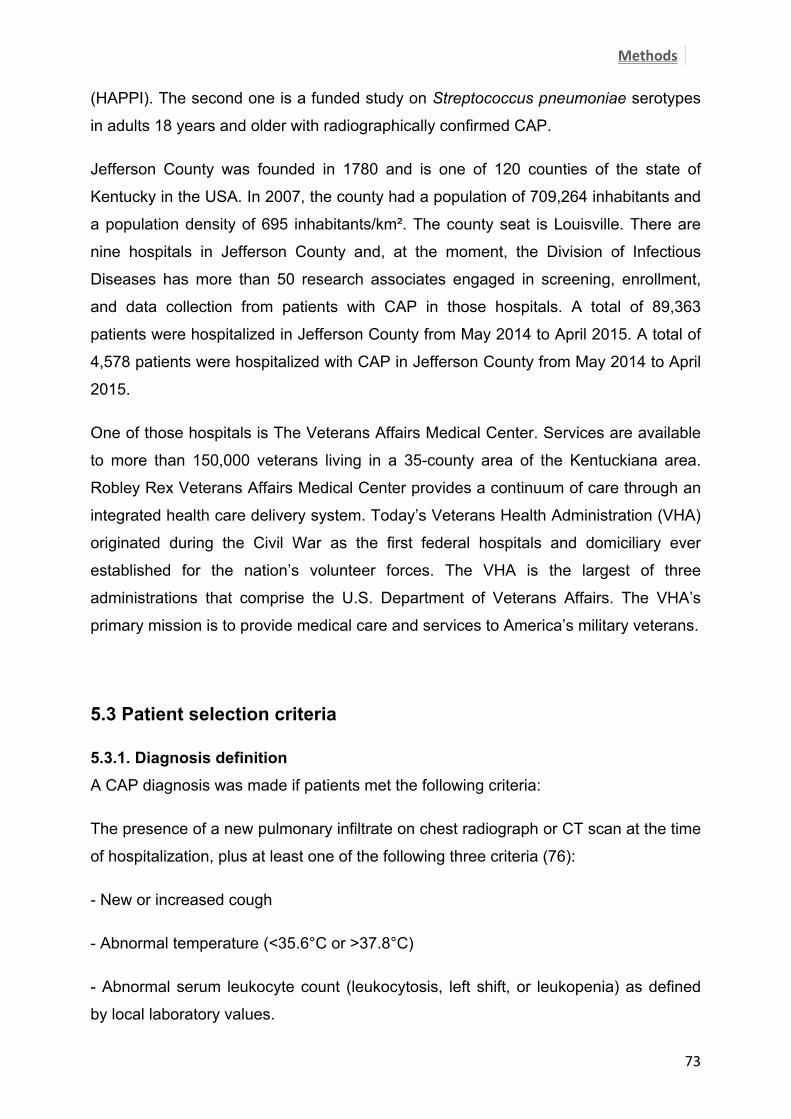
5.3 Patient selection criteria
5.3.1. Diagnosis definition Pneumonia was defined as pulmonary infiltrate on chest X-ray not seen previously
plus at least one symptom compatible with pneumonia such as cough, fever, dyspnea,
and/or chest pain (106).
5.3.2 Inclusion criteria Hospitalized patients diagnosed with CAP were recruited from January 2001 to July
2009. Eligible patients were ≥18 years old, hospitalized with a diagnosis of CAP.
5.3.3 Exclusion criteria . Death within the first 15 days from diagnosis.
. Had been discharged from an acute care hospital, an onsite subacute care unit, or a
palliative care unit within the previous 14 days.
. Infected with the human immunodeficiency virus.
. Chronically immunosuppressed, defined as:
. Solid organ transplantation
. Post-splenectomy
. Receiving ≥10 mg/day prednisone or equivalent for more than 30 days
. Being on other immunosuppressive agents
. Having neutropenia, i.e., <1.0 x10⁹/L neutrophils
5.4 Sample size estimation
Studies of predictive model development indicate that it is necessary to include at
least 10 events of the dependent variable of interest (in this case: mortality, major
complications, relapses, or readmissions) for each independent variable included in
the multivariate logistic regression model [111,112]. Therefore, we estimated that at
least 100 events of the dependent variable in the sample are required in order to
Methods
61
ensure that the regression model would adequately converge. Previous data indicate
that the number of events of the dependent variable mortality would be >15% of
patients operated on in the first year, higher that the expected percentages of other
parameters. We therefore estimated that more than 300 events of any of the
dependent variables of interest should be included. Thus, we consecutively collected
all new cases until the sample size was achieved.
5.5 Missing data
No assumptions were made for missing data, analyzing only the available data.
5.6 Data collection
At baseline, the demographic and clinical data for each patient were collected from
medical records, including comorbidities, physical examination, radiological
presentation, analytics as well as complications during hospitalizations. Antibiotic
treatment was assessed according to Spanish Pulmonology and Thoracic Surgery
Society (SEPAR) guidelines (113).
Disease severity was determined with the PSI, CURB65, and SCAP scores,
calculated within the first 24 hours after diagnosis (106,107,110). One-year mortality
was retrospectively assessed by the computer system support of the Basque Health
Care Service.
5.7 Ethics and confidentiality issues
All participants provided signed informed consent before their inclusion in the study
and after being informed and having discussed the goals, risks, and potential benefits
of the study. Patient rights were protected in line with the Declaration of Helsinki. The
project was approved by the hospitals’ ethical review boards.
LONG‐TERM MORTALITY IN HOSPITALIZED PATIENTS WITH COMMUNITY‐ACQUIRED PNEUMONIA
62
In order to preserve patient data confidentiality, restricted access to the database was
limited to a single person, with a user name and password. Similarly, patient
identifying information was managed separately from the rest of the study information.
5.8 Definitions of variables
● Primary outcome was one-year mortality after admission for CAP.
Patients who died within the first 15 days after diagnosis were excluded in order to
avoid the impact of severity of illness on mortality.
● Secondary outcomes
- Patient condition at the time of diagnosis
Demographics, comorbidities, physical examination, radiological presentation and
analytics.
. Alcohol consumption: More than 80 g/day of alcohol intake.
. Nursing home: Being a nursing home resident.
. Aspiration: Suspicion of aspiration at diagnosis, usually seen in patients with
difficulties swallowing.
. Diabetes mellitus: Patients with diabetes under treatment with oral antidiabetic
agents or insulin therapy.
. COPD: Chronic pulmonary obstructive disease including chronic bronchitis and
emphysema.
. Cancer: History of cancer.
. CHF: Patients with exertional dyspnea, paroxysmal nocturnal dyspnea and
responding symptomatically or in a physical examination to treatment with digitalis,
diuretics or afterload reducers drugs. Patients without symptomatic improvement after
medication or those without improvement in physical examination were not included.
. CAD: Patients with a history of acute or chronic coronary artery disease.
Methods
63
. CVD: Patients with a clinical or radiological diagnosis of cerebrovascular accident or
transient ischemic attack.
. Dementia: Chronic cognitive impairment.
. Renal failure: Chronic kidney disease or abnormal blood levels of creatinine.
. Confusion: Altered mental status, previously not reported disorientation of place, time
or person.
. Pleural effusion (X-ray): Pleural effusion on the X-ray at diagnosis.
. Bilateral/multilobar (X-ray): Bilateral or multilobar involvement on the X-ray at
diagnosis.
. Mixed radiological pattern: Both alveolar and interstitial pattern on the X-ray.
● Treatment administration
. Previous antibiotic treatment.
. Antibiotic according to SEPAR guidelines.
. Time until first antibiotic dose.
. Corticosteroids administration: systemic corticosteroids administration during
hospitalization.
● Complications during hospitalization
. Intensive Care Unit (ICU) admission: ICU admission during hospitalization.
. Intermediate Respiratory Care Unit (IRCU) admission: IRCU admission during
hospitalization.
. Mechanical ventilation: Need for invasive mechanical ventilation.
. Septic shock: Sepsis-induced hypotension despite adequate fluid resuscitation along
with the presence of perfusion abnormalities that may include but are not limited to
lactic acidosis, oliguria, or an acute alteration in mental status. Patients receiving
LONG‐TERM MORTALITY IN HOSPITALIZED PATIENTS WITH COMMUNITY‐ACQUIRED PNEUMONIA
64
inotropic or vasopressor agents may not be hypotensive at the time that perfusion
abnormalities are measured (114).
. Need for vasopressors: Need for vasopressor agents.
. Respiratory failure: Presence of pO2/FiO2 <300.
. Renal failure: Abnormal blood levels of creatinine, not previously reported.
. Pleural effusion: Development of pleural effusion not reported at the time of
diagnosis.
. Empyema: Pus in the pleural space.
. Antibiotic adverse events: appearance of symptoms such as diarrhea attributable to
antibiotics.
. Embolism: Pulmonary embolism diagnosis by computerized tomography.
. Deep vein thrombosis diagnosis by ultrasonography.
. Decompensated comorbidities: Exacerbation of previously diagnosed diabetes
mellitus, asthma, COPD, heart disease, neurological disease, or renal failure.
● Severity of illness at the time of diagnosis
PSI, CURB65 and SCAP scores were used to assess the severity of illness at
admission. The PSI and CURB65 were both developed and validated for 30-day
mortality while the SCAP score was developed and validated for in-hospital mortality
and/or need for mechanical ventilation and/or septic shock.
The PSI score was elaborated in the USA by Fine et al. (106) and is based on 20
Data are presented as n (%). ICU: Intensive care unit; IRCU: Intermediate respiratory care unit; IMV: Invasive mechanical ventilation; AE: Adverse events; DVT: Deep vein thrombosis; COPD: Chronic obstructive pulmonary disease.
Table 6 shows baseline severity measured by risk scores. The mean PSI (SD) score
was 91.39 (32.73) and 91.58 (31.65) in the derivation and the validation cohorts,
respectively (p = 0.88). The mean CURB65 (SD) score was 1.63 (1.06) and 1.67
(1.05) in the derivation and the validation cohorts, respectively (p = 0.88). The mean
SCAP (SD) score was 7.67 (7.58) and 7.71 (7.26) in the derivation and the validation
cohorts, respectively (p = 0.90). About 50% of the cohort was defined as severe by the
PSI score, 20% by the CURB65 score, and 40% by SCAP score.
Results
85
Table 6. Baseline severity of hospitalized patients with CAP in the derivation cohort,
the validation cohort, and the entire cohort, measured by risk scores.
Derivation (n=1208)
Validation (n=1143)
Entire cohort (n=2351)
p-value
PSI mean (SD) 91.39 (32.73) 91.58 (31.65) 91.48 (32.20) 0.88
PSI, n (%) 0.40
I 158 (13.08%) 148 (12.95%) 306 (13.02%)
II 157 (13%) 128 (11.20%) 285 (12.12%)
III 298 (24.67%) 268 (23.45%) 566 (24.07%)
IV 464 (38.41%) 481 (42.08%) 945 (40.20%)
V 131 (10.84%) 118 (10.32%) 249 (10.59%)
PSI, n (%) 0.13
I-III 613 (50.75%) 544 (47.59%) 1157 (49.21%)
IV-V 595 (49.25%) 599 (52.41%) 1194 (50.79%)
CURB65 mean (SD) 1.63 (1.06) 1.67 (1.04) 1.65 (1.05) 0.88
Data are presented as n (%) or mean (SD). PSI: Pneumonia severity index; CURB65: Confusion, urea, respiratory rate, blood pressure, age >65. SCAP: Severe community acquired pneumonia.
LONG‐TERM MORTALITY IN HOSPITALIZED PATIENTS WITH COMMUNITY‐ACQUIRED PNEUMONIA
86
In total, 208 (7.99%) patients died during hospitalization, while 251 patients died
before 15 days from diagnosis. After deaths before 15 days were excluded, one-year
mortality was 10.63%, respectively. No differences were observed between the
derivation and the validation cohorts in terms of mortality (Table 7).
Table 7. Mortality rates of hospitalized patients with CAP in the derivation cohort, the
validation cohort, and the entire cohort, after the exclusion of deaths before 15 days
Data are presented as n (%) or mean (SD). AC: Alcohol consumption; COPD: Chronic obstructive pulmonary disease; CHF; Congestive heart failure; CAD; Coronary artery disease; CVD; Cerebrovascular disease.
LONG‐TERM MORTALITY IN HOSPITALIZED PATIENTS WITH COMMUNITY‐ACQUIRED PNEUMONIA
88
Table 9 shows the physical examination, radiological presentation and analytics data
among survivors and non-survivors. Non-survivors presented more frequently
confusion and a respiratory rate ≥30 breaths/min compared to survivors. In terms of
analytics, people who died presented more commonly BUN >30 mmol/L, hematocrit
<30%, and respiratory insufficiency.
Table 9. Physical examination, radiological presentation, analytics and treatment of
survivors and non-survivors at one year in the derivation cohort.
Antibiotic within first 4 h 618 (59.71%) 87 (67.97%) 0.08 Antibiotic within first 8 h 861 (83.19%) 105 (82.03%) 0.71 Corticosteroids 282 (26.18%) 45 (34.35%) 0.06
Data are presented as n (%). HR: Heart rate; RR: Respiratory rate; SBP: Systolic blood pressure; DBP: Diastolic blood pressure; BT: Body temperature; BUN: Blood urea nitrogen; SEPAR: Spanish Pulmonology and Thoracic Surgery Society.
Results
89
Severe sepsis was observed more commonly in non-survivors, as were respiratory
insufficiency and renal failure. Compared with survivors at one year, non-survivors
more frequently developed decompensations from previous cardiac and neurologic
diseases (Table 10).
Table 10. Complications during hospitalization of survivors and non-survivors at one
year in the derivation cohort.
Alive (n=1077)
Dead (n=131)
p-value
ICU admission, n (%) 53 (4.92%) 1 (0.76%) 0.02 IRCU admission, n (%) 52 (4.83%) 3 (2.29%) 0.26 Need for IMV, n (%) 18 (1.67%) 0 (0%) 0.25 Shock, n (%) 44 (4.09%) 5 (3.82%) >.99 Need for vasopressors, n (%) 36 (4.06%) 0 (0%) 0.03 Respiratory failure, n (%) 480 (44.57%) 80 (61.07%) 0.0003 Renal failure, n (%) 85 (7.89%) 15 (11.45%) 0.18 Pleural effusion, n (%) 47 (4.36%) 7 (5.34%) 0.65 Antibiotic AE, n (%) 90 (8.36%) 9 (6.87%) 0.73 Embolism, n (%) 4 (0.37%) 2 (1.53%) 0.13 DVT, n (%) 3 (0.28%) 1 (0.76%) 0.37 Decompensated comorbidities, n (%)
Data are presented as n (%). ICU: Intensive care unit; IRCU: Intermediate respiratory care unit; IMV: Invasive mechanical ventilation; AE: Adverse events; DVT: Deep vein thrombosis; COPD: Chronic obstructive pulmonary disease.
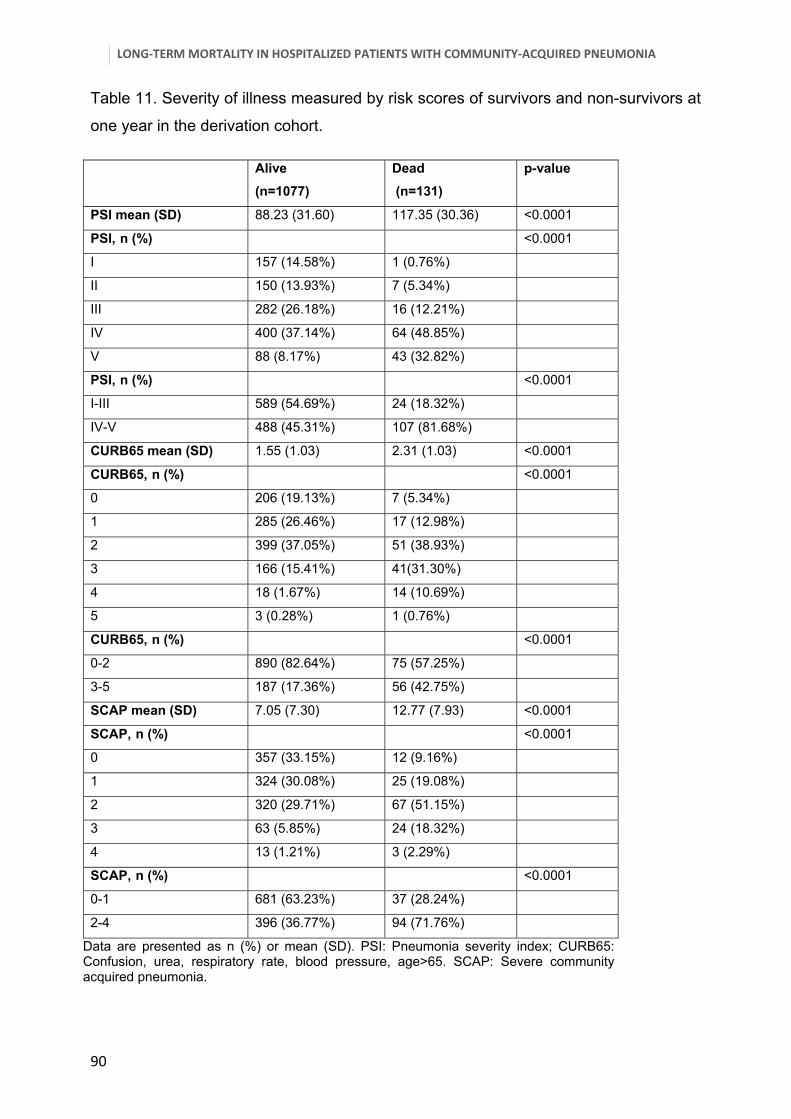
Table 11 shows severity of illness among survivors and non-survivors. Patients who
died within one year were more severely ill at the time of diagnosis or at the index
admission, as evidenced by higher risk scores.
LONG‐TERM MORTALITY IN HOSPITALIZED PATIENTS WITH COMMUNITY‐ACQUIRED PNEUMONIA
90
Table 11. Severity of illness measured by risk scores of survivors and non-survivors at
one year in the derivation cohort.
Alive (n=1077)
Dead (n=131)
p-value
PSI mean (SD) 88.23 (31.60) 117.35 (30.36) <0.0001
PSI, n (%) <0.0001
I 157 (14.58%) 1 (0.76%)
II 150 (13.93%) 7 (5.34%)
III 282 (26.18%) 16 (12.21%)
IV 400 (37.14%) 64 (48.85%)
V 88 (8.17%) 43 (32.82%)
PSI, n (%) <0.0001
I-III 589 (54.69%) 24 (18.32%)
IV-V 488 (45.31%) 107 (81.68%)
CURB65 mean (SD) 1.55 (1.03) 2.31 (1.03) <0.0001
CURB65, n (%) <0.0001
0 206 (19.13%) 7 (5.34%)
1 285 (26.46%) 17 (12.98%)
2 399 (37.05%) 51 (38.93%)
3 166 (15.41%) 41(31.30%)
4 18 (1.67%) 14 (10.69%)
5 3 (0.28%) 1 (0.76%)
CURB65, n (%) <0.0001
0-2 890 (82.64%) 75 (57.25%)
3-5 187 (17.36%) 56 (42.75%)
SCAP mean (SD) 7.05 (7.30) 12.77 (7.93) <0.0001
SCAP, n (%) <0.0001
0 357 (33.15%) 12 (9.16%)
1 324 (30.08%) 25 (19.08%)
2 320 (29.71%) 67 (51.15%)
3 63 (5.85%) 24 (18.32%)
4 13 (1.21%) 3 (2.29%)
SCAP, n (%) <0.0001
0-1 681 (63.23%) 37 (28.24%)
2-4 396 (36.77%) 94 (71.76%)
Data are presented as n (%) or mean (SD). PSI: Pneumonia severity index; CURB65: Confusion, urea, respiratory rate, blood pressure, age>65. SCAP: Severe community acquired pneumonia.
Results
91
6.3 Multivariate analysis From the identification of variables related to one-year mortality, we proceeded to try
to combine them in a single multivariate model. We first performed multivariable
logistic regression model which identified age ≥80 years, CHF, dementia, respiratory
rate ≥30 breaths/min and BUN ≥30 mg/dL as predictors of one-year mortality (Table
12).
Regarding the discriminatory ability of the model in the derivation cohort, the receiver
operating characteristic (ROC) curve was 0.78 (0.73-0.82) and 0.79 (0.75-0.83) in the
validation cohort. The Hosmer-Lemeshow calibration test was 0.05 in the derivation
cohort and 0.01 in the validation cohort.
Table 12. Multivariate logistic regression model for one-year mortality in the derivation cohort and the
validation cohort.
Derivation cohort Validation cohort
Variables Beta (s.e.) OR (95% CI) p-value Beta (s.e.) OR (95% CI) p-value
Beta (s.e): Beta regression coefficient with standard error; HR: Hazard ratio; CI: Confidence interval. CHF: Congestive heart failure; RR: Respiratory rate; BUN: Blood urea nitrogen. GND test: Greenwood-Nam-D'agostino calibration test for the one-year CAPSI as a continuous variable.
Results
93
Figure 1. One-year CAPSI distribution in the derivation cohort and validation cohort.
For each unit increase in the score, the one-year mortality risk increased by 24% (1.24
(1.19, 1.28), HR (95%CI)). The one-year CAPSI was then categorized into three risk
groups: low, moderate, and high risk, according to the one-year CAPSI risk score
(Table 14). One-year mortality risk ranged from 3.35% in the lowest group to 28.38%
in the highest group in the derivation cohort.
Similarly, one-year mortality risk ranged from 4.21% in the lowest group to 25% in the
highest group in the validation cohort. Therefore, an 82-year-old patient with dementia
would have 9.91 (6.30, 15.59) (HR (95%CI)) times higher probability of dying one year
after an admission for CAP. At the same time, a 50-year-old patient with congestive
heart failure and a respiratory rate of 32 breaths/min would have a 3.19 (1.75, 5.83)
(HR (95%CI)) times higher probability of dying one year after an admission for CAP.
Score punctua on
Derivation
Validation Mortality %
LONG‐TERM MORTALITY IN HOSPITALIZED PATIENTS WITH COMMUNITY‐ACQUIRED PNEUMONIA
94
Table 14. Multivariate survival analysis for one-year mortality in the derivation cohort and the validation
cohort by risk stratification groups.
HR: Hazard ratio; CI: Confidence interval. GND test: Greenwood-Nam-D'agostino calibration test for the one-year CAPSI as categorical variable. *Hazard risk of each increase in one unit in the one-year CAPSI.
6.5 Validation, discrimination, calibration and classification measures The C-index of the one-year CAPSI as a continuous variable in the derivation cohort
was 0.76 (0.024), the AIC was 1707.43, and R2 was 8.8%. In the validation cohort, the
C-index of the one-year CAPSI as a continuous variable was 0.77 (0.025), the AIC
was 1589.23, and R2 was 8.5%. When the one-year CAPSI was measured as a
categorical variable, i.e. the one-year CAPSI risk score, the C-index of the derivation
cohort was 0.72 (0.021), the AIC was 1715.30 and R2 was 8.2%. In the validation
cohort, the C-index of the one-year CAPSI as a categorical variable was 0.70 (0.023),
the AIC was 1589.23 and R2 was 6.3%.
Table 15 shows the statistical measures of performance with different cut-offs of the
one-year CAPSI. For a cut-off point of four for the one-year CAPSI, the results of the
statistical measures of performance were sensitivity 81.40%, specificity 64.47%,
positive predictive value (PPV) 21.56%, and negative predictive value (NPV) 96.65%
with an accuracy of 66.28% for the derivation cohort. In the validation cohort,
sensitivity was 75.63%, specificity 65.09%, PPV 20.27%, and NPV 95.79% with an
accuracy of 66.20%.
For a cut-off of six for the one-year CAPSI, sensitivity was 66.67%, specificity 79.81%,
PPV 28.38%, and NPV 95.23% with an accuracy of 78.41% in the derivation cohort. In
the validation cohort, sensitivity was 57.98%, specificity 79.59%, PPV 25%, and NPV
94.17% with an accuracy of 77.32%.
For a cut-off of eight for the one-year CAPSI, sensitivity was 39.53%, specificity
90.70%, PPV 33.77%, and NPV 95.59% with an accuracy of 85.22% in the derivation
cohort. In the validation cohort, sensitivity was 40.34%, specificity 90.83%, PPV
34.04%, and NPV 92.84% with an accuracy of 85.53%.
The Greenwood-Nam-D'agostino (GND) calibration test for survival models for the
multivariate model was 0.002 and 0.49 in the derivation and the validation cohorts,
respectively. The GND calibration test for the survival model for the one-year CAPSI
as a continuous variable was 0.03 and 0.23 in the derivation and the validation
cohorts, respectively.
LONG‐TERM MORTALITY IN HOSPITALIZED PATIENTS WITH COMMUNITY‐ACQUIRED PNEUMONIA
96
Finally, the GND calibration test for the survival model for one-year CAPSI as a
categorical variable, i.e. the one-year CAPSI risk score, was 0.98 and 0.93 in the
derivation and the validation cohorts, respectively.
Table 15. Statistical measures of performance with different cut-offs for one-year
AIC: Akaike information criterion; R2: R-square. PSI: Pneumonia severity index; CURB65: Confusion, urea, respiratory rate, blood pressure, age>65. SCAP: Severe community acquired pneumonia.
Figures 10 and 11 show the ROC analysis for continuous risk scores in the derivation
and validation cohorts. Figures 12 and 13 show ROC analysis for categorical risk
scores in the derivation and validation cohorts.
Figure 10. ROC curve analysis for continuous risk scores in the derivation cohort.
Results
105
0.0 0.2 0.4 0.6 0.8 1.0
0.0
0.2
0.4
0.6
0.8
1.0
ROC Curve analysis for categorical risk scores in the derivation sample
1-Specificity
Sen
sitiv
ity
PSISCAPCURB651-year CAPSI
Figure 11. ROC curve analysis for continuous risk scores in the validation cohort.
Figure 12. ROC curve analysis for categorical risk scores in the derivation cohort.
0.0 0.2 0.4 0.6 0.8 1.0
0.0
0.2
0.4
0.6
0.8
1.0
ROC Curve analysis for continuous risk scores in the validation sample
1-Specificity
Sen
sitiv
ity
PSISCAPCURB651-year CAPSI
LONG‐TERM MORTALITY IN HOSPITALIZED PATIENTS WITH COMMUNITY‐ACQUIRED PNEUMONIA
106
Figure 13. ROC curve analysis for categorical risk scores in the validation cohort.
0.0 0.2 0.4 0.6 0.8 1.0
0.0
0.2
0.4
0.6
0.8
1.0
ROC Curve analysis for categorical risk scores in the validation sample
1-Specificity
Sen
sitiv
ity
PSISCAPCURB651-year CAPSI
Results
107
STUDY II. ROLE OF BIOMARKERS FOR ONE-YEAR MORTALITY PREDICTION AMONG HOSPITALIZED PATIENTS WITH CAP IN GALDAKAO-USANSOLO HOSPITAL.
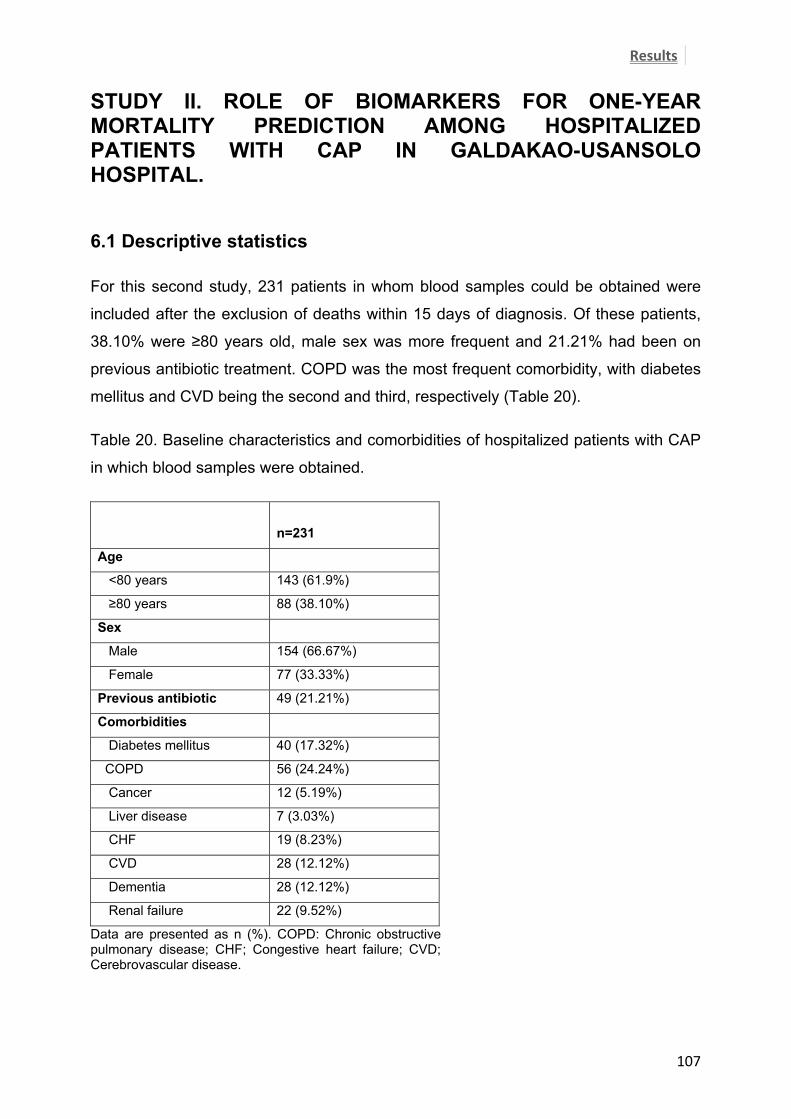
6.1 Descriptive statistics For this second study, 231 patients in whom blood samples could be obtained were
included after the exclusion of deaths within 15 days of diagnosis. Of these patients,
38.10% were ≥80 years old, male sex was more frequent and 21.21% had been on
previous antibiotic treatment. COPD was the most frequent comorbidity, with diabetes
mellitus and CVD being the second and third, respectively (Table 20).
Table 20. Baseline characteristics and comorbidities of hospitalized patients with CAP
in which blood samples were obtained.
n=231
Age
<80 years 143 (61.9%)
≥80 years 88 (38.10%)
Sex
Male 154 (66.67%)
Female 77 (33.33%)
Previous antibiotic 49 (21.21%)
Comorbidities
Diabetes mellitus 40 (17.32%)
COPD 56 (24.24%)
Cancer 12 (5.19%)
Liver disease 7 (3.03%)
CHF 19 (8.23%)
CVD 28 (12.12%)
Dementia 28 (12.12%)
Renal failure 22 (9.52%)
Data are presented as n (%). COPD: Chronic obstructive pulmonary disease; CHF; Congestive heart failure; CVD; Cerebrovascular disease.
LONG‐TERM MORTALITY IN HOSPITALIZED PATIENTS WITH COMMUNITY‐ACQUIRED PNEUMONIA
108
Table 21 shows the physical examination and radiological presentation data. Around
20% of the patients presented with confusion, diastolic blood pressure less than 60
mmHg and bilateral and or multilobar involvement at diagnosis.
Table 21. Physical examination and radiological presentation of hospitalized patients
with CAP in which blood samples were obtained.
n=231
Physical examination, n (%)
Confusion 46 (19.91%)
HR ≥125 beats/min 31 (13.42%)
RR ≥30 breaths/min 17 (7.36%)
SBP <90 mmHg 4 (1.73%9
DBP <60 mmHg 44 (19.05%)
BT ≥40°C 1 (0.43%)
X-ray, n (%)
Pleural effusion 24 (10.39%)
Bilateral/multilobar 43 (18.61%)
Radiological pattern, n (%)
Alveolar 227 (98.27%)
Interstitial 3 (1.30%)
Mixed 1 (0.43%)
Data are presented as n (%). HR: Heart rate; RR: Respiratory rate; SBP: Systolic blood pressure; DBP: Diastolic blood pressure; BT: Body temperature.
Table 22 shows the analytical data with 43.72% suffering from respiratory
insufficiency, almost 30% presenting with a BUN higher than 30 mg/dL and 6.9%
presenting with glucose >250 mg/dL. More than 80% of patients received adherent
antibiotic treatment according to SEPAR guidelines and within the first 8 hours. In
addition, nearly 40% received corticosteroids during hospitalization (Table 23).
Results
109
Table 22. Analytical data of hospitalized patients with CAP in which blood samples
were obtained.
n=231
Analytics, n (%)
Glucose >250 mg/dL 16 (6.93%)
BUN >30 mg/dL 67 (29%)
Sodium <130 mmol/L 13 (5.63%)
Hematocrit <30 11 (4.76%)
PaO2 <60 mmHg 101 (43.72%)
pH arterial <7.35 13 (5.63%)
Data are presented as n (%). BUN: Blood urea nitrogen.
Table 23. Antibiotic and systemic corticosteroid treatment of hospitalized patients with
CAP in which blood samples were obtained.
n=231
Antibiotic, n (%)
Previous antibiotic 49 (21.21%)
Antibiotic according to
SEPAR guidelines
193 (83.91%)
Antibiotic within first 4 h 164 (73.54%)
Antibiotic within first 8 h 202 (90.58%)
Corticosteroids, n (%) 91 (39.39%)
Data are presented as n (%). SEPAR: Spanish Pulmonology and Thoracic Surgery Society.
Table 24 shows complications during hospitalization, the most frequent one being
respiratory failure. Of these patients, 15.58% required admission to the IRCU and
5.19% admission to the ICU. However, only eight patients required vasopressors and
only one patient needed invasive ventilation.
LONG‐TERM MORTALITY IN HOSPITALIZED PATIENTS WITH COMMUNITY‐ACQUIRED PNEUMONIA
110
Table 24. Complications during hospitalization among hospitalized patients with CAP
in which blood samples were obtained.
n=231
ICU admission, n (%) 12 (5.19%)
IRCU admission, n (%) 36 (15.58%)
Need for IMV, n (%) 1 (0.43%)
Severe sepsis, n (%) 103(44.59%)
Need for vasopressors, n (%) 8 (3.46%)
Respiratory failure, n (%) 98 (42.42%)
Renal failure, n (%) 31 (13.42%)
Pleural effusion, n (%) 21 (9.09%)
Antibiotic AE, n (%) 10 (4.33%)
Embolism, n (%) 1 (0.43%)
DVT, n (%) 2 (0.87%)
Decompensated comorbidities, n (%)
Diabetes mellitus 14 (6.06%)
Asthma 9 (3.90%)
COPD 10 (4.33%)
Heart disease 10 (4.33%)
Neurological disease 10 (4.33%)
Renal failure 8 (3.46%)
Data are presented as n (%). ICU: Intensive care unit; IRCU: Intermediate respiratory care unit; IMV: Invasive mechanical ventilation; AE: Adverse events; DVT: Deep vein thrombosis; COPD: Chronic obstructive pulmonary disease.
Table 25 shows the severity of illness at diagnosis. The mean PSI (SD) score was
93.30 (36.14), the mean CURB65 (SD) score was 1.71 (1.09), and the mean SCAP
score was 7.79 (7.57). About 50% of the cohort was defined as severe by the PSI
score, 23% by the CURB65 score and 42% by the SCAP score.
Results
111
Table 25. Baseline severity of hospitalized patients with CAP in which blood samples
were obtained.
Data are presented as n (%) or mean (SD). PSI: Pneumonia severity index; CURB65: Confusion, urea, respiratory rate, blood pressure, age >65. SCAP: Severe community acquired pneumonia.
n=231
PSI mean (SD) 93.30 (36.14)
PSI, n (%)
I 32 (13.85%)
II 26 (11.26%)
III 54 (23.38%)
IV 86 (37.23%)
V 33 (14.29%)
PSI, n (%)
I-III 112 (48.48)
IV-V 119 (51.52%)
CURB65 mean (SD) 1.71 (1.09)
CURB65, n (%)
0 39 (16.88%)
1 52 (22.51%)
2 86 (37.23%)
3 44 (19.05%)
4 10 (4.33%)
5 -
CURB65, n (%)
0-2 177 (76.62%)
3-5 54 (23.38%)
SCAP mean (SD) 7.79 (7.57) SCAP, n (%) O 68 (29.44%) 1 65 (28.14%) 2 75 (32.47%)
3 21 (9.09%)
4 2 (0.87%)
SCAP, n (%)
0-1 133 (57.58%)
2-4 98 (42.42%)
One-year CAPSI mean (SD) 3.43 (3.69)
One-year CAPSI, n (%)
≤3 129 (55.84%)
>3 102 (44.16%)
LONG‐TERM MORTALITY IN HOSPITALIZED PATIENTS WITH COMMUNITY‐ACQUIRED PNEUMONIA
112
Table 26 shows the mortality rate excluding deaths within the first 15 days as well as
including all deaths up to one year. Within one year, 51 (19.78%) patients died
including all deaths, 20 patients during hospitalization, 7 after discharge up to 15 days
after diagnosis, and 24 patients 15 days after diagnosis up to one year. After the
exclusion of 27 patients who died within 15 days of diagnosis, 24 (10.39%) died within
one year.
Table 26. Mortality rates of hospitalized patients with CAP in whom blood samples
could be obtained (n=231).
Including all deaths within one year N= 258
In-hospital mortality, n (%) 20 (7.75%)
15-day mortality1, n (%) 27 (10.47%)
One-year mortality2, n (%) 51 (19.78%)
Excluding deaths within 15 days N= 231
One-year mortality, n (%) 24 (10.39%)
1Including in-hospital mortality, 2Including all deaths within one year. Data are presented as n (%).
Results
113
6.2 Biomarkers and risk scores predictive accuracy for one-year mortality, after the exclusion of deaths within 15 days Table 27 shows the relationship between biomarker levels obtained at the time of
diagnosis and severity of illness, measured by risk scores after the exclusion of deaths
within the first 15 days. More severe patients measured by PSI, CURB65, SCAP, and
one-year CAPSI had significantly higher levels of proADM. In addition, more severe
patients measured by the one-year CAPSI had significantly lower levels of CRP.
Table 27. Relation between biomarkers and severity of illness, measured by risk
1After exclusion of deaths within 15 days. Data are presented as median (IQR) of each biomarker. CRP: C reactive protein; PCT: Procalcitonin; ProADM: Proadrenomedullin; PSI: Pneumonia severity index. CURB65: Confusion, Urea, Respiratory rate, Blood pressure, age>65. SCAP: Severe community-acquired. Pneumonia; one-year CAPSI: one-year community-acquired pneumonia severity index.
LONG‐TERM MORTALITY IN HOSPITALIZED PATIENTS WITH COMMUNITY‐ACQUIRED PNEUMONIA
114
Table 28 shows the Cox regression model with the predictive ability of biomarkers for
one-year mortality as continuous variables showing a poor predictive accuracy with a
C-index of 0.57 for CRP (p=0.11), 0.51 for PCT (p value=0.55), and 0.64 for proADM
(p=0.39).
Table 28. Survival models of the predictive accuracy of biomarkers for one-year
Table 30. Nested model comparison to assess risk scores ability with the proADM
value added1.
One-year mortality C-index AIC p-value
PSI 0.80 (0.06) 226.00 Ref.
PSI + ProADM 0.82 (0.06) 224.04 0.05
CURB65 0.70 (0.06) 247.43 Ref.
CURB65 + ProADM 0.70 (0.06) 248.77 0.42
SCAP 0.77 (0.06) 236.95 Ref.
SCAP + ProADM 0.77 (0.06) 238.17 0.38
One-year CAPSI 0.75 (0.06) 243.18 Ref.
One-year CAPSI + ProADM 0.75 (0.06) 245.14 0.83
1After exclusion of deaths within 15 days. AIC: Akaike information criterion; R2: R-square. P-value indicate the statistical significance comparing with the same model without the biomarker. ProADM: Proadrenomedullin; PSI: Pneumonia Severe Index. CURB65: Confusion, Urea, Respiratory rate, Blood pressure, age>65. SCAP: Severe Community Acquired Pneumonia; one-year CAPSI: one-year community-acquired pneumonia severity index.
LONG‐TERM MORTALITY IN HOSPITALIZED PATIENTS WITH COMMUNITY‐ACQUIRED PNEUMONIA
116
6.3 Biomarkers and risk scores predictive accuracy for one-year mortality, with the inclusion of all deaths within one year In order to assess the impact of short-term mortality, a similar analysis was carried out
including all deaths. Table 31 shows the relationships between biomarker levels
obtained at the time of diagnosis and the severity of illness, measured by risk scores
including all deaths up to one year. Similarly, more severe patients measured by PSI,
CURB65, SCAP, and one-year CAPSI had significantly higher levels of proADM. In
addition, more severe patients, measured by one-year CAPSI, had significantly lower
levels of CPR at diagnosis.
Table 31. Relation between biomarkers and severity of illness, measured by risk
p-value 0.0038 0.13 <0.0001 1Including all deaths within one year. Data are presented as median (IQR).CRP: C reactive protein; PCT: Procalcitonin; ProADM: Proadrenomedullin. PSI: Pneumonia Severe Index; CURB65: Confusion, Urea, Respiratory rate, Blood pressure, age>65; SCAP: Severe Community Acquired Pneumonia; one-year CAPSI: one-year community-acquired pneumonia severity index.
Results
117
Table 32 shows the Cox regression models with the predictive ability of biomarkers for
one-year mortality including all deaths within one year. ProADM showed a high
predictive accuracy for one-year mortality with a C-index of 0.71 (0.04), (p<0.001).
However, both CRP and PCT showed a low predictive accuracy for one-year mortality
(C-index 0.54 (0.04), p=0.24; C-index 0.53 (0.04), p=0.47). All risk scores showed a
high predictive accuracy for one-year mortality when all deaths were included (Table
33).
Table 32. Predictive accuracy of biomarkers for one-year mortality.
1Including all deaths within one year. HR: Hazard ratio; CI: Confidence interval; AIC: Akaike information criterion; R2: R-square. PSI: Pneumonia Severe Index. CURB65: Confusion, Urea, Respiratory rate, Blood pressure, age>65. SCAP: Severe Community Acquired Pneumonia; one-year CAPSI: one-year community-acquired pneumonia severity index.
Table 34. Nested model comparison to assess the predictive accuracy of risk scores
when the proADM value was added1.
One-year mortality C-index AIC p-value
PSI 0.77 (0.04) 481.37 Ref.
PSI + ProADM 0.79 (0.04) 481.34 0.15
CURB65 0.71 (0.04) 500.70 Ref.
CURB65 + ProADM 0.74 (0.04) 498.75 0.0498
SCAP 0.79 (0.04) 473.09 Ref.
SCAP + ProADM 0.80 (0.04) 473.54 0.21
One-year CAPSI 0.81 (0.04) 474.91 Ref.
One-year CAPSI + ProADM
0.83 (0.04) 470.61 0.010
1Including all deaths within one year. AIC: Akaike information criterion; R2: R-squared. ProADM: Proadrenomedullin; PSI: Pneumonia Severe Index. CURB65: Confusion, Urea, Respiratory rate, Blood pressure, age>65. SCAP: Severe Community Acquired Pneumonia; one-year CAPSI: one-year community-acquired pneumonia severity index.
Results
119
6.4 Role of serial biomarkers levels in one-year mortality prediction Descriptive values of biomarker levels at diagnosis, at 3-5 days and changes from the
first 24 hours to 3-5 days are shown in Table 35. Biomarker changes was calculated
by subtracting the biomarker value at 3-5 days from the baseline value. In an attempt
to assess the predictive accuracy of biomarkers over time, blood samples were
obtained from 117 patients at 3-5 days.
Table 35. Biomarker levels at diagnosis and at 3-5 days.
� Adjusted by proADM value at baseline.1Excluding deaths within 15 days of diagnosis, 2Including all deaths within one year, 3Excluding patients who died from 15 days after diagnosis to one year. The p values refer to the proADMchanges. HR: Hazard ratio; CI: Confidence interval; AIC: Akaike information criterion; R2: R-square.ProADM difference: obtained by subtracting the proADM value at 3-5 days from proADM value at the time of diagnosis;
Table 37 shows the predictive accuracy of the proADM change for one-year mortality
after the exclusion of deaths within 15 days, adjusted by risk scores and the proADM
value at baseline. In this case, ProADM changes failed to predict one-year mortality.
The same analysis was carried out including all deaths within one year, as shown in
table 38. For each 0.1-nmol/L decrease in proADM from admission to 3-5 days, the
mortality rate decreased by 9% when adjusted by the one-year CAPSI and proADM
baseline value.
Table 37. Predictive accuracy of proADM change for one-year mortality among different
risk scores, after the exclusion of deaths ≤ 15 days�.
�Adjusted by severity and proADM value at baseline, *for each 0.1-nmol/L increment. The p values refer to the proADMchanges. HR: Hazard ratio; CI: Confidence interval; AIC: Akaike information criterion; R2: R-square. ProADM difference: obtained by subtracting PRADM value at 3-5 days from proADM value at the time of diagnosis; PSI: Pneumonia Severe Index. CURB65: Confusion, Urea, Respiratory rate, Blood pressure, age>65. SCAP: Severe Community Acquired Pneumonia; one-year CAPSI: one-year community-acquired pneumonia severity index.
Results
121
Table 38. Predictive accuracy of proADM difference for one-year mortality among
different risk scores, including all deaths within one year1.
1Adjusted by severity and proADM value at baseline,*for each 0.1-nmol/L increment. HR: Hazard ratio; CI: Confidence interval; AIC: Akaike information criterion; R2: R-square. ProADM difference: obtained by subtracting PRADM value at 3-5 days from ProADM value at the time of diagnosis; PSI: Pneumonia Severe Index. CURB65: Confusion, Urea, Respiratory rate, Blood pressure, age>65. SCAP: Severe Community Acquired Pneumonia; one-year CAPSI: one-year community-acquired pneumonia severity index.
In addition, the same analysis was carried out after excluding patients who died between 15
days from diagnosis and one year (Table 39). ProADM changes adjusted by severity showed
a high predictive accuracy with a C-index of 0.94 (0.11) for one-year CAPSI. For each 0.1-
nmol/L decrease in proADM from admission to 3-5 days, the mortality rate decreased by
11% when adjusted by the one-year CAPSI and proADM value at baseline.
Table 39. Predictive accuracy of the proADM difference for one-year mortality among
different risk scores, excluding patients who died between 15 days after diagnosis and
1Adjusted by severity and proADM value at baseline, *for each 0.1-nmol/L increment. HR: Hazard ratio; CI: Confidence interval; AIC: Akaike information criterion; R2: R-square. ProADM difference: obtained by subtracting PRADM value at 3-5 days from ProADM value at the time of diagnosis; PSI: Pneumonia Severe Index. CURB65: Confusion, Urea, Respiratory rate, Blood pressure, age>65. SCAP: Severe Community Acquired Pneumonia; one-year CAPSI: one-year community-acquired pneumonia severity index.
LONG‐TERM MORTALITY IN HOSPITALIZED PATIENTS WITH COMMUNITY‐ACQUIRED PNEUMONIA
122
STUDY III. ONE-YEAR MORTALITY PREDICTION AMONG HOSPITALIZED PATIENTS WITH CAP IN THE VETERANS AFFAIRS MEDICAL CENTER OF LOUISVILLE, KENTUCKY.
6.1 Descriptive statistics A total of 455 patients were included in the analysis. Of these, 121 (27%) patients died
within one year while 265 (58%) of patients died within five years. All patients were
male, 39.56% were older than 75, and almost half of the cohort were current smokers.
Hypertension, COPD, and CAD were the most frequent comorbidities. In addition,
almost half of the cohort had an albumin <3.5 and a BUN >20 mg/dL (Tables 40 and
41).
Table 40. Baseline characteristics and comorbidities of hospitalized patients with CAP.
n=455
Age ≥75 years 180 (39.56%)
Sex (male) 455 (100%)
Current smoker 191 (42.26%)
BMI <21 40 (8.93%)
Nursing home resident 17 (3.74%)
Suspicion of aspiration 18 (4.25%)
Hypertension 320 (70.33%)
Diabetes 157 (34.51%)
COPD 227 (49.89%)
Cancer 58 (12.75%)
CHF 117 (25.71%)
CAD 198 (43.52%)
CVD 57 (12.53%)
Dementia 39 (9.21%)
Renal disease 67 (14.73%)
Liver disease 15 (3.3%) Data are presented as n (%). BMI: Body mass index; COPD: Chronic obstructive pulmonary disease; CHF: Congestive heart failure; CAD: Coronary artery disease; CVA: Cerebrovascular disease.
Results
123
Table 41. Physical examination and analytics of hospitalized patients with CAP.
n=455
Respiratory rate >30 breaths/min 44 (9.67%)
BUN >20 mg/dL 237 (52.43%)
Albumin <3.5 mg/dL 216 (47.47%)
Hematocrit <30% 26 (5.71%)
Platelets <100x109/L or >400x109/L, n (%) 78 (17.18%)
Data are presented as n (%). BUN: blood urea nitrogen.
Patient sociodemographic characteristic and comorbidities were compared between
study I and study III (Table 42). Patients in study III were all men, were significantly
younger, and more frequently presented diabetes mellitus, COPD, cancer, CHF, CAD,
CVD, and renal failure. In addition, patients in study III were more severe at
admission, measured by PSI, and more frequently had a respiratory rate ≥30
breaths/min, BUN >30 mg/dL, and hematocrit <30% compared with patients in study I.
From the initial 2351 patients at Galdakao-Usansolo Hospital, 250 (10.63%) patients
died within one year after the exclusion of deaths within the first 15 days, while 120
(27.71%) patients died in the sample of patients hospitalized at the Veterans Affairs
Medical Center in Louisville, Kentucky.
One-year CAPSI was applied to this sample and it failed to properly validate the
previous results with a C-index of 0.62 (0.03), AIC of 1405.44, and R2 5.1%.
LONG‐TERM MORTALITY IN HOSPITALIZED PATIENTS WITH COMMUNITY‐ACQUIRED PNEUMONIA
124
Table 42. Comparison of patient sociodemographic characteristics and comorbidities
Data are presented as n (%) or mean (SD); COPD: Chronic obstructive pulmonary disease; CHF: Congestive heart failure; CAD: Coronary artery disease; CVA: Cerebrovascular disease; BUN: Blood urea nitrogen.
Results
125
6.2 Univariate analysis Table 43 shows the patient characteristics among survivors and non-survivors at one
year. Compared to those who survived at one year, non-survivors were older, were
more frequently nursing home residents, and more frequently had cancer, COPD,
CVD, and dementia. In addition, non-survivors presented with lower levels of albumin
and hematocrit and more frequently had BUN >20 mg/dL and platelet counts
<100,000 or >400,000/L.
Table 43. Characteristics among survivors and non-survivors at one year.
Variable
Alive Dead p-value
Age, median (IQR) 70 (22) 75 (12) <0.001 Age ≥75 years, n (%) 118 (35) 62 (51) 0.002 Current smoker, n (%) 146 (44) 45 (37) 0.198 BMI <21, n (%) 26 (8) 14 (12) 0.259 Nursing home resident, n (%) 5 (1) 12 (10) <0.001 Suspicion of aspiration, n (%) 10 (3) 8 (7) 0.179 Hypertension, n (%) 231 (69) 89 (74) 0.417 Diabetes, n (%) 113 (34) 44 (36) 0.656 COPD, n (%) 167 (50) 60 (50) >0.999 Cancer, n (%) 15 (4) 43 (36) <0.001 CHF, n (%) 83 (25) 34 (28) 0.544 CAD, n (%) 140 (42) 58 (48) 0.285 CVD, n (%) 32 (10) 24 (20) 0.006 Dementia, n (%) 19 (6) 20 (17) 0.002 Renal disease, n (%) 48 (14) 19 (16) 0.765 Liver disease, n (%) 9 (3) 6 (5) 0.241 Respiratory rate >30 breaths/min, n (%) 30 (9) 14 (12) 0.472 BUN >20 mg/dL, n (%) 164 (49) 73 (61) 0.033 Albumin <3.5 mg/dL, n (%) 148 (44) 68 (56) 0.026 Hematocrit <30%, n (%) 9 (3) 17 (14) <0.001 Platelets <100x109/L or >400x109/L, n (%) 44 (13) 34 (28) <0.001 pO2/FiO2 <250 mmHg, n (%) 85 (46) 31 (43) 0.78
Data are presented as n (%) and median (IQR). BMI: Body mass index; COPD: Chronic obstructive pulmonary disease; CHF: Congestive heart failure; CAD: Coronary artery disease; CVA: Cerebrovascular accident; BUN: blood urea nitrogen.
LONG‐TERM MORTALITY IN HOSPITALIZED PATIENTS WITH COMMUNITY‐ACQUIRED PNEUMONIA
126
Those patients who died within five years were also older, were more frequently
nursing home residents, and more frequently had cancer, COPD, CVD, and dementia.
Similarly, non-survivors at five years presented with lower levels of albumin and
hematocrit and more frequently had BUN >20 mg/dL and platelet counts <100,000 or
>400,000/L (Table 44).
Table 44. Characteristics among survivors and non-survivors at five years.
Variable
Alive Dead p-value
Age, median (IQR) 66 (20.8) 74 (17) <0.001 Age ≥75 years, n (%) 55 (29) 125 (47) <0.001 Current smoker, n (%) 84 (45) 107 (40) 0.384 BMI <21, n (%) 12 (6) 28 (11) 0.133 Nursing home resident, n (%) 2 (1) 15 (6) 0.011 Suspicion of aspiration, n (%) 4 (3) 14 (5) 0.218 Hypertension, n (%) 130 (68) 190 (72) 0.468 Diabetes, n (%) 67 (35) 90 (34) 0.842 COPD, n (%) 82 (43) 145 (55) 0.017 Cancer, n (%) 8 (4) 50 (19) <0.001 CHF, n (%) 40 (21) 77 (29) 0.064 CAD, n (%) 71 (37) 127 (48) 0.028 CVD, n (%) 18 (9) 38 (14) 0.148 Dementia, n (%) 7 (4) 32 (12) 0.009 Renal disease, n (%) 25 (13) 42 (16) 0.503 Liver disease, n (%) 4 (2) 11 (4) 0.292 Respiratory rate >30 breaths/min, n (%) 15 (8) 29 (11) 0.335 BUN >20 mg/dL, n (%) 88 (47) 149 (57) 0.036 Albumin <3.5 mg/dL, n (%) 78 (41) 138 (52) 0.022 Hematocrit >30%, n (%) 3 (2) 23 (9) 0.001 Platelets <100x109/L or >400x109/L, n (%) 21 (11) 57 (22) 0.004 pO2/FiO2 <250 mmHg, n (%) 47 (47) 69 (44) 0.798
Data are presented as n (%) and median (IQR). BMI: Body mass index; COPD: Chronic obstructive pulmonary disease; CHF: Congestive heart failure; CAD: Coronary artery disease; CVA: Cerebrovascular accident; BUN: blood urea nitrogen.
Results
127
6.3 Multivariate analyses and score development Table 45 shows the one-year prediction score. A score based on age ≥75 years,
cancer, CHF, dementia, albumin <3.5mg/dL and platelets <100.000 or >400.000/L
could predict one-year mortality with an AUC of 0.77. When the same score was used
to predict five-year mortality, the AUC was 0.70. Representation of the score for one-
year and five-year mortality is shown in Figure 14.
Beta (s.e): Beta regression coefficient with standard error; AUC: Area under the curve; BMI: Body mass index; CHF: Congestive heart failure;
Table 46 shows the five-year prediction score. Age ≥75 years old, aspiration, being
nursing home resident, cancer, CHF, underweight, and platelets <100,000 or
>400,000/L could predict five-year mortality with an AUC of 0.69. Representation of
this second score for five-year mortality is shown in Figure 15.
LONG‐TERM MORTALITY IN HOSPITALIZED PATIENTS WITH COMMUNITY‐ACQUIRED PNEUMONIA
128
Table 46. Five-year mortality prediction score.
Variable Beta (s.e) Statistic p-value Weight
Intercept -0.42 (0.17) -2.50 0.01
Age ≥75 0.95 (0.23) 4.05 <0.001 2
BMI <21 0.92 (0.44) 2.08 0.04 2
Nursing home 1.94 (1.06) 1.82 0.07 3
Aspiration 0.85 (0.60) 1.40 0.16 2
Cancer 1.4 (0.41) 3.41 0.0006 2
CHF 0.80 (0.27) 2.94 0.003 2
Platelets <100x109/L or >400x109/L 0.75 (0.31) 2.41 0.02 1
AUC 0.69
Beta (s.e): Beta regression coefficient with standard error; AUC: Area under the curve; BMI: Body mass
index; CHF: Congestive heart failure
Figure 14. Representation of the initial score to predict one-year and five-year
mortality.
Results
129
Figure 15. Representation of the second score to predict five-year mortality.
LONG‐TERM MORTALITY IN HOSPITALIZED PATIENTS WITH COMMUNITY‐ACQUIRED PNEUMONIA
130
131
7. DISCUSSION
Discussion
133
7.1 Overall interpretation of results
There are three major issues in this study:
1. This study indicates that long-term mortality in hospitalized patients with CAP is
high. An easy-to-use score with five variables can help physicians identify those
patients with CAP at high risk of death within one year of an index admission. A
weighted score, called the one-year CAPSI, constructed by age ≥80, CHF, dementia,
BUN >30 mg/dL and a respiratory rate of ≥30 breaths/min can predict one-year
mortality with a high predictive accuracy. Indeed, one-year CAPSI showed significantly
better predictive accuracy than CURB65 and SCAP.
2. In recent decades, increasing interest has emerged concerning biomarkers. In this
sense, this study demonstrates that proADM is associated with the severity of disease
measured by severity scores. Hence, patients with more severe disease at diagnosis
present higher levels of proADM. After the exclusion of deaths within 15 days, only 24
patients died within one year. Biomarkers showed poor predictive accuracy for one-
year mortality and were not able to improve the prediction ability of risk scores for one-
year mortality when added to the scores. In a subanalysis carried out including all
deaths up to one year, proADM showed the best predictive ability for one-year
mortality and, when added to the one-year CAPSI, the prediction ability of the score
was significantly improved.
On the other hand, a decrease in proADM from the first 24 hours to 3-5 days, adjusted
by proADM value at baseline, was associated with a significantly reduced risk of death
at one year. However, once it was adjusted by severity of disease and proADM
baseline value, only when all deaths within one year were analyzed was associated
with a significantly reduced risk of death at one year, meaning that, based on our
sample, its predictive ability is mainly for short-term mortality.
LONG‐TERM MORTALITY IN HOSPITALIZED PATIENTS WITH COMMUNITY‐ACQUIRED PNEUMONIA
134
3. Long-term mortality was assessed in an external cohort at the Veterans Affairs
Medical Center of Louisville, Kentucky. Patients from this study differed from the
patients in study I in terms of sociodemographics and comorbidities. Hence, the one-
year CAPSI failed to properly validate previous results when applied to this sample.
Thus, a specific cohort with different variables from one-year CAPSI was developed
for one-year mortality with a high predictive accuracy and based on age ≥75 years,
cancer, CHF, dementia, albumin <3.5mg/dL and platelets <100,000 109/L or >400,000
109/L. However, it seems that predicting mortality on a longer time prediction model is
more difficult. In fact, the same score was tested for five-year mortality with a
decrease in predictive ability. Another specific score was developed for five-year
mortality but the predictive accuracy was not as high as expected.
Discussion
135
7.2. Comparison with the literature
7.2.1. STUDY I: This study indicates that long-term mortality in hospitalized patients with CAP is high. An easy-to-use score with five variables can help physicians identify those patients with CAP at high risk of death within one year of an index admission. A weighted score, called the one-year CAPSI, constructed by age ≥80, CHF, dementia, BUN >30 mg/dL and a respiratory rate of ≥30 breaths/min can predict one-year mortality with a high predictive accuracy. Indeed, one-year CAPSI showed significantly better predictive accuracy than CURB65 and SCAP.
Despite advances in supportive care, CAP continues to be a leading cause of
morbidity and mortality worldwide (14). Along with influenza, is currently the eighth
leading overall cause of death in the United States (116). However, this mortality is
only related to short-term mortality. Most researchers have focused their interest on
the first months after an episode of pneumonia. It has been postulated that deaths
within 15 days of a pneumonia diagnosis are related to the acute episode.
Consequently, those patients were excluded from the present study in order to avoid
the immediate impact of pneumonia on mortality. Increasing interest is emerging
concerning the long-term prognosis after pneumonia, with mortality rates between 10-
20% in the literature (6,14). However, predicting long-term mortality remains
challenging.
In the present study and coinciding with literature, the one-year mortality rate in the
entire cohort after the exclusion of deaths within 15 days of diagnosis was as high as
10%. This increased risk has been found to be independent of previous comorbid
diseases (27). However, the impact on prognosis of the interaction between an acute
episode and comorbidities should be cautiously assessed. It has been suggested that
patients hospitalized with CAP have higher long-term mortality rates. Furthermore, it
seems that the mortality rate is even higher than those patients hospitalized for other
reasons. In this sense, Bordon et al. (50) identified a 40% higher risk of death within 7
years after a hospitalization for CAP when compared to patients hospitalized for other
reasons. Recently, a German study compared mortality rates after an episode of CAP
with a control group and observed 17%, 43%, and 53% mortality rates at 2, 5 and, 7
LONG‐TERM MORTALITY IN HOSPITALIZED PATIENTS WITH COMMUNITY‐ACQUIRED PNEUMONIA
136
years, respectively, among patients with CAP versus 4%, 19%, and 24% in the control
group (71).
In this sense, specific prognostic indices for one-year mortality after hospitalization for
any reason have been developed (23,24,117). Walter et al. (23) identified that male
sex, functional status, CHF, cancer, creatinine, and low albumin are risk factors for
one-year mortality in older adults after a hospitalization. However, the authors limited
their analysis to patients over 70 years of age and to all patients discharged from a
general medical service at a tertiary care hospital. The prognostic index developed in
the present study focused on patients with CAP. Moreover, all age groups were
considered, which actually makes it more useful due to the similarity to real life, as in
daily clinical practice.
The one-year CAPSI is a one year prognostic index that weights dementia with 6
points, age ≥80 with 4 points, BUN >30 mg/dL with 3 points, and 2 points for both RR
≥30 breaths/min and CHF. Therefore, an 82-year-old patient with congestive heart
failure would have a 9.91 (6.30,15.59), HR (95%CI) times higher probability of dying
one year after an admission for CAP. At the same time, a 50-year-old patient with a
respiratory rate of 32 breaths/min and 50 mg/dL of BUN would have a 3.19 (1.75,
5.83), HR (95%CI)) times higher probability of dying one year after an admission for
CAP.
Dementia was the best predictor of one-year mortality in hospitalized patients with
CAP. Dementia is defined as chronic cognitive impairment; its origin is usually due to
cerebrovascular disease, which is closely related to inflammation (28,36). Patients
with CAP suffer an inflammatory storm during the acute episode, which could lead to a
worsening of previously existing inflammation. Chronic persistent inflammation after
an acute episode with CAP could lead to the high long-term mortality of these patients.
There are other variables usually related to dementia in clinical practice, such as being
a nursing home resident, having poor functional status, and aspiration. Being a
nursing home resident is included in the HCAP concept. The definition of HCAP was
developed and published in the 2005 ATS/IDSA guidelines, in order to identify an
increased risk of drug resistant pathogens in patients coming from the community
(76). The HCAP concept included any patient who was hospitalized in an acute care
hospital for two or more days within 90 days of the infection, who resided in a nursing
Discussion
137
home or long-term care facility, received recent intravenous antibiotic therapy,
chemotherapy or wound care within the past 30 days of the current infection, attended
a hospital or hemodialysis clinic, or who had a family member infected with a drug-
resistant pathogen. Patients with HCAP are known to have a worse prognosis, mostly
due to poor functional status and treatment restrictions (39). Moreover, Cecere et al.
(42) described high long-term mortality among patients with HCAP, i.e. even higher
than those patients with CAP. However, HCAP was not assessed as a different entity
in this study and only 6% of the population lived in a nursing home. In addition,
functional status measured by the Katz index was postulated to be a 90-day mortality
predictor after an episode of CAP by Capelastegui et al. (46). However, previous
functional status could not be assessed in the present study.
Patients suffering from dementia usually have problems related to swallowing, which
leads to aspiration. As reported by Lanspa et al. (118), a clinical diagnosis of
aspiration pneumonia is associated with confusion, nursing home residence, and
cerebrovascular disease. However, these authors observed a 2.3 odds ratio for
mortality, after adjusting for age, disease severity, and comorbidities. Nevertheless,
clinician-diagnosed aspiration was assessed in this study and only dementia was
significantly associated with one-year mortality in the multivariate analysis, probably
underlying the poor functional status of these patients. In addition, there is a problem
with definitions in studies assessing aspiration, and it usually becomes difficult to
differentiate aspiration pneumonitis from aspiration pneumonia (119).
The second most powerful predictor of one-year mortality was age ≥80. Sir William
Osler stated that “Pneumonia may well be called the friend of the aged”. However,
doubts have arisen in the last decades about pneumonia being limited to an acute
episode. Several studies have identified increasing age as a risk factor for long-term
mortality after an episode of pneumonia, which is more frequent at the extremes of
life. The impact of an aging population has become a major issue of concern. The
proportion of US elderly patients is expected to increase from 12% in 2000 to almost
20% in 2030. Immunosenescence is a term to describe a series of physiological
changes associated with aging which cause progressive deterioration of the immune
system (120).
LONG‐TERM MORTALITY IN HOSPITALIZED PATIENTS WITH COMMUNITY‐ACQUIRED PNEUMONIA
138
Due to the growing elderly population, the number of patients being admitted to
hospitals has notably increased. In addition, these patients usually have more
comorbidities and a poor functional status. It has been suggested that one out of ten
hospitalized patients with CAP between 60-79 years of age have an increased risk of
mortality. In a recent paper, which CAP patients were compared with a control group,
the lowest absolute rate difference for mortality was observed among patients <25
years old while patients >80 years old had the highest absolute rate difference (29).
However, the starting risk age is controversial, ranging from 50 years proposed by
Hedlund et al. (34) to 70 years proposed by Sligl et al. (36) or 80 proposed in the one-
year CAPSI.
The severity of illness has demonstrated an impact on long-term prognosis. Scores
such as, PSI, CURB65, or SCAP, initially developed for short-term prognosis, have
been also used to assess long-term mortality. All these scores include data from a
physical examination and analytics, with two variables that were also included in the
one-year CAPSI: BUN >30 mg/dL was weighted with 3 points and RR ≥30 breaths/min
with 2 points.
BUN is an important biochemical parameter determined by the complex balance
between urea production, urea metabolism, and urea excretion. In addition, BUN can
be influenced by several renal and non-renal dependent factors such as glomerular
filtration, tubular reabsorbtion of urea, dietary protein intake, parenteral
hyperalimentation therapy, catabolism of endogenous proteins, exogenous
glucocorticoid dependent catabolism, volume status, and upper gastrointestinal
bleeding. BUN levels are well-known to increase with the severity of renal disease.
However, increased levels can be also observed in other illnesses, such as
pneumonia, myocardial infarction, bone marrow transplant, and esophagectomy
(106,121,122,123). Long-term regulation of the urea cycle occurs during adaptation to
chronic increases in enteral or parenteral protein intake or to other protein catabolic
states, such as starvation or critical illness (124). Whether elevated levels of BUN with
normal values of creatinine impact on prognosis have been a matter of concern.
Recently, Beier et al. (44) conducted a multicenter observational study among critically
ill patients with one year follow-up and concluded that elevated levels of BUN are
associated with increased long-term mortality, independent of serum creatinine.
Discussion
139
Few authors have tried to explain the relationship between mortality and high BUN
levels. The neurohumoral response to arterial underfilling may be responsible for this
association. This response involves AVP, the renin-angiotensin-aldosterone system
and the sympathetic nervous system (125). High plasma AVP concentrations can
result in increased urea reabsorption in the collecting duct, resulting in increased BUN
(126). Angiotensin and adrenergic stimulation increase proximal tubular sodium and
water reabsorption, decreasing distal fluid delivery, which increases flow-dependent
urea reabsorption (127). Such arterial underfilling states are common in cardiac failure
and sepsis (128). High BUN levels indicate renal hypoperfusion, and patients with
pneumonia are usually dehydrated resulting from increased levels of BUN excretion
from the kidneys. Elevations in BUN independent of creatinine may impact on
mortality due to the extent of catabolism. Protein catabolism and net negative nitrogen
balance are common features of critical illness, and persistent hypercatabolism in
critical illness results in decreased immune function (129), which could explain higher
long-term mortality. Recently, a new index, named UBMo, was created for in-hospital
and one-year mortality among very elderly patients with CAP, by multiplying the
uremia by the NT-proBNP plasmatic rate, divided by the monocyte count (130).
It may be more difficult to explain how an acute parameter like RR ≥30 breaths/min
was also associated with one-year mortality after a hospitalization for CAP. A high
respiratory rate reflects the severity of disease and has been frequently associated
with a worse short-term prognosis in patients suffering from CAP. Mortensen et al.
(22) assessed long-term mortality among patients enrolled in the PORT cohort after
excluding deaths up to 90 days from CAP presentation. The authors identified that the
PSI risk class was significantly associated with decreased long-term survival in this
cohort with 5.9 years of follow-up. Similarly, Capelastegui et al. (46) showed that the
severity of illness measured by CURB was also associated with 90-day mortality after
an episode of CAP. Both CURB65 and PSI have been recently assessed for long-term
mortality in a six-year follow-up study in patients with CAP (43). Both PSI, which
includes comorbidities, and CURB65 showed excellent predictive accuracy. Actually,
both scores include RR >30 breaths/min; thus, the impact of a high RR may reflect the
impact of severity of illness on long-term prognosis.
Of note, contradictory data have been published concerning the utility of current risk
scores for long-term mortality prediction in CAP. Both PSI and CURB65 have been
LONG‐TERM MORTALITY IN HOSPITALIZED PATIENTS WITH COMMUNITY‐ACQUIRED PNEUMONIA
140
assessed for long-term mortality, PSI showing the best predictive accuracy (36,37,43).
This may be due to the fact that PSI includes comorbidities into the score. However, in
the present study, many comorbidities were assessed, and only CHF and dementia
showed a great influence on mortality. Recently, other scores such as CURB65 and
CRB65 have been compared with the Charlson comorbidity index for one-year
mortality prediction after an episode of CAP (50). All the ROC analysis showed a weak
and comparable performance leading to the idea that these two easy-to-use indices
showed a similar predictive accuracy to a complex comorbidity index. Thus, it seems
that CURB65 could be useful in predicting one-year mortality, despite demonstrating a
lower predictive accuracy.
In the last decade, substantial evidence has accumulated concerning the association
between cardiovascular diseases and pneumonia. Firstly, patients suffering from CAP
present higher rates of cardiac complications during hospitalization for CAP, such as
acute myocardial infarction, heart failure, or arrhythmia (31,131). This idea was
strengthened by Dong et al. (132) in a meta-analysis showing that acute respiratory
infections were associated with a higher rate of acute coronary syndromes. Secondly,
it has been postulated that suffering from pneumonia increases the risk of developing
new-onset heart failure and other cardiovascular diseases in late follow-up (53).
Thirdly, patients with CAP that suffer intra-hospital cardiac complications have greater
long-term mortality (54).
CHF is included in the one-year CAPSI, and actually has a considerable impact on
long-term mortality. Pneumonia leads to an inflammatory storm and factors such as
systemic inflammation, coronary artery inflammation, platelet activation and
thrombosis, endothelial dysfunction, and the effects of CAP on the heart have been
suggested as possible mechanisms for increased cardiovascular events following
respiratory infections (133). Thus, pneumonia may reflect an acute state of
inflammation while CHF leads to chronic inflammation. Hence, pneumonia may lead to
chronic state of inflammation, triggering the onset of new cardiovascular events or an
impairment of a previously present inflammatory state.
Cardiovascular diseases have been suggested as causes of long-term mortality after
an episode of CAP (30). In fact, cardiovascular events have been postulated to
contribute to more than 30% of deaths in long-term follow-up in patients with CAP
Discussion
141
(31). More recently, Adamuz et al. (32) determined the causes of death of 1,284
patients discharged after an episode of CAP and observed that infectious diseases
were the main reason for one-year mortality, followed by acute cardiovascular events.
Moreover, mortality from infectious diseases was higher during the first six months
and decreased progressively after that point while cardiovascular causes were stable
throughout the follow-up period, which reinforces the idea of chronic persistent
inflammation after an episode of CAP. Unfortunately, causes of death could not be
obtained in the present study.
Identifying the best prognostic index in any disease is difficult. A good prognostic
score should be easily performed in clinical practice. In this sense, it should be taken
into account that one-year CAPSI is an easy-to-use index specifically developed to
predict one-year mortality among patients admitted for CAP and is based on five easy
to remember variables, while PSI is a laborious index, which requires a complex
computer program in order to be implemented.
Specific issues should be discussed from the univariate analysis. Not only previously
mentioned variables, but also cancer, CVD, confusion, a low hematocrit, a low pO2,
and the use of corticosteroids were significantly associated with one-year mortality in
the univariate analysis. Cancer is a clear variable that could impact on mortality. In
fact, it has been recently demonstrated that ≤10% of patients hospitalized with CAP
are diagnosed with either a primary lung cancer or pulmonary metastasis within
several years of admission (134). It should be emphasized that immunosuppressed
patients were excluded from the present study and only those with a history of cancer
were taken into account. In addition, around 5% of the population had a history of
cancer, while more than 10% had a history of cancer in Louisville cohort, as will be
discussed later on. Several parameters from the physical examination and analytics
have been postulated as risk factors for mortality. It should be mentioned that
confusion and dementia are different parameters, the first being of new onset and the
latter a chronic cognitive impairment. Low hematocrit has already been described as a
risk factor for long-term mortality by Brancati et al. (35) and more recently by Waterer
et al. (49). A low hematocrit or albumin usually reflects a poor nutritional status, which
could actually mask other diseases.
LONG‐TERM MORTALITY IN HOSPITALIZED PATIENTS WITH COMMUNITY‐ACQUIRED PNEUMONIA
142
Another interesting point is the effect of corticosteroids on CAP. The impact of
corticosteroids on pneumonia prognosis is controversial. Since it was first suggested
in the TORCH study, a higher incidence of pneumonia among patients on inhaled
corticosteroids has been published many papers, mostly focusing on short-term
prognosis. Recently, in a meta-analysis published in 2015 among hospitalized adults
with CAP, systemic corticosteroid therapy turned out to may reduce mortality by
approximately 3% and the need for mechanical ventilation by approximately 5% (135).
In the present study, non-survivors received corticosteroids more frequently during
hospitalization (p=0.06). However, this association did not achieve statistical
significance.
Finally, it should be highlighted that TRIPOD statements were used for transparent
reporting of the prediction model (105). The score has shown good statistical
properties in terms of discrimination, calibration and internal validation Discrimination
was measured by the C-index, resulting in 0.75 and 0.72 in the derivation and
validation cohorts, respectively, for the one-year CAPSI risk score. Calibration was
measured by the GND calibration test for the survival model, and was 0.98 for the
derivation cohort and 0.93 for the validation cohort for the one-year CAPSI risk score.
Discussion
143
7.2.2. STUDY II: In recent decades, increasing interest has emerged concerning biomarkers. In this sense, this study demonstrates that proADM is associated with the severity of disease measured by severity scores. Hence, patients with more severe disease at diagnosis present higher levels of proADM. After the exclusion of deaths within 15 days, only 24 patients died within one year. Biomarkers showed poor predictive accuracy for one-year mortality and were not able to improve the prediction ability of risk scores for one-year mortality when added to the scores. In a subanalysis carried out including all deaths up to one year, proADM showed the best predictive ability for one-year mortality and, when added to the one-year CAPSI, the prediction ability of the score was significantly improved.
On the other hand, a decrease in proADM from the first 24 hours to 3-5 days, adjusted by proADM value at baseline, was associated with a significantly reduced risk of death at one year. However, once it was adjusted by severity of disease and proADM baseline value, only when all deaths within one year were analyzed was associated with a significantly reduced risk of death at one year, meaning that, based on our sample, its predictive ability is mainly for short-term mortality.
Current risk scores have demonstrated utility for the management of CAP; however,
they have several limitations. Firstly, they are vulnerable to bias as they are
dependent on differences in terms of the definition of variables. Secondly, they have
shown poor predictive accuracy in predicting patients at high risk of dying; hence, they
have a high negative predictive value and a low positive predictive value. Thirdly,
different scores have used different endpoints like 30-day mortality or ICU admission.
Fourthly, scores do not work as well in elderly people. For example, PSI clearly
overestimates age, with older people obtaining higher scores while young people are
underestimated. Due to the limitations of risk scores, a more accurate approach has
been encouraged in order to identify worse outcomes in CAP. In this sense, multiple
biomarkers have been studied with good results in the short- and long-term.
Considerable efforts have been undertaken in order to assess biomarkers alone or
included in current scores. All the scores measure the effect of infection in the host at
LONG‐TERM MORTALITY IN HOSPITALIZED PATIENTS WITH COMMUNITY‐ACQUIRED PNEUMONIA
144
the time of diagnosis, but not the inflammatory response mechanisms to the injury,
which is undoubtedly crucial to the outcome. The routine use of these biomarkers still
remains challenging, probably due to the high cost.
Biomarkers have been assessed for different utilities, such as the severity of disease,
etiology, or duration of antibiotic treatment. CRP is a biomarker that has shown benefit
in the diagnosis of acute inflammatory responses, including viral and bacterial
infections, while PCT is a sensitive and specific marker for the diagnosis of systemic
bacterial infection (136). Both biomarkers have demonstrated established evidence in
terms of identifying low risk patients, which allow clinicians to send patients home
safely. Moreover, increasing interest has emerged concerning the duration of antibiotic
treatment (137). A clinical trial carried out by a Swiss group showed that the duration
of antibiotic treatment could be safely reduced from 12 days to 5 days using a PCT-
guided protocol (74). However, a more recent clinical trial has suggested that
treatment reduction could be safely implemented based only on clinical stability criteria
(138). Menendez et al. (139) suggested that clinical stability is usually achieved by day
three, hence, taking into account IDSA/ATS guidelines, antibiotic treatment could be
limited to five days in most patients.
Recently, new cardiovascular biomarkers have been developed with promising results.
ProADM is the most stable fragment of adrenomedullin degradation. The importance
of this biomarker is mostly focused on its activity as a potent vasodilator and the
immunomodulatory regulation of inflammatory processes. It has been promoted as a
prognostic biomarker in sepsis as well as a useful marker for risk stratification in
patients with CAP (140). However, in terms of discriminating etiology, it has been
described as a weak biomarker (73).
In a prospective observational study conducted among 228 patients with CAP, the
authors found significantly higher levels of proADM, PCT and CRP as well as higher
PSI and CURB65 scores in patients with complications during hospitalization (73). The
CAPNETZ group assessed new biomarkers, not only for short-term mortality, but also
for 180-day mortality; the authors concluded that proADM was the best predictor of
both short- and long-term mortality (71). Bello et al. (73) assessed different biomarkers
and showed that proADM was the only one able to distinguish between survivors and
non-survivors at one year after an episode of CAP. Of note, the authors did not
Discussion
145
exclude in-hospital mortality from analysis, which actually could have had a significant
influence on the results.
In our study, three different biomarkers were assessed for one-year mortality, and only
proADM showed significantly higher levels among more severe patients, as measured
by different risk scores. Surprisingly, patients with higher scores on the one-year
CAPSI showed lower levels of CRP, which would support the previously published
idea of CRP high levels being protective against complications in patients with CAP
(96).
All biomarkers failed to predict one-year mortality. However, it should be taken into
account that deaths up to 15 days from diagnosis were excluded; thus, only 24
patients died within one year. Due to the small sample size after the exclusion of
deaths within 15 days, a subanalysis was carried out including all deaths up to one
year; proADM showed a high predictive ability for one-year mortality. Deaths around
the acute episode of CAP could have a great influence when assessing long-term
mortality and, ideally, should be excluded from the analysis. However, in this study,
proADM was a good predictor of one-year mortality only once all deaths were
included. In this sense, future research should focus on obtaining a larger sample size
for the study of biomarkers and long-term mortality prediction after a CAP episode,
excluding short-term mortality.
Another matter of concern is how much a biomarker could improve the mortality
prediction ability of a risk score. España et al. (141) measured proADM levels on
admission in a prospective cohort of 491 patients with CAP and observed a significant
correlation with severity scores and an improvement in the predictive ability for
adverse events when the biomarker was added to the severity score, thus providing
an additional margin of safety. In another study carried out among an already well-
characterized cohort of patients with CAP from the ProHOSP study, which was first
developed to assess antibiotic stewardship, patients were prospectively followed for
six years (74). The authors observed a high mortality rate of almost 50% after
hospitalization. More interestingly, they described a high predictive accuracy of risk
scores, which was actually improved when biomarkers were added.
In our study, the addition of biomarkers failed to improve the predictive accuracy of the
scores for mortality. As previously explained, in the subanalysis carried out including
LONG‐TERM MORTALITY IN HOSPITALIZED PATIENTS WITH COMMUNITY‐ACQUIRED PNEUMONIA
146
all deaths up to one year, proADM significantly improved the predictive accuracy of
one-year CAPSI and CURB65. It would be of great interest to assess this in a bigger
cohort, i.e. whether proADM improves the prediction ability of risk scores.
Serial biomarker levels have been assessed by different authors with different aims. A
PCT-guided protocol with serial PCT measures carried out in a clinical trial could
safely reduce the duration of antibiotic treatment from 12 days to 5 days (84). In our
study, the main outcome was one-year mortality, and we strongly believe that
inflammation and cardiovascular diseases are related to the increased long-term
mortality that patients suffer after an episode of CAP. Hence, we decided to assess
serial proADM levels in relation to one-year mortality due to its activity as a potent
vasodilator and immunomodulatory regulator of inflammatory processes. Measuring
serial proADM levels at follow-up after an episode of CAP could support the
hypotheses of chronic persistent inflammation.
In the present study, we could not obtain blood samples at late follow-up, but we were
able to obtain biomarkers at 3-5 days after diagnosis. In order to assess the impact of
serial biomarker levels on one-year mortality, the proADM changes was estimated by
subtracting the proADM value at 3-5 days from the proADM value at the time of
diagnosis. ProADM changes failed to significantly predict mortality when deaths within
first 15 days were excluded but not when all deaths up to one year were included.
Moreover, when patients who died between 15 days and up to one year were
excluded, decreases in proADM values were associated with significantly decreased
one-year mortality, leading to the idea that, at least in this sample, proADM is related
to short-term mortality.
Later on, proADM changes were estimated after adjustment by severity scores and,
similarly, proADM changes failed to be protective of one-year mortality. However,
when the same analysis was conducted including all deaths up to one year, for each
0.1 nmol/L decrease in proADM, a decrease of 9% in one-year mortality was
observed, adjusted by one-year CAPSI. Hence, the greater the reduction in biomarker
levels over time, the greater the reduction in one-year mortality. Further analysis
excluding those patients who died after 15 days and up to one year showed that
decreases in proADM failed to be protective, again leading to the idea that, at least in
this sample, proADM is related to short-term mortality. It is of special interest to
Discussion
147
measure biomarker levels at admission as well as at follow-up in order to know
whether the absence of a decrease is related not only with to increased mortality rate
but also to an increased rate of cardiovascular events.
Despite the limitations of the current study results, it seems clear that proADM showed
a correlation with the severity of disease. ProADM has been widely studied for long-
term mortality, probably due to its cardiovascular effect. As previously mentioned,
patients suffering from CAP have a greater probability of suffering from cardiovascular
events in the follow-up; moreover, these cardiovascular events seem to be related to
the increased mortality rates that these patients suffer at late follow-up. Chronic
persistent inflammation could be the underlying issue.
LONG‐TERM MORTALITY IN HOSPITALIZED PATIENTS WITH COMMUNITY‐ACQUIRED PNEUMONIA
148
7.2.3. STUDY III: Long-term mortality was assessed in an external cohort at the Veterans Affairs Medical Center of Louisville, Kentucky. Patients from this study differed from the patients in study I in terms of sociodemographics and comorbidities. Hence, the one-year CAPSI failed to properly validate previous results when applied to this sample. Thus, a specific cohort with different variables from one-year CAPSI was developed for one-year mortality with a high predictive accuracy and based on age ≥75 years, cancer, CHF, dementia, albumin <3.5mg/dL and platelets <100,000 109/L or >400,000 109/L. However, it seems that predicting mortality on a longer time prediction model is more difficult. In fact, the same score was tested for five-year mortality with a decrease in predictive ability. Another specific score was developed for five-year mortality but the predictive accuracy was not as high as expected.
In an attempt to assess mortality in an external cohort, 455 patients from the Veterans
Affairs Medical Center of Louisville, Kentucky were analyzed. This is a particular
cohort including American military veterans. Thus, all patients were male, 70% of
patients were hypertensive, and almost half of the cohort were current smokers and
suffered from COPD. Despite excluding mortality within 15 days from diagnosis, the
one-year mortality rate was as twice high as the one observed in our cohort. One-year
CAPSI was applied to this sample and it failed to properly validate the previous
results, due to the differences in the sociodemographic and clinical characteristics
between both cohorts. Hence, a specific prediction score was developed for one-year
mortality.
Under these circumstances, a weighted prediction score was developed based on age
≥75 years, cancer, CHF, dementia, albumin <3.5 and platelets <100,000 or >400,000.
Similarly to our cohort, age, CHF, and dementia were included in the score. Moreover,
dementia was the second most important variable with 4 points. The most powerful
variable was cancer, weighted with 7 points. Although immunosuppressed patients
were excluded, still, 12.75% of the cohort had suffered from cancer, while only 5.53%
of patients from the Galdakao-Usansolo Hospital had cancer. In addition, low albumin
and platelet levels have been related to a poor nutritional status, which actually had a
considerable impact on mortality, as previously explained. However, in the Galdakao-
Discussion
149
Usansolo Hospital cohort, with a long inclusion period, neither albumin nor platelets
could be obtained during the study; thus, these parameters could not be analyzed.
The one-year prediction score showed acceptable prediction accuracy. Nevertheless,
when the same score was used to assess five-year mortality, accuracy declined.
Five-year mortality was 58% (265 deaths) and a specific prediction score was
developed including age, BMI <21, nursing home residence, aspiration, cancer, CHF,
and platelets <100x109/L or >400x109/L; however, a worse predictive accuracy was
shown (AUC 0.69). As explained before, patients with BMI <21, nursing home
residence, and aspiration are usually included in HCAP, which had already been
suggested as a poor prognosis.
Therefore, it seems that predicting one-year mortality is more feasible than predicting
five-year mortality. In this sense, biomarkers could actually become crucial. The
addition of cardiovascular biomarkers such as proADM to risk scores has been
postulated to improve the predictive accuracy for short- and long-term mortality. On
the other hand, it should be taken into account that whenever a score is validated in
an external sample, patient similarities in terms of sociodemographics and
comorbidities should be tested first. In this study, the sample characteristics differ
greatly from those of the first study sample; hence, a specific score was developed for
this specific sample.
On the other hand, several issues concerning methodology used for the study carried
out in the Veterans Affairs Medical Center of Louisville, Kentucky should be
highlighted. Instead of choosing variables significantly related to one-year mortality, an
“automatic selection” regression model was used. In order to assess the best fit of the
regression model compared to models with different variables, a genetic algorithm
was used to identify a best-fit model somewhat automatically using the AIC. This
algorithm creates thousands of different regression models, logistic regression in this
case, and assesses the model fit based on AIC. This is called an optimization
algorithm because it optimizes the model fit given thousands and thousands of
different potential variable combinations. When the fit no longer improves by changing
the variables around, the algorithm stops and the best model is shown. The genetic
algorithm lets us automate much of this process by looking at thousands of models
with different variables included and evaluating the AIC of each and comparing them
LONG‐TERM MORTALITY IN HOSPITALIZED PATIENTS WITH COMMUNITY‐ACQUIRED PNEUMONIA
150
until it finds an optimum set of variables that minimizes the AIC. This model is then
used to weight the variables and create the score.
A key point of this methodology is the fact that the variables included in the score were
not necessarily independently associated with the outcome at the p-value cutoff of
0.05. The important thing to consider here is that the objective was not to identify
independent predictors of long-term mortality in hospitalized patients with CAP.
Indeed, we tried to identify a model that fit the data the best in order to create a
composite score that could be able to discriminate between patients who died and
those who did not die at one and five years. The fact that some variables were not
independently associated with the outcome is not relevant in this situation, as they are
to be combined at the end into one variable that then independently predicts the
outcome.
Discussion
151
7.3 Strengths and limitations This study has several strengths. The first one is the large sample size of the
Galdakao-Usansolo Hospital prospective cohort. More than 2,000 patients with CAP
were assessed during hospitalization. In addition, vital status could be obtained from
all of them. Deaths within 15 days from diagnosis were excluded in order to avoid the
impact an acute episode could have on mortality.
Another strength is that the one-year CAPSI is an easy-to-use score that can
accurately predict one-year mortality. Compared to the PSI score, which is complex
and difficult to implement in daily clinical practice, the one-year CAPSI includes five
easy to determine variables that can easily identify patients at a high risk of death.
Furthermore, biomarkers could be assessed, showing a clear correlation with the
severity of disease. Biomarker levels could be also assessed at follow-up, which
provides a new perspective on the utility of biomarkers. Moreover, a key point of this
study is that long-term mortality could be assessed in an external cohort of
hospitalized patients with CAP, which strengthens the quality of the scientific research.
This study has also several limitations. Firstly, causes of death could not be obtained
in any case, which could have added important information. Secondly, several
variables such as tobacco use, albumin, or platelets could not be assessed at the
Galdakao-Usansolo Hospital cohort due to missing data. Thirdly, the sample size was
notably reduced once deaths within 15 days of diagnosis were excluded, which had a
considerable impact, especially in the cohort of section II when biomarkers were
analyzed. Hence, due to the small sample size, these data should be cautiously
interpreted. Fourthly, when assessing an external cohort, the peculiarities of patients
from the Veterans Affairs Medical Center of Louisville, Kentucky limited the results.
Fifthly, the study design was retrospective in study III, which could add a limitation.
Finally, immunosuppressed patients, those infected by the human immunodeficiency
virus, as well as those who had been discharged from an acute care hospital, an
onsite subacute care unit, or a palliative care unit within the previous 14 days were
excluded from this study. Thus, the data cannot be extrapolated to these patients.
LONG‐TERM MORTALITY IN HOSPITALIZED PATIENTS WITH COMMUNITY‐ACQUIRED PNEUMONIA
152
7.4 Potential clinical use and future research The impact of an aging population has become a major issue of concern. Future
research in the area of inflammation is needed. Indeed, inflammation among elderly
people should be assessed independently as it probably has a distinctive role. In
addition, it seems that persistent chronic inflammation after an episode of CAP could
lead to higher long-term mortality rates. Future research should include an
assessment of cardiovascular events after hospitalization for CAP, not only at short-
term follow-up, but also at long-term. In this sense, it would be of special interest to
evaluate in a larger cohort cardiovascular biomarkers levels in the follow-up after
hospitalization with CAP in order to demonstrate if patients with less significant
decreases over time have higher mortality rates. This would support the idea that
persistently elevated levels of biomarkers are associated with an increased risk of
cardiovascular events. Moreover, this inflammation could lead to endothelial
dysfunction or to a prothrombotic state and, consequently, to a higher rate of
cardiovascular events. Indeed, cardiovascular diseases have been postulated as
possibly causative of increased mortality in these patients.
This inflammatory storm could lead to the development of new cardiovascular
diseases as well as to already established but undiagnosed cardiovascular diseases.
Therefore, close monitoring should be encouraged among these patients at high risk
of death in order to make an early diagnosis and for the treatment optimization of
comorbidities. Additionally, future research should address whether treatment with
specific drugs to overcome inflammation favorably impacts long-term mortality.
In conclusion, CAP is an important problem with high morbidity and mortality. In
addition, an easy-to use score based on age ≥80, CHF, dementia, BUN >30 mg/dL,
and a respiratory rate ≥30 breaths/min can predict one-year mortality with a high
predictive accuracy, better than widely known severity scores. Future research should
be conducted to clarify the impact of inflammation on CAP prognosis.
153
8. CONCLUSIONS
Conclusions
155
STUDY I. One-year mortality prediction among hospitalized patients with CAP in Galdakao-Usansolo Hospital.
1. In this study, 2,351 patients were evaluated to identify one-year mortality predictors,
with 250 (10.63%) patients dying within one year. Several variables were identified as
predictors of one-year mortality, but five of them could be combined in a single model
consisting of age ≥80, CHF, dementia, BUN >30 mg/dL, and a respiratory rate ≥30
breaths/min. Dementia and age ≥80 were the most powerful variables weighted with 6
and 4 points, respectively. BUN >30 mg/dL was weighted with 3 points while CHF and
a respiratory rate ≥30 breaths/min were both weighted with 2 points. Recognizing
these five variables may be useful for identifying patients with a high probability of
dying after an episode of CAP.
2. With these five weighted variables, a new score called the one-year CAPSI was
developed to predict one-year mortality among hospitalized patients with CAP. The
score showed good statistical properties in terms of discrimination, calibration, and
internal validation. Considering one-year CAPSI as a continuous variable, the C-index
was 0.76 in the derivation cohort and 0.77 in the validation cohort. In addition, the
GND calibration test for the one-year CAPSI was 0.03 for the derivation cohort and
0.23 for the validation cohort.
The previous continuous score was categorized into three risk groups, i.e. minor,
moderate, and severe, and was called the one-year CAPSI risk score. This risk score
had a C-index of 0.72 and 0.70 in the derivation and validation cohorts, respectively.
The GND calibration test for the one-year CAPSI was 0.98 for the derivation cohort
and 0.93 for the validation cohort.
For a cut-off point of four on the one-year CAPSI, the results of the statistical
measures of performance were: sensitivity 81.40%, specificity 64.47%, PPV 21.56%,
and NPV 96.65%, with an accuracy of 66.28% for the derivation cohort. In the
validation cohort, sensitivity was 75.63%, specificity 65.09%, PPV 20.27%, and NPV
95.79%, with an accuracy of 66.20%.
LONG‐TERM MORTALITY IN HOSPITALIZED PATIENTS WITH COMMUNITY‐ACQUIRED PNEUMONIA
156
3. The one-year CAPSI showed a higher predictive ability than CURB65 and SCAP. In
the derivation cohort, the C-index for the one-year CAPSI was 0.76 while for PSI it
was 0.73, for CURB65 0.69, and for SCAP 0.70. In the validation cohort, the C-index
for the one-year CAPSI was 0.77, while the C-index for PSI was 0.75, for CURB65
0.71, and for SCAP 0.70. Hence, the one-year CAPSI appears to be more useful than
current risk scores for the prediction of one-year mortality after a hospitalization for
CAP.
STUDY II. Role of biomarkers in one-year mortality prediction among hospitalized patients with CAP in Galdakao-Usansolo Hospital.
1. In this second study, risk scores as well as three biomarkers were assessed for
one-year mortality, including CRP, PCT, and proADM. ProADM was the only
biomarker with significantly higher levels at admission among more severe patients,
while lower levels of CRP were observed among more severe patients measured by
the one-year CAPSI. In addition, risk scores showed a high predictive accuracy for
one-year mortality. However, biomarkers failed to predict one-year mortality when
excluding deaths within 15 days from admission, with a C-index for proADM of 0.64.
Once all deaths within one year were included in the analysis, proADM showed a high
predictive accuracy for one-year mortality with a C-index of 0.71; based on our
sample, its predictive ability is mainly for short-term mortality.
2. Risk scores were able to predict one-year mortality, but not biomarkers. However,
as proADM was the only biomarker correlated with the severity of disease, it was
added to the current risk scores. ProADM failed to improve the prediction ability of
these scores when excluding deaths within 15 days. Once all deaths within one year
were included in the analysis, the addition of proADM significantly improved the
prediction ability for one-year mortality of CURB65 and one-year CAPSI.
Conclusions
157
3. When we assessed the role of changes in proADM values from admission to 3-5
days, adjusted by proADM basal values and the risk scores, proADM changes predict
one-year mortality; though mainly explain by short-term mortality (<=15 days).
Additionally, when proADM changes were adjusted by the one-year CAPSI, a
decrease of 0.1 nmol/L in proADM from admission to 3-5 days was associated with a
9% decrease in one-year mortality. Limited sample size and the distribution of the
outcome may have influenced the results.
STUDY III. One-year mortality prediction among hospitalized patients with CAP in the Veterans Affairs Medical Center of Louisville, Kentucky.
1. Patients hospitalized for CAP at the Veterans Affairs Medical Center of Louisville,
Kentucky differed from patients hospitalized for CAP at the Galdakao-Usansolo
Hospital, in terms of sociodemographics and comorbidities. In addition, when the one-
year CAPSI was applied to this sample, it failed to properly validate the previous
results, due to the differences in the sociodemographic and clinical characteristics of
the two cohorts.
2. Taking into account the specific peculiarities of the sample from the Veterans Affairs
Medical Center of Louisville, Kentucky, a specific score was developed by a genetic
algorithm for one-year mortality. The final multivariate score included age ≥75 years
weighted with 2 points, cancer with 7 points, CHF with 1 point, dementia with 4 points,
albumin <3.5mg/dL with 2 points, and platelets <100,000 109/L or >400,000 109/L with
2 points, with an AUC of 0.77. The same score was tested for five-year mortality with a
poorer predictive accuracy (AUC 0.70). Thus, predicting long-term mortality after an
episode of CAP remains challenging.
LONG‐TERM MORTALITY IN HOSPITALIZED PATIENTS WITH COMMUNITY‐ACQUIRED PNEUMONIA
158
159
9. REFERENCES
References
161
1. Rozman C (2004). Infecciones del aparato respiratorio. Farreras; Medicina interna.
(p795). Madrid: Elsevier.
2. Álvarez CJ. Neumonías: concepto, clasificación y diagnóstico diferencial.
Monografías neumomadrid. Neumonías. 2005. p9-14.
3. American Thoracic S, Infectious Diseases Society of A. Guidelines for the
management of adults with hospital-acquired, ventilator-associated, and healthcare-
associated pneumonia. American journal of respiratory and critical care medicine.
2005;171(4):388-416.
4. Shindo Y, Ito R, Kobayashi D, Ando M, Ichikawa M, Shiraki A, et al. Risk factors for
drug-resistant pathogens in community-acquired and healthcare-associated
pneumonia. American journal of respiratory and critical care medicine.
2013;188(8):985-95.
5. Singer M, Deutschman CS, Seymour CW, Shankar-Hari M, Annane D, Bauer M, et
al. The Third International Consensus Definitions for Sepsis and Septic Shock
(Sepsis-3). Jama. 2016;315(8):801-10.
6. Restrepo MI, Faverio P, Anzueto A. Long-term prognosis in community-acquired
pneumonia. Current opinion in infectious diseases. 2013;26(2):151-8.
7. Almirall J, Bolibar I, Vidal J, Sauca G, Coll P, Niklasson B, et al. Epidemiology of
community-acquired pneumonia in adults: a population-based study. The European
respiratory journal. 2000;15(4):757-63.
8. Welte T, Torres A, Nathwani D. Clinical and economic burden of community-
acquired pneumonia among adults in Europe. Thorax 2012;67(1):71-79.