a b 15 November 2018 Municipal Market Guide Chief Investment Office Global Wealth Management Pension risk persists New issue supply to move higher Tax loss harvest- ing opportunities remain Looking ahead to 2019 This report has been prepared by UBS Financial Services Inc. (UBS FS). Analyst certification and required disclosures begin on pg. 19.
Transcript
ab
15 November 2018
Municipal Market GuideChief Investment Office Global Wealth Management
� Pension risk persists
� New issue supply to move higher
� Tax loss harvest-ing opportunities remain
Looking ahead to 2019
This report has been prepared by UBS Financial Services Inc. (UBS FS). Analyst certification and required disclosures begin on pg. 19.
DESKTOP PUBLISHINGCognizant Group – Srinivas Addugula, Sunil Vedangi
Cover photo: istock.com
At a glanceRising interest rates and a diminishing supply of new bond issues were the two principal themes driving municipal bond performance in calendar year 2018. Scant supply usually heralds better performance for existing portfolios but the abrupt increase in yields undermined the market’s technical strength, leading to negative total returns through October. Credit spreads, meanwhile, remained relatively narrow as investors sought shelter from the prospect of higher state and local taxes.
As we look ahead to 2019, we anticipate new challenges. The number of municipal bond dealers has declined in the past decade. Those who remain generally retain lower inventories. These ominous trends, combined with diminished interest in tax exempt paper from institutional investors, has led to greater reliance on retail buyers for market liquidity. As we have often opined, the municipal market is characterized by regular cycles in which three years of tranquility is interrupted by three months of turmoil. A sudden increase in yields in 2010 and 2013 unnerved private
clients and led to extended outflows from open-end mutual funds. A similar pattern emerged in the latter half of 2016 but the impact was more muted than anticipated.
We expect new issue supply to improve in 2019 as states and local governments take advantage of new bond authorizations and contemplate the refinancing of outstanding Build America Bonds. Yields are expected to rise, albeit slowly, as the Fed reduces the size of its balance sheet. Concerns over the burden posed by pension liabilities and other post-employment benefits will receive more media attention.
Taken together, we would not be surprised to see another brief period where sustained fund outflows temporarily undermine retail confidence in the muni market. Careful credit selection will remain a vitally important tool to endure these temporary periods of reduced liquidity. We believe investors are well-advised to review their positions and express a preference for higher quality credits.
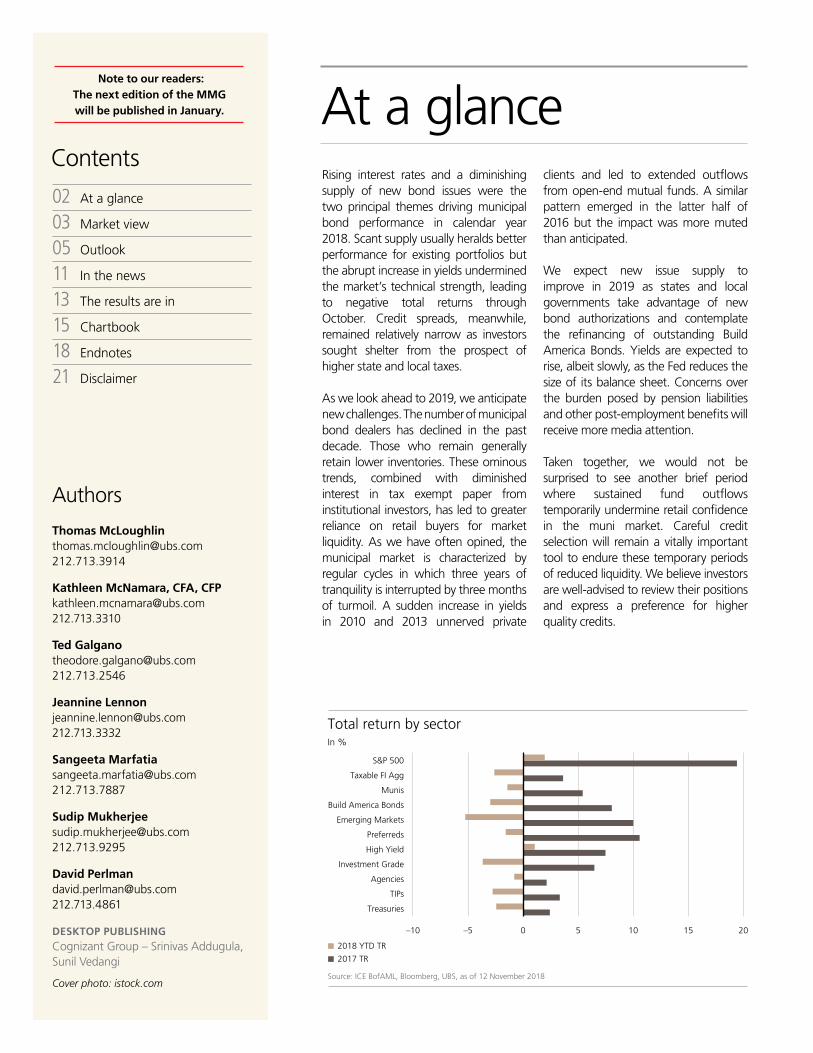
Total return by sector
Source: ICE BofAML, Bloomberg, UBS, as of 12 November 2018
2018 YTD TR
2017 TR
In %
Treasuries
Taxable FI Agg
Munis
Build America Bonds
Emerging Markets
Preferreds
High Yield
Investment Grade
Agencies
TIPs
S&P 500
0 5 10 15–10 –5 20
02 At a glance
03 Market view
05 Outlook
11 In the news
13 The results are in
15 Chartbook
18 Endnotes
21 Disclaimer
Contents
Note to our readers: The next edition of the MMG will be published in January.
Source: Investment Company Institute, MMD, UBS, as of 9 November 2018
Monthly Net New Cash Flow
Figure 1
Fund flows in USD millions (lhs), yields in % (rhs)
AAA GO 30yr Monthly Yields
On firmer footingFollowing a period of soft total return performance from munis in October (-0.7%), tax-exempt paper is showing some signs of stabilizing. On a month-to-date basis through 14 November 2018, munis have registered some better results (+0.2%) taking their cues from a firmer US Treasury bond market. Over the past week, the yield on the 10-year government benchmark note declined by 12 basis points (bps) to now rest at 3.11% from 3.23% on 8 November. At the same time, the AAA 10-year muni yield drifted lower by about 3bps to sit at 2.7%.
Not surprisingly, in the early part of November, outflows from municipal bond mutual funds continued. There is often a lag between when bond yields stabilize and muni mutual fund out-flows subside. We expect the current investor demand pattern to prove no exception. For the week ending 7 November 2018, the Investment Company Institute reported a net cash outflow from muni funds of USD 902mn. This follows a large outflow of USD 4.5bn witnessed in October as shown in Figure 1.
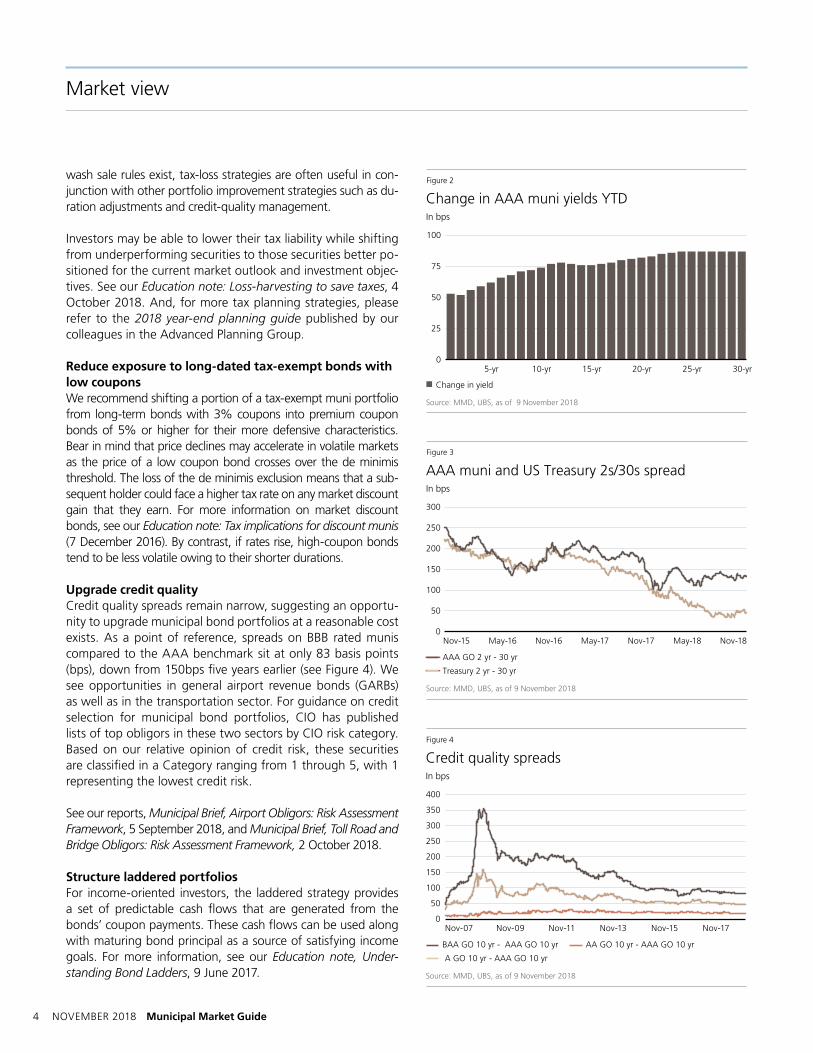
Muni curve steepens year-to-date On a year-to-date basis, the muni curve steepened as long-rates increased at a faster pace than levels at the front part of the muni curve (see Figure 2). As a point of reference, yields on AAA bonds with 20- to 30-year maturity terms climbed by over 75bps. Meanwhile, the yield increase witnessed on 1-to-3-year bonds occurred at less magnitude (about 50bps). This yield movement had the effect of steepening the muni curve to now sit at about 131bps. By contrast, the US Treasury curve continued to flatten falling to now only rest at about 50bps (see Figure 3). We continue to believe that the steeper munici-
pal yield curve vs. the one seen in the government bond mar-ket presents an opportunity to pick up values a bit further out on the curve (10-year to 15-year maturity area). We expect to witness acceleration in tax-loss selling as year-end approaches.
We expect to witness acceleration in tax loss sell-ing as year-end approaches. Investors may be able to lower their tax liability while shifting from underperforming securities to those securities better positioned for the current market outlook and investment objectives.
Year-end portfolio strategies
Consider harvesting losses to save taxesThus far in 2018, an index of investment-grade munis is down by about 1.2% and 4.8% on a total return and price return basis, respectively. This suggests that some individual bonds are now likely posting unrealized losses. Long-dated munis have witnessed the largest declines on a price return basis, falling as much as 6% through 14 November 2018.
Current US tax laws allow realized losses to offset recognized gains in other investments. By realizing (harvesting) a capital loss to offset taxable capital gains, reported investment gains and tax liabilities decrease. Thus, Internal Revenue Service regulations may have the effect of granting losses of noteworthy value to an investor, because these losses can be used to defer taxes. While
4 NOVEMBER 2018 Municipal Market Guide
wash sale rules exist, tax-loss strategies are often useful in con-junction with other portfolio improvement strategies such as du-ration adjustments and credit-quality management.
Investors may be able to lower their tax liability while shifting from underperforming securities to those securities better po-sitioned for the current market outlook and investment objec-tives. See our Education note: Loss-harvesting to save taxes, 4 October 2018. And, for more tax planning strategies, please refer to the 2018 year-end planning guide published by our colleagues in the Advanced Planning Group.
Reduce exposure to long-dated tax-exempt bonds with low couponsWe recommend shifting a portion of a tax-exempt muni portfolio from long-term bonds with 3% coupons into premium coupon bonds of 5% or higher for their more defensive characteristics. Bear in mind that price declines may accelerate in volatile markets as the price of a low coupon bond crosses over the de minimis threshold. The loss of the de minimis exclusion means that a sub-sequent holder could face a higher tax rate on any market discount gain that they earn. For more information on market discount bonds, see our Education note: Tax implications for discount munis (7 December 2016). By contrast, if rates rise, high-coupon bonds tend to be less volatile owing to their shorter durations.
Upgrade credit quality Credit quality spreads remain narrow, suggesting an opportu-nity to upgrade municipal bond portfolios at a reasonable cost exists. As a point of reference, spreads on BBB rated munis compared to the AAA benchmark sit at only 83 basis points (bps), down from 150bps five years earlier (see Figure 4). We see opportunities in general airport revenue bonds (GARBs) as well as in the transportation sector. For guidance on credit selection for municipal bond portfolios, CIO has published lists of top obligors in these two sectors by CIO risk category. Based on our relative opinion of credit risk, these securities are classified in a Category ranging from 1 through 5, with 1 representing the lowest credit risk.
See our reports, Municipal Brief, Airport Obligors: Risk Assessment Framework, 5 September 2018, and Municipal Brief, Toll Road and Bridge Obligors: Risk Assessment Framework, 2 October 2018.
Structure laddered portfolios For income-oriented investors, the laddered strategy provides a set of predictable cash flows that are generated from the bonds’ coupon payments. These cash flows can be used along with maturing bond principal as a source of satisfying income goals. For more information, see our Education note, Under-standing Bond Ladders, 9 June 2017.
Market view
100
75
0
25
50
Change in AAA muni yields YTD
Source: MMD, UBS, as of 9 November 2018
Change in yield
Figure 2
In bps
5-yr 10-yr 15-yr 20-yr 25-yr 30-yr
Nov-18Nov-15 May-16 Nov-16 May-17 May-18Nov-17
300
250
200
150
100
50
0
AAA muni and US Treasury 2s/30s spread
Source: MMD, UBS, as of 9 November 2018
Figure 3
AAA GO 2 yr - 30 yr
Treasury 2 yr - 30 yr
In bps
Nov-07 Nov-15Nov-13Nov-11Nov-09 Nov-17
400
350
300
250
200
150
100
50
0
Credit quality spreads
Source: MMD, UBS, as of 9 November 2018
Figure 4
BAA GO 10 yr - AAA GO 10 yr AA GO 10 yr - AAA GO 10 yr
A GO 10 yr - AAA GO 10 yr
In bps
Municipal Market Guide NOVEMBER 2018 5
OutlookEach year, in lieu of a more traditional Spotlight article, we devote some space in the November edition of the Municipal Market Guide to the outlook for the muni market. This year, we will continue to witness shifting supply/demand dynamics within the muni market following tax reform. At the same time, we expect the Fed to resume hiking rates at a measured pace. In credit, not surprisingly, unfunded pension liabilities will remain a significant risk for certain state and local governments. As a consequence, credit selection will remain important.
Portfolio strategyImplications from tax reform (Tax Cuts and Jobs Act of 2017) will linger. Lower corporate tax rates and the USD 10,000 limit allowed on the state and local taxes (SALT) deduction for individual taxpayers will continue to influence investor demand for mu-nis. Overall institutional ownership of tax-exempt paper will continue to slow, reflecting lower corporate tax rates. Ef-fective in 2018, the corporate tax rate was cut to 21% from 35%, making munis less attractive vis-á-vis taxable securi-ties. By contrast, investor demand for munis from individual investors seeking tax-advantaged investments is apt to stay strong. The top marginal federal tax rate is relatively high at 37%. And, the effective tax rate may now be higher for some taxpayers in light of the limitations on SALT deduc-tions, making munis more attractive to private clients.
New issue supply will move higher.In the year ahead, the pace of primary market municipal bond sales is poised to move higher following a period of tight new issuance in 2018. As a point of reference, muni volume has fallen by about 15% on a year-to-date basis through October (USD 288.1bn) compared to the same time one year earlier (USD 333.3bn). The elimination of tax-ex-empt advance refundings in 2018 has been the principal rea-son for the decline. For the full calendar year, total issuance is on pace to closely align with our forecast of USD 330bn-340bn.1
We envision overall supply for calendar year 2019 to increase toward levels closer to its 10-year average (USD 380bn –USD 385bn) as shown in Figure 1. Our expectation for supply ex-pansion is driven in large part by two factors. First, the No-vember 2018 election has provided local governments with authority to issue up to USD 51bn of bonds for infrastructure projects.2 With rainy day funds at all-time highs nationally,3 the stock market near all-time highs, and unemployment at a 49-year low, issuers and taxpayers are feeling confident. We
expect that confidence to manifest itself in bond issuance for schools, water, and sewer infrastructure, etc. Second, Build America Bonds’ (BABs) issuers are likely to take advantage of an Internal Revenue Code (IRC) provision allowing them to advance refund their taxable bond issues with tax-exempt debt. As a point of reference, callable BABs constitute about 30% of all outstanding BABs. We have seen estimates that about USD 20bn to USD 25bn of BABs could get refunded in 2019.4 This would have the effect of boosting tax-exempt supply. At the same time, the amount of taxable municipal bonds outstanding should contract.
Issuers will move to shorter call structures.Following the Tax Cuts and Jobs Act, which eliminated the ability to sell tax-exempt advance refunding bonds (unless re-financing taxable munis), some US public finance issuers have introduced shorter calls on new bond issues thus far in 2018. To preserve their flexibility we expect to see more municipal borrowers include such options in the year ahead. That said, change often comes slowly to the muni market.
2017201620152014201320122011 2018YTD
450
300
400
350
200
0
100
250
50
150
Combined New-Money
Total municipal bond issuance, 2011−2018 YTD
Note: 10-year average is from 2008−2017 time frame (USD 385bn)Source: Bond Buyer, UBS, as of 31 October 2018
Refunding Total issuance 10-yr avg.
Figure 1
In USD billions
6 NOVEMBER 2018 Municipal Market Guide
Outlook
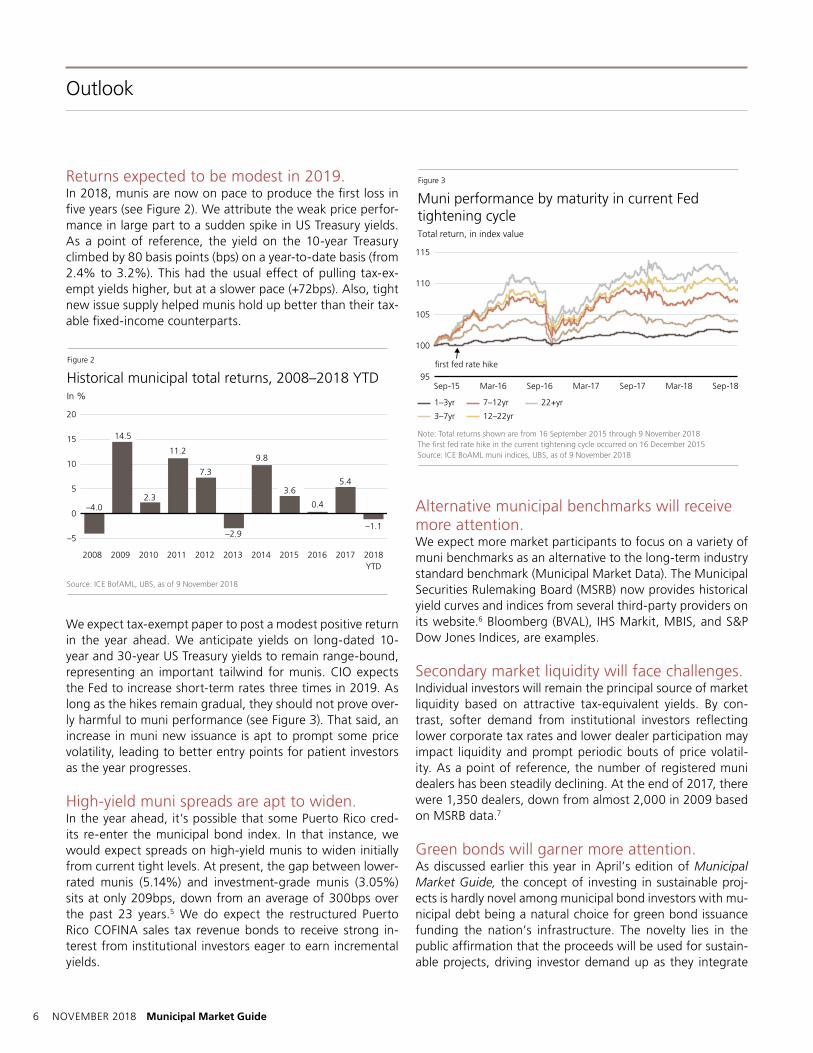
Returns expected to be modest in 2019. In 2018, munis are now on pace to produce the first loss in five years (see Figure 2). We attribute the weak price perfor-mance in large part to a sudden spike in US Treasury yields. As a point of reference, the yield on the 10-year Treasury climbed by 80 basis points (bps) on a year-to-date basis (from 2.4% to 3.2%). This had the usual effect of pulling tax-ex-empt yields higher, but at a slower pace (+72bps). Also, tight new issue supply helped munis hold up better than their tax-able fixed-income counterparts.
We expect tax-exempt paper to post a modest positive return in the year ahead. We anticipate yields on long-dated 10-year and 30-year US Treasury yields to remain range-bound, representing an important tailwind for munis. CIO expects the Fed to increase short-term rates three times in 2019. As long as the hikes remain gradual, they should not prove over-ly harmful to muni performance (see Figure 3). That said, an increase in muni new issuance is apt to prompt some price volatility, leading to better entry points for patient investors as the year progresses.
High-yield muni spreads are apt to widen. In the year ahead, it’s possible that some Puerto Rico cred-its re-enter the municipal bond index. In that instance, we would expect spreads on high-yield munis to widen initially from current tight levels. At present, the gap between lower-rated munis (5.14%) and investment-grade munis (3.05%) sits at only 209bps, down from an average of 300bps over the past 23 years.5 We do expect the restructured Puerto Rico COFINA sales tax revenue bonds to receive strong in-terest from institutional investors eager to earn incremental yields.
Alternative municipal benchmarks will receive more attention. We expect more market participants to focus on a variety of muni benchmarks as an alternative to the long-term industry standard benchmark (Municipal Market Data). The Municipal Securities Rulemaking Board (MSRB) now provides historical yield curves and indices from several third-party providers on its website.6 Bloomberg (BVAL), IHS Markit, MBIS, and S&P Dow Jones Indices, are examples.
Secondary market liquidity will face challenges.Individual investors will remain the principal source of market liquidity based on attractive tax-equivalent yields. By con-trast, softer demand from institutional investors reflecting lower corporate tax rates and lower dealer participation may impact liquidity and prompt periodic bouts of price volatil-ity. As a point of reference, the number of registered muni dealers has been steadily declining. At the end of 2017, there were 1,350 dealers, down from almost 2,000 in 2009 based on MSRB data.7
Green bonds will garner more attention. As discussed earlier this year in April’s edition of Municipal Market Guide, the concept of investing in sustainable proj-ects is hardly novel among municipal bond investors with mu-nicipal debt being a natural choice for green bond issuance funding the nation’s infrastructure. The novelty lies in the public affirmation that the proceeds will be used for sustain-able projects, driving investor demand up as they integrate
Historical municipal total returns, 2008–2018 YTD
Source: ICE BofAML, UBS, as of 9 November 2018
Figure 2
In %
–5
0–4.0
11.2
5.4
–1.1
20
15
10
5
2017201620152014201320122011201020092008 2018YTD
9.8
–2.9
0.42.3
7.3
3.6
14.5
Sep-18Sep-15 Mar-16 Sep-16 Mar-17 Mar-18Sep-17
115
110
105
100
95
Muni performance by maturity in current Fed tightening cycle
Note: Total returns shown are from 16 September 2015 through 9 November 2018The first fed rate hike in the current tightening cycle occurred on 16 December 2015Source: ICE BoAML muni indices, UBS, as of 9 November 2018
Figure 3
1–3yr
3–7yr
7–12yr 22+yr
12–22yr
Total return, in index value
first fed rate hike
Municipal Market Guide NOVEMBER 2018 7
Outlook
environmental, social and governance (ESG) considerations into their investment decisions. Evidence thus far however is inconclusive that designating bonds as “green” has in-creased demand. Interestingly despite increased interest in ESG investing, issuance in this sector has declined at a more rapid pace in 2018 than the municipal market as a whole based on Bloomberg data. Despite the decline this year, we still believe green bonds will play a greater role in the munici-pal markets future as states prepare to mitigate the effects of climate change.
Mutual fund consolidation should accelerate.The fee compression already underway among open-ended mutual funds is likely to continue. Fixed income funds have more latitude to charge higher fees than equity index funds, but pricing pressure will increase. We expect to see more ac-quisitions as larger fund managers acquire smaller rivals with specific skill sets and specialties.
Closed-end funds Lowest valuations in five years will help narrow discounts.Our forecast for distribution cuts in 2018 turned out to be correct, as almost 80% of the national and state leveraged funds in our coverage universe cut their distributions due to higher borrowing costs and reinvestments at lower coupons. We also had forecasted higher demand for closed-end funds (CEFs) in 2018. Although, investor appetite for munis has been strong in 2018, higher Treasury yields put a damper on
closed-end fund market prices. Poor performance in 1H of 2018 resulted in a very busy tax-loss selling season. Funds are now trading at discounts not seen since 2013 (taper tan-trum), which should set the stage for buyers to return to this group of funds in the months ahead. In addition, 2019 tax season may bring some surprises with elimination of the SALT (state and local tax) deduction, which impacts higher tax rate states and could drive up demand for munis. CEFs offer an alternative way to get exposure at a discount—and with higher distributions through the use of leverage.
Funds are trading cheap across the board. National leveraged funds are trading at a 9% discount vs. the average of 6% and 4% discounts for the 52-week and two-year periods, respectively. Non-leveraged funds are trading at a 7% dis-count, which is bit cheaper than the one- and two-year aver-age discounts of 5%. State funds like New York and Califor-nia trade at 7% discounts on average. Tax-exempt income of 5-5.5% combined with the discounts may help fund market prices outperform net asset values.
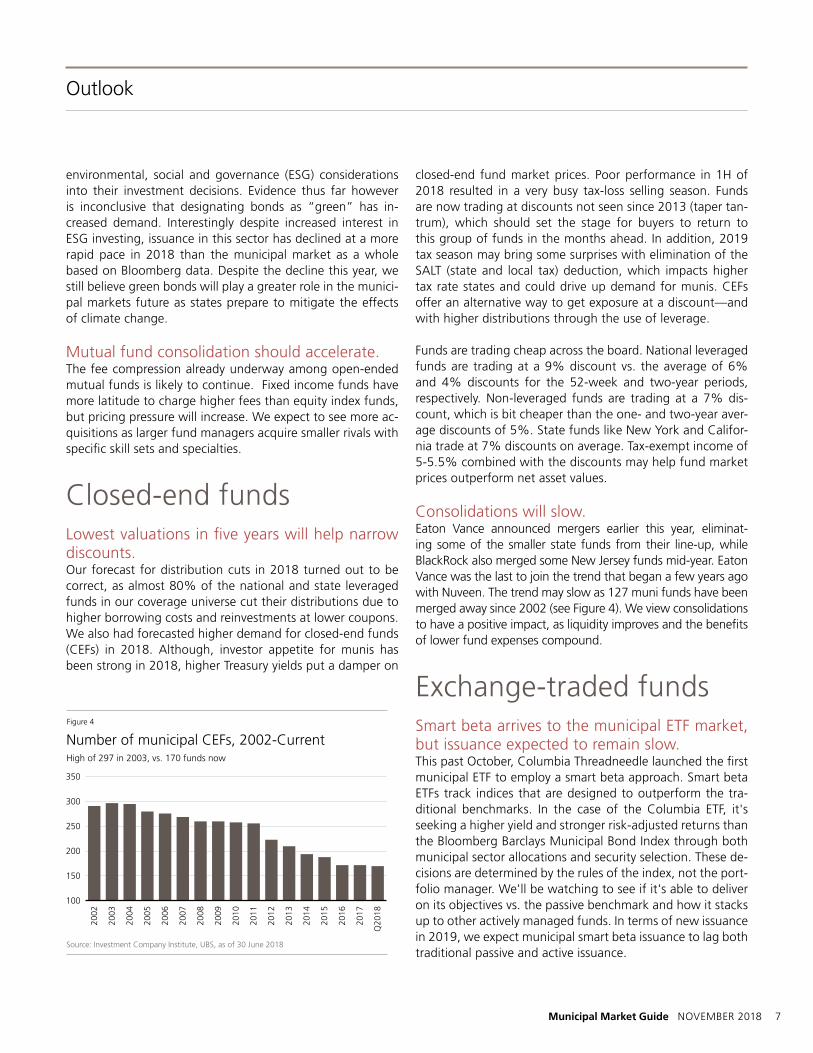
Consolidations will slow.Eaton Vance announced mergers earlier this year, eliminat-ing some of the smaller state funds from their line-up, while BlackRock also merged some New Jersey funds mid-year. Eaton Vance was the last to join the trend that began a few years ago with Nuveen. The trend may slow as 127 muni funds have been merged away since 2002 (see Figure 4). We view consolidations to have a positive impact, as liquidity improves and the benefits of lower fund expenses compound.
Exchange-traded fundsSmart beta arrives to the municipal ETF market, but issuance expected to remain slow. This past October, Columbia Threadneedle launched the first municipal ETF to employ a smart beta approach. Smart beta ETFs track indices that are designed to outperform the tra-ditional benchmarks. In the case of the Columbia ETF, it's seeking a higher yield and stronger risk-adjusted returns than the Bloomberg Barclays Municipal Bond Index through both municipal sector allocations and security selection. These de-cisions are determined by the rules of the index, not the port-folio manager. We'll be watching to see if it's able to deliver on its objectives vs. the passive benchmark and how it stacks up to other actively managed funds. In terms of new issuance in 2019, we expect municipal smart beta issuance to lag both traditional passive and active issuance.
Number of municipal CEFs, 2002-Current
Source: Investment Company Institute, UBS, as of 30 June 2018
Figure 4
High of 297 in 2003, vs. 170 funds now
300
200
250
100
150
350
2017
2016
2015
2014
2013
2012
2011
2010
2009
2008
2007
2006
2005
2004
2003
2002
Q20
18
8 NOVEMBER 2018 Municipal Market Guide
Outlook
Actively municipal ETF launches to continue to outpace passive.We believe one reason it took a while for smart beta to reach the municipal space is that actively managed fixed income ETFs have been successful in raising assets. The active ele-ment also provides more flexibility in addressing some of the challenges around liquidity in fixed income. Within municipal ETFs, 18 of the 45 ETFs are actively managed and last year five of the seven launches were actively managed. While we expect actively managed municipal ETF issuance to outpace passive issuance next year, it will take a while for the gap in assets to narrow. At present, 96% of the assets in municipal ETFs are in passively managed ETFs.
Municipal CreditFederal infrastructure bill is possible under a divided Congress. President Trump proposed a USD 1.5tr infrastructure plan in June 2017 but it did not gain traction in Congress. Demo-crats have openly discussed getting an infrastructure bill completed once they take control of the House. Both parties extol the virtues of improving our nation’s infrastructure but finding a bipartisan way to pay for it is where the difficulty lies. Democrats are likely to put forward an infrastructure bill that would be funded in part by rollback in tax cuts for cor-porations and wealthy individuals. The Republican-controlled Senate is unlikely to go along with that course of action. The House proposal would at least be a starting point for negotiations. With the president pushing Congress to find common ground on the issue, we believe an infrastructure bill is possible in 2019.
Unfunded pension liabilities will continue to represent a significant risk for certain state and local governments. States with poorly funded pension systems will commit to transfer “hard” assets to their pension system. New Jersey did so in 2017 by transfer of ownership of its lottery system. The net operating proceeds of the lottery now accumulate to the benefit of New Jersey pensioners. Connecticut’s Pen-sions Sustainability Commission is now taking a serious look at what assets it may have available to transfer to its pension system. Assets under consideration are the CT state lottery, buildings and real estate. The pension system will benefit from recognizing the asset at its current full market value
which will immediately increase its pension funding ratio. The state will benefit from its ability to reduce its pension payments. Whether we believe this is a sound idea or not is another story.
More downgrades of sales tax revenue bonds will occur. On 22 October 2018, S&P released new criteria which will impact most “sales tax” credits. Over 1,300 credits are in-scope for possible ratings revisions. Some issuers will see no change to their ratings, while approximately 80% of issuers are expected to have their rating impacted either negatively or positively. S&P anticipates more upgrades than down-grades. The new criterion evaluates how closely obligors are “linked” to their sponsors and the sponsors’ ability to disrupt the obligors’ revenue stream. Sales Tax Securitization Cor-poration (linked to City of Chicago BBB rating) was down-graded one notch to AA- while Build Illinois Sales Tax Bonds (linked to State of Illinois BBB- rating) was downgraded four notches from AA- to BBB as a result of the criteria change.
Opportunity Zones (OZ) may be one of the most significant provisions of the Tax Cuts and Jobs Act. The OZ program is designed to promote private-sector in-vestment in economically distressed communities throughout the nation. Investors in the OZ program would be eligible for the deferral of taxation on an unlimited amount of realized capital gains, and, depending upon the duration of the hold-ing period, a reduction in their total tax liability. On 19 Oc-tober 2018, the US Treasury Department (Treasury) and the IRS released proposed regulations and additional guidance related to the OZ tax incentive program. We expect that the first round of regulations will provide Qualified Opportunity Fund sponsors, particularly those focused on single assets, greater confidence to move ahead with offerings in the com-ing months. CIO expects OZ development to have a posi-tive impact on the municipal issuers where they reside. The value of new development; improved infrastructure, jobs, enhanced property values as well as higher revenues derived from income, sales and property taxes will all accrue to the long term benefit of the host municipality.
For additional insight into OZ, please see the 18 May 2018 report Opportunity Knocks in tax-advantaged Opportunity Zones in the US and 23 October 2018 entitled report Real estate markets Opportunity Zones: updated regulations and guidance.
Smaller liberal arts-focused institutions are likely to see more downgrades than upgrades in 2019. The private higher education sector is in the midst of sub-stantial transition that will continue to put pressure on credit quality, driven by demographic changes and the perceived value and affordability of college education. While the larger, highly selective institutions with an emphasis on STEM (Sci-ence, Technology, Engineering and Math) programs are see-ing robust student demand, smaller, less selective colleges with a liberal arts focus are finding it harder to justify and sustain their high tuition price tags. Declining revenue and operating cost pressures with a challenging value proposition have elevated the credit risk of smaller institutions.
Connecticut GO spreads will see further widening. Despite the expected general fund surplus in 2019 as a re-sult of strong revenue collections and actions to strengthen reserve funds, we expect the spreads on the state’s general obligation (GO) debt (to the AAA GO benchmark) to grind higher over the next 12 months, driven by continuing ad-verse market perceptions of its large unfunded pension li-abilities that have been steadily rising as well as negative demographic trends. On 6 November, voters approved an amendment to the state constitution that requires that any existing state transportation funding sources be used only for transportation purposes, thus limiting some fiscal flexibility for the state.
Revenue bond securitizations will become more common. While municipal bankruptcies are blessedly rare events, capi-tal market creditors are highly exposed when they do occur. The corporate bankruptcy bar has become far more active in the public finance arena and their participation has led to some ambiguity over the rights of revenue bond holders. Chicago opted for a securitization of sales tax revenues, rath-er than a more traditional revenue bond, to assure prospec-tive investors that other creditors could not interfere with their exclusive claims on pledged revenue. We expect more tax exempt borrowers to pursue similar structures.
Some governments likely to examine OPEB funding bonds. The sale of pension obligation bonds (POBs) has been used for years by governments eager to improve their funded pen-sion ratio. POBs are long-term wagers that reinvested pro-ceeds will yield a higher return than the true interest cost of the securities being sold to investors. We remain highly skeptical of the practice. We anticipate that some govern-ments will examine the feasibility of engaging in the same sort of financial engineering for other post-employment ben-efit (OPEB) liabilities. Very few states have reserved any funds for future OPEB payments, and the size of their calculated liabilities will have to be discounted at risk-free rates. Para-doxically, the size of the calculated liability may be reduced through the sale of OPEB funding bonds. However, the net effect is the same; the risk is transferred from the public sec-tor beneficiaries to capital market creditors.
Illinois GO debt will witness near-term price improvement. While the state’s structural fiscal issues will remain challeng-ing, positive developments such as a fiscal 2019 budget, the state’s willingness to tackle unpaid vendor bills, and stable outlooks by Moody’s and S&P should alleviate market fears of a downgrade in the near future. The change of Moody’s outlook from “negative” to “stable” in July 2018 was the first positive action by Moody’s about Illinois’ credit in sev-eral years. Slightly improved near term credit fundamentals coupled with the investors’ search for tax-exempt yield in a relatively tight municipal market points to Illinois represent-ing “value”, at least in the near term.
Natural disasters to influence issuer’s preparedness. Recent wildfires, hurricanes, rising sea levels and other natu-ral disasters have regrettably become so common that in-vestors have become indifferent. Their unresponsiveness may be caused by a lack of bond payment defaults historically associated with natural disasters. However, the increased frequency in the number of events and the costs associated with recovery are driving market participants’ concern that insurance recoveries and federal relief may be curtailed in the future. Should recoveries and aid decline, the financial re-sponsibility to mitigate and recover from natural disasters will put more pressure on issuer’s creditworthiness. We’ve seen the first signs of this when Harris County voters approved a USD 2.5bn referendum to improve the region’s storm pre-paredness from future weather related events on the one year anniversary of Hurricane Harvey.
10 NOVEMBER 2018 Municipal Market Guide
Outlook
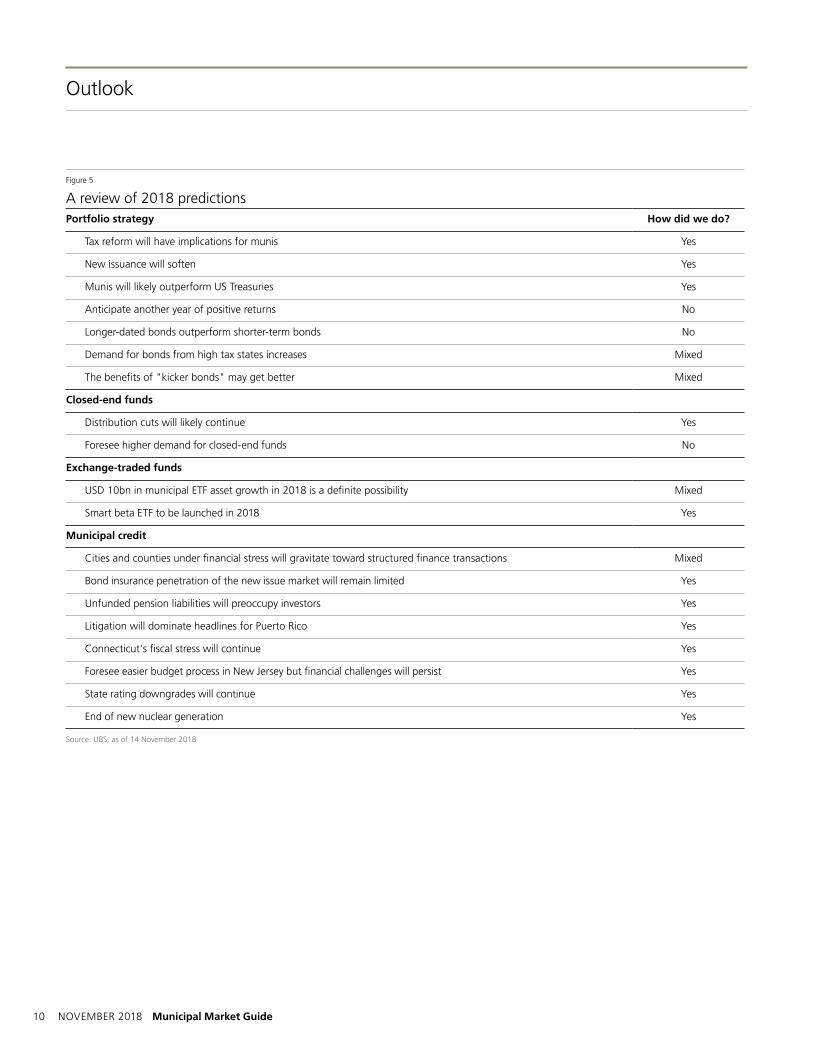
Figure 5
A review of 2018 predictions Portfolio strategy How did we do?
Tax reform will have implications for munis Yes
New issuance will soften Yes
Munis will likely outperform US Treasuries Yes
Anticipate another year of positive returns No
Longer-dated bonds outperform shorter-term bonds No
Demand for bonds from high tax states increases Mixed
The benefits of "kicker bonds" may get better Mixed
Closed-end funds
Distribution cuts will likely continue Yes
Foresee higher demand for closed-end funds No
Exchange-traded funds
USD 10bn in municipal ETF asset growth in 2018 is a definite possibility Mixed
Smart beta ETF to be launched in 2018 Yes
Municipal credit
Cities and counties under financial stress will gravitate toward structured finance transactions Mixed
Bond insurance penetration of the new issue market will remain limited Yes
Unfunded pension liabilities will preoccupy investors Yes
Litigation will dominate headlines for Puerto Rico Yes
Connecticut's fiscal stress will continue Yes
Foresee easier budget process in New Jersey but financial challenges will persist Yes
State rating downgrades will continue Yes
End of new nuclear generation Yes
Source: UBS, as of 14 November 2018
Municipal Market Guide NOVEMBER 2018 11
California
The state’s October revenue of USD 6.57bn fell below bud-geted revenues by 5.9 percent, or USD 412.2mn, due to lower than expected personal income tax and corporation tax revenues. Despite October’s shortfall, year to date rev-enues of USD 35.28bn are still 3.0 percent higher than the projected budget and USD 2.63bn or 8.1 percent higher than comparable year to date results for fiscal year 2018.
Voters in the city of San Francisco passed Proposition C with 60 percent approval, geared to fund homeless housing, mental health and addiction services and homeless preven-tion programs. Proposition C levies a new tax of 0.175 to 0.69 percent on any businesses’ gross annual receipts which are over USD 50mn and is expected to raise USD 300mn, almost double the city’s current spending. The highly pub-licized measure had evoked mixed sentiments among the business community. Despite a 60 percent approval margin, the measure may be subject to some legal challenges due to the ambiguity associated with citizen-led ballot initiatives.
The University of Southern California has entered an “agreement in principle” to pay USD 215mn to patients treated by a campus gynecologist who has been accused of sexual assault by over 500 women. As part of an indepen-dent investigation by the USC Board of Trustees into the stu-dent health center, the University has offered USD 2,500 to all student patients of the doctor; the compensation could go up to USD 250,000 upon the provision of further de-tails about their experience. The investigation comes after 93 former students filed two class-action lawsuits against the school for failing to address complaints lodged against the doctor.
ColoradoMoody’s has placed the Baa3 ratings of the Colorado Re-gional Transportation District's (RTD) Eagle P3 bonds on review for downgrade. The agency cited the ongoing regula-tory and legal challenges faced by the concessionaire, Denver Transit Partners (DTP), after technology problems prevented the last commuter rail from opening. As a result of poor per-formance and missed deadlines, RTD issued a termination notice to DTP which responded by filing a lawsuit claiming they should have been entitled to more time given amended laws and regulations.
ConnecticutAfter the city of West Haven’s city council approved a re-vised financial recovery plan as requested by the state, the Municipal Accountability Review Board (MARB) granted the city approximately USD 8mn in municipal restructuring aid in order to close the fiscal 2018 budget deficit. In order to receive the funds, the city has agreed to timely submission of monthly financial reporting, creation of a financial reserve policy, and analysis of privatization of city-owned assets.
Florida
Voters in Duval County approved a non-binding referendum which allows residents the right to vote on any future sale of JEA. City council will now decide if it will amend the city charter to include the provision which passed with 73 per-cent approval showing strong voter interest. Although cur-rent mayor Lenny Curry does not intend to propose the priva-tization of the city’s utility, discussions arise every few years regarding the utility’s future.
Georgia
Voters in Henry County rejected the creation of Eagle’s Landing on 6 November with 57 percent of voters opposing the measure. The proposed de-annexation from the city of Stockbridge would have removed a significant portion of the tax base while also raising concerns regarding the treatment of pre-existing debt. The US District court order had issued an order on 19 October which stated that local governments cannot redraw boundaries without redistributing pre-existing debts to such newly created entity under state law Section 7.15(h) of Georgia Act 548.
Illinois
On 22 October, S&P released new criteria related to “Priority-Lien Tax Revenue Debt” and commenced the review of 1,300 ratings that may be affected. The agency will reportedly place a priority on the review of larger, high-profile names. The Chicago Sales Tax Securitization Corporation and Illinois Sales Tax were among the first rating revisions re-leased by S&P. The new criteria creates a more substantive link between the general credit of an issuer and any debt secured by special revenues and caps the rating discrepancy to four notches. In these two examples, S&P believes that
In the news 11 October 2018 – 13 November 2018
12 NOVEMBER 2018 Municipal Market Guide
there is a low likelihood of Chicago sales tax revenue being impaired should the city fall into distress which allows for a four notch separation (AA-/stable). On the other hand, S&P believes that the state’s sales tax revenues are more exposed, with ratings on Illinois GO and sales tax revenue separated by only one notch (BBB/stable).
MichiganThree years after exiting bankruptcy, and almost a decade af-ter it last sold bonds on its own, the city of Detroit is planning to issue USD 115mn in unlimited tax general obligation bonds in December. The city council voted 6-3 in favor of Mayor Mike Duggan’s request to authorize USD 255mn in bonds to be is-sued over the next five years. Bond proceeds will fund pub-lic safety, recreational and economic development projects which were originally authorized by voters in 2004 and 2009. The bonds are expected to carry a Ba3 by Moody’s.
New Jersey
Union County continues to support the guaranty it provided for the Union County Improvement Authority’s (Author-ity) Series 2011 bonds issued for renewable energy purposes. Bond proceeds were used to design, permit, construct, install and operate solar renewable energy project at municipal and board of educational facilities within the county. Under the transaction, the Authority entered into an agreement with Tioga Solar Union County 1, LLC who later liquidated its busi-ness and was unable to perform its obligation under its obliga-tions. Under the County Guaranty Agreement, Union County unconditionally guaranteed the timely payment of debt ser-vice. For the third year in a row, the County used available revenues to support debt service payment on 15 October and also intends to appropriate sufficient monies in the 2019 bud-get to pay debt service to prevent a default.
New YorkLaura Curran, Nassau County’s Executive, vetoed amend-ments made by the county legislature on 5 November, citing a violation of lawful procedures which would result in such amendments being null and void. The amendments included adding funds to reopen closed police precincts as well as building a contingency fund for labor contracts. The legisla-ture requires a supermajority of 13 votes to override the veto. The Nassau Interim Finance Authority has final authorization of the county’s budget.
Texas
Taxpayers approved a referendum for Houston firefighters to receive salary parity with city police officers on 6 Novem-ber. The measure was approved by 59 percent and is expect-ed to cost the city approximately USD 100mn per year. As a result, Mayor Sylvester Turner announced plans to lay off city firefighters and/or services as the city cannot afford such in-creases. The city council will have to vote in January on such potential cuts while firefighter representatives are awaiting a meeting to negotiate the implementation of the approved measure.
VermontMoody’s downgraded the state’s general obligation rating to Aa1 from Aaa on 23 October, while maintaining the state’s stable outlook. The agency cited the state’s aging popula-tion, which limits future growth, as well as high leverage relative to GDP when compared to other states.
Washington
Despite much opposition by teachers unions and civil rights groups, the Washington State Supreme Court upheld its 2016 charter school law reaffirming that the state may con-tinue funding charter schools with net revenue from the state lottery. Challengers claimed that it’s wrong to divert public funds to privately run organizations which have no lo-cal oversight. Justice Mary Yu disagreed, opining that char-ter schools do not receive local tax money.
In the news
Municipal Market Guide NOVEMBER 2018 13
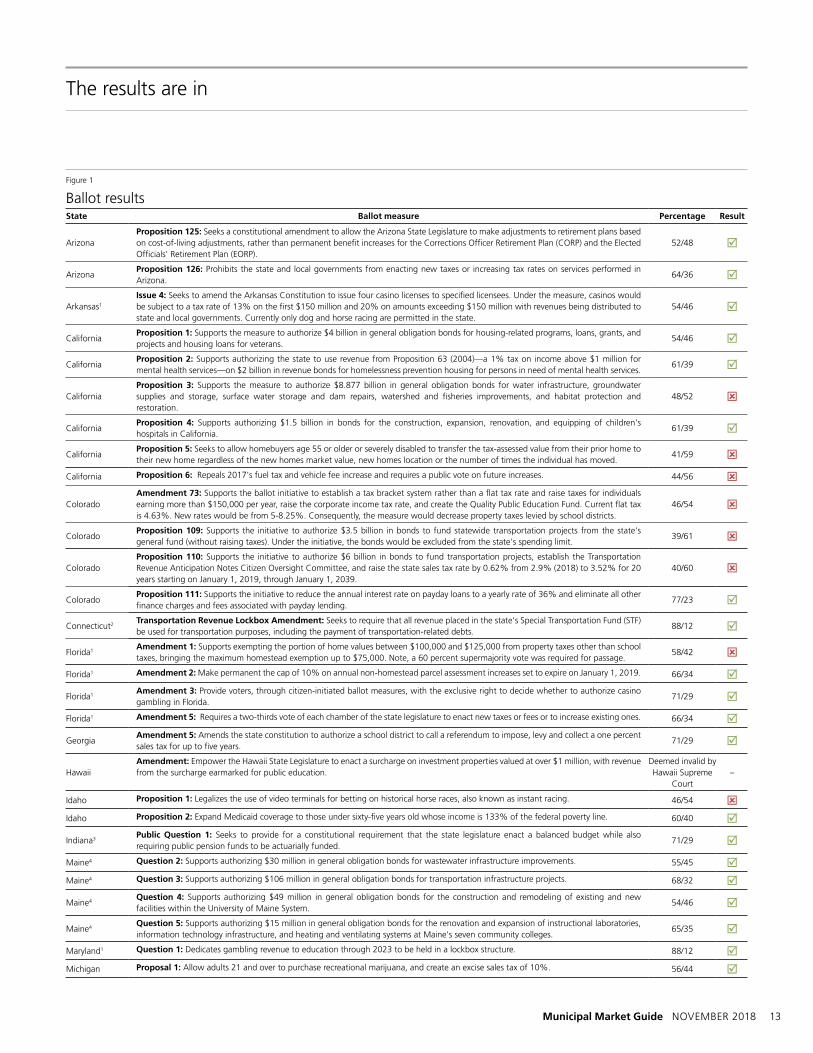
Figure 1
Ballot resultsState Ballot measure Percentage Result
ArizonaProposition 125: Seeks a constitutional amendment to allow the Arizona State Legislature to make adjustments to retirement plans based on cost-of-living adjustments, rather than permanent benefit increases for the Corrections Officer Retirement Plan (CORP) and the Elected Officials' Retirement Plan (EORP).
52/48
ArizonaProposition 126: Prohibits the state and local governments from enacting new taxes or increasing tax rates on services performed in Arizona.
64/36
Arkansas1
Issue 4: Seeks to amend the Arkansas Constitution to issue four casino licenses to specified licensees. Under the measure, casinos would be subject to a tax rate of 13% on the first $150 million and 20% on amounts exceeding $150 million with revenues being distributed to state and local governments. Currently only dog and horse racing are permitted in the state.
54/46
CaliforniaProposition 1: Supports the measure to authorize $4 billion in general obligation bonds for housing-related programs, loans, grants, and projects and housing loans for veterans.
54/46
CaliforniaProposition 2: Supports authorizing the state to use revenue from Proposition 63 (2004)—a 1% tax on income above $1 million for mental health services—on $2 billion in revenue bonds for homelessness prevention housing for persons in need of mental health services.
61/39
CaliforniaProposition 3: Supports the measure to authorize $8.877 billion in general obligation bonds for water infrastructure, groundwater supplies and storage, surface water storage and dam repairs, watershed and fisheries improvements, and habitat protection and restoration.
48/52
CaliforniaProposition 4: Supports authorizing $1.5 billion in bonds for the construction, expansion, renovation, and equipping of children's hospitals in California.
61/39
CaliforniaProposition 5: Seeks to allow homebuyers age 55 or older or severely disabled to transfer the tax-assessed value from their prior home to their new home regardless of the new homes market value, new homes location or the number of times the individual has moved.
41/59
California Proposition 6: Repeals 2017's fuel tax and vehicle fee increase and requires a public vote on future increases. 44/56
ColoradoAmendment 73: Supports the ballot initiative to establish a tax bracket system rather than a flat tax rate and raise taxes for individuals earning more than $150,000 per year, raise the corporate income tax rate, and create the Quality Public Education Fund. Current flat tax is 4.63%. New rates would be from 5-8.25%. Consequently, the measure would decrease property taxes levied by school districts.
46/54
ColoradoProposition 109: Supports the initiative to authorize $3.5 billion in bonds to fund statewide transportation projects from the state's general fund (without raising taxes). Under the initiative, the bonds would be excluded from the state's spending limit.
39/61
ColoradoProposition 110: Supports the initiative to authorize $6 billion in bonds to fund transportation projects, establish the Transportation Revenue Anticipation Notes Citizen Oversight Committee, and raise the state sales tax rate by 0.62% from 2.9% (2018) to 3.52% for 20 years starting on January 1, 2019, through January 1, 2039.
40/60
ColoradoProposition 111: Supports the initiative to reduce the annual interest rate on payday loans to a yearly rate of 36% and eliminate all other finance charges and fees associated with payday lending.
77/23
Connecticut2 Transportation Revenue Lockbox Amendment: Seeks to require that all revenue placed in the state's Special Transportation Fund (STF) be used for transportation purposes, including the payment of transportation-related debts.
88/12
Florida1 Amendment 1: Supports exempting the portion of home values between $100,000 and $125,000 from property taxes other than school taxes, bringing the maximum homestead exemption up to $75,000. Note, a 60 percent supermajority vote was required for passage.
58/42
Florida1 Amendment 2: Make permanent the cap of 10% on annual non-homestead parcel assessment increases set to expire on January 1, 2019. 66/34
Florida1 Amendment 3: Provide voters, through citizen-initiated ballot measures, with the exclusive right to decide whether to authorize casino gambling in Florida.
71/29
Florida1 Amendment 5: Requires a two-thirds vote of each chamber of the state legislature to enact new taxes or fees or to increase existing ones. 66/34
GeorgiaAmendment 5: Amends the state constitution to authorize a school district to call a referendum to impose, levy and collect a one percent sales tax for up to five years.
71/29
HawaiiAmendment: Empower the Hawaii State Legislature to enact a surcharge on investment properties valued at over $1 million, with revenue from the surcharge earmarked for public education.
Deemed invalid by Hawaii Supreme
Court–
Idaho Proposition 1: Legalizes the use of video terminals for betting on historical horse races, also known as instant racing. 46/54 Idaho Proposition 2: Expand Medicaid coverage to those under sixty-five years old whose income is 133% of the federal poverty line. 60/40
Indiana3 Public Question 1: Seeks to provide for a constitutional requirement that the state legislature enact a balanced budget while also requiring public pension funds to be actuarially funded.
71/29
Maine4 Question 2: Supports authorizing $30 million in general obligation bonds for wastewater infrastructure improvements. 55/45 Maine4 Question 3: Supports authorizing $106 million in general obligation bonds for transportation infrastructure projects. 68/32
Maine4 Question 4: Supports authorizing $49 million in general obligation bonds for the construction and remodeling of existing and new facilities within the University of Maine System.
54/46
Maine4 Question 5: Supports authorizing $15 million in general obligation bonds for the renovation and expansion of instructional laboratories, information technology infrastructure, and heating and ventilating systems at Maine's seven community colleges.
65/35
Maryland1 Question 1: Dedicates gambling revenue to education through 2023 to be held in a lockbox structure. 88/12 Michigan Proposal 1: Allow adults 21 and over to purchase recreational marijuana, and create an excise sales tax of 10%. 56/44
The results are in
14 NOVEMBER 2018 Municipal Market Guide
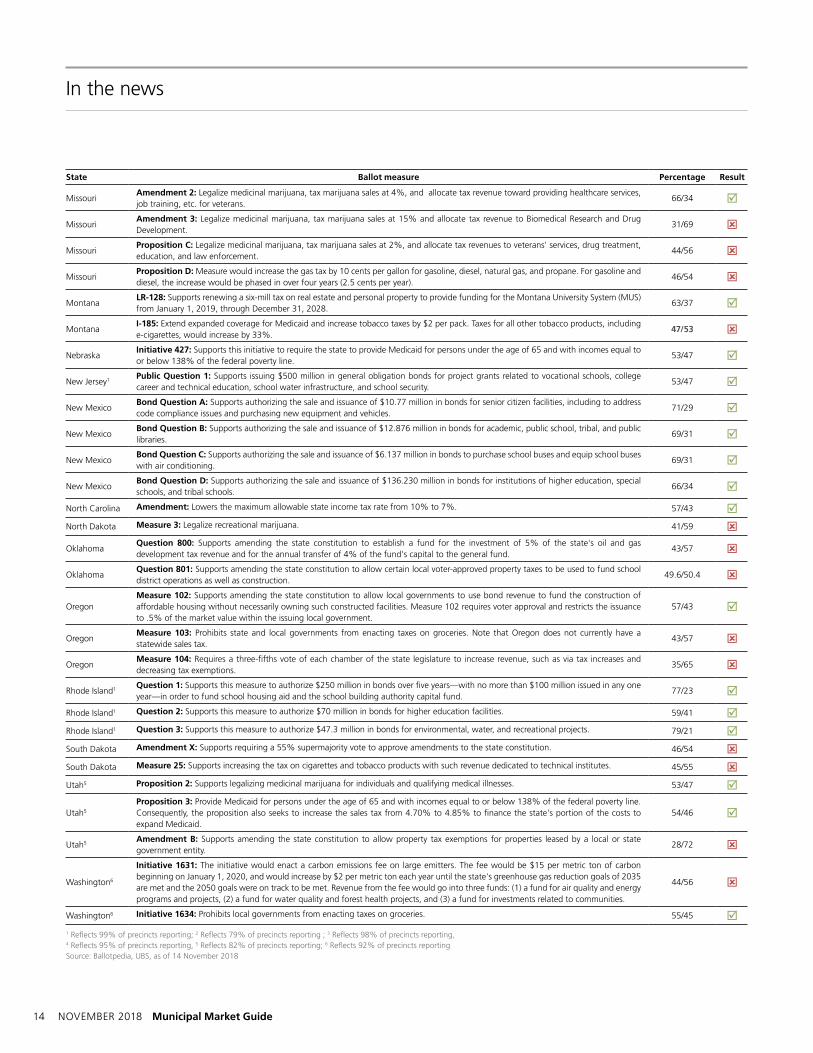
In the news
State Ballot measure Percentage Result
MissouriAmendment 2: Legalize medicinal marijuana, tax marijuana sales at 4%, and allocate tax revenue toward providing healthcare services, job training, etc. for veterans.
66/34
MissouriAmendment 3: Legalize medicinal marijuana, tax marijuana sales at 15% and allocate tax revenue to Biomedical Research and Drug Development.
31/69
MissouriProposition C: Legalize medicinal marijuana, tax marijuana sales at 2%, and allocate tax revenues to veterans' services, drug treatment, education, and law enforcement.
44/56
MissouriProposition D: Measure would increase the gas tax by 10 cents per gallon for gasoline, diesel, natural gas, and propane. For gasoline and diesel, the increase would be phased in over four years (2.5 cents per year).
46/54
MontanaLR-128: Supports renewing a six-mill tax on real estate and personal property to provide funding for the Montana University System (MUS) from January 1, 2019, through December 31, 2028.
63/37
MontanaI-185: Extend expanded coverage for Medicaid and increase tobacco taxes by $2 per pack. Taxes for all other tobacco products, including e-cigarettes, would increase by 33%.
47/53
NebraskaInitiative 427: Supports this initiative to require the state to provide Medicaid for persons under the age of 65 and with incomes equal to or below 138% of the federal poverty line.
53/47
New Jersey1 Public Question 1: Supports issuing $500 million in general obligation bonds for project grants related to vocational schools, college career and technical education, school water infrastructure, and school security.
53/47
New MexicoBond Question A: Supports authorizing the sale and issuance of $10.77 million in bonds for senior citizen facilities, including to address code compliance issues and purchasing new equipment and vehicles.
71/29
New MexicoBond Question B: Supports authorizing the sale and issuance of $12.876 million in bonds for academic, public school, tribal, and public libraries.
69/31
New MexicoBond Question C: Supports authorizing the sale and issuance of $6.137 million in bonds to purchase school buses and equip school buses with air conditioning.
69/31
New MexicoBond Question D: Supports authorizing the sale and issuance of $136.230 million in bonds for institutions of higher education, special schools, and tribal schools.
66/34
North Carolina Amendment: Lowers the maximum allowable state income tax rate from 10% to 7%. 57/43 North Dakota Measure 3: Legalize recreational marijuana. 41/59
OklahomaQuestion 800: Supports amending the state constitution to establish a fund for the investment of 5% of the state's oil and gas development tax revenue and for the annual transfer of 4% of the fund's capital to the general fund.
43/57
OklahomaQuestion 801: Supports amending the state constitution to allow certain local voter-approved property taxes to be used to fund school district operations as well as construction.
49.6/50.4
OregonMeasure 102: Supports amending the state constitution to allow local governments to use bond revenue to fund the construction of affordable housing without necessarily owning such constructed facilities. Measure 102 requires voter approval and restricts the issuance to .5% of the market value within the issuing local government.
57/43
OregonMeasure 103: Prohibits state and local governments from enacting taxes on groceries. Note that Oregon does not currently have a statewide sales tax.
43/57
OregonMeasure 104: Requires a three-fifths vote of each chamber of the state legislature to increase revenue, such as via tax increases and decreasing tax exemptions.
35/65
Rhode Island1 Question 1: Supports this measure to authorize $250 million in bonds over five years—with no more than $100 million issued in any one year—in order to fund school housing aid and the school building authority capital fund.
77/23
Rhode Island1 Question 2: Supports this measure to authorize $70 million in bonds for higher education facilities. 59/41 Rhode Island1 Question 3: Supports this measure to authorize $47.3 million in bonds for environmental, water, and recreational projects. 79/21 South Dakota Amendment X: Supports requiring a 55% supermajority vote to approve amendments to the state constitution. 46/54 South Dakota Measure 25: Supports increasing the tax on cigarettes and tobacco products with such revenue dedicated to technical institutes. 45/55 Utah5 Proposition 2: Supports legalizing medicinal marijuana for individuals and qualifying medical illnesses. 53/47
Utah5
Proposition 3: Provide Medicaid for persons under the age of 65 and with incomes equal to or below 138% of the federal poverty line. Consequently, the proposition also seeks to increase the sales tax from 4.70% to 4.85% to finance the state's portion of the costs to expand Medicaid.
54/46
Utah5 Amendment B: Supports amending the state constitution to allow property tax exemptions for properties leased by a local or state government entity.
28/72
Washington6
Initiative 1631: The initiative would enact a carbon emissions fee on large emitters. The fee would be $15 per metric ton of carbon beginning on January 1, 2020, and would increase by $2 per metric ton each year until the state's greenhouse gas reduction goals of 2035 are met and the 2050 goals were on track to be met. Revenue from the fee would go into three funds: (1) a fund for air quality and energy programs and projects, (2) a fund for water quality and forest health projects, and (3) a fund for investments related to communities.
44/56
Washington6 Initiative 1634: Prohibits local governments from enacting taxes on groceries. 55/45 1 Reflects 99% of precincts reporting; 2 Reflects 79% of precincts reporting ; 3 Reflects 98% of precincts reporting, 4 Reflects 95% of precincts reporting, 5 Reflects 82% of precincts reporting; 6 Reflects 92% of precincts reportingSource: Ballotpedia, UBS, as of 14 November 2018
Municipal Market Guide NOVEMBER 2018 15
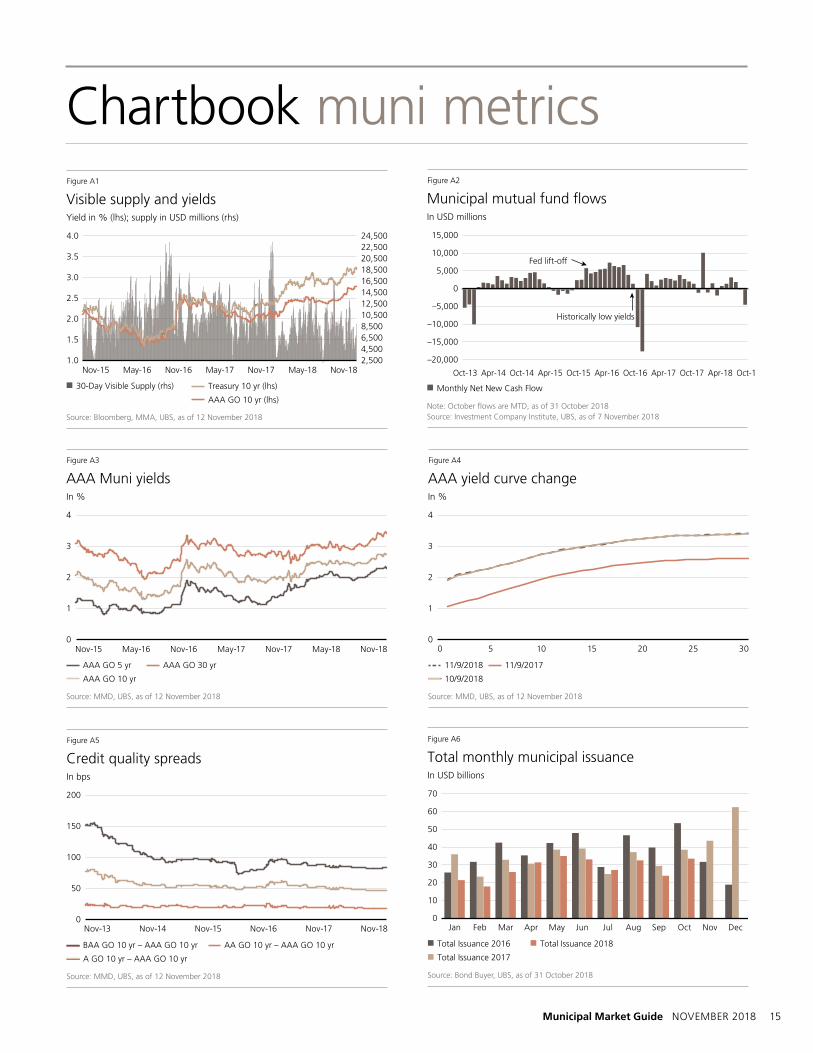
Chartbook muni metrics
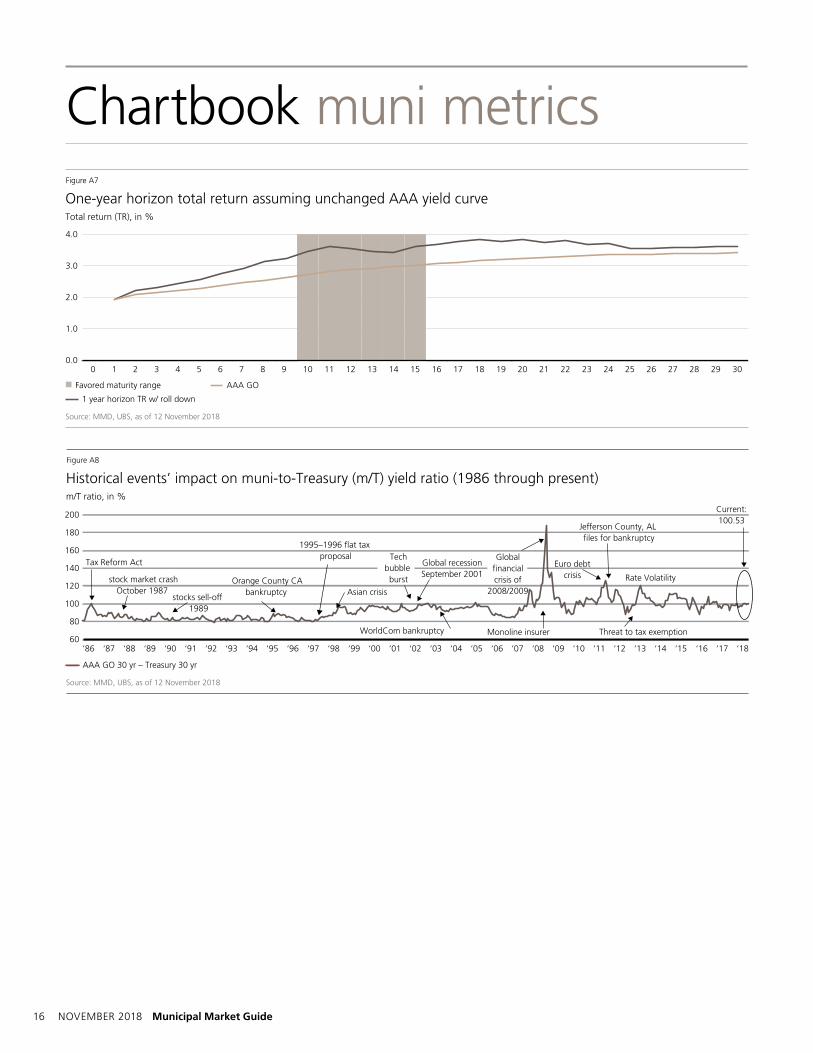
4.0
3.5
2.5
1.0
1.5
3.0
2.0
Nov-15 May-16 Nov-16 May-17 May-18Nov-17 Nov-18
8,5006,5004,5002,500
10,500
20,50018,50016,50014,50012,500
24,50022,500
Visible supply and yields
Source: Bloomberg, MMA, UBS, as of 12 November 2018
30-Day Visible Supply (rhs)
Figure A1
Yield in % (lhs); supply in USD millions (rhs)
Treasury 10 yr (lhs)
AAA GO 10 yr (lhs)
May-17 May-18 Nov-18Nov-15 May-16 Nov-16 Nov-17
4
3
2
0
1
AAA Muni yields
Source: MMD, UBS, as of 12 November 2018
Figure A3
AAA GO 5 yr
AAA GO 10 yr
In %
AAA GO 30 yr
Nov-18Nov-13 Nov-14 Nov-15 Nov-17Nov-16
200
150
0
100
50
Credit quality spreads
Source: MMD, UBS, as of 12 November 2018
Figure A5
BAA GO 10 yr – AAA GO 10 yr
A GO 10 yr – AAA GO 10 yr
In bps
AA GO 10 yr – AAA GO 10 yr
Historically low yields
Fed li-off
15,000
10,000
5,000
–5,000
–20,000
0
–15,000
–10,000
Municipal mutual fund flows
Note: October flows are MTD, as of 31 October 2018Source: Investment Company Institute, UBS, as of 7 November 2018
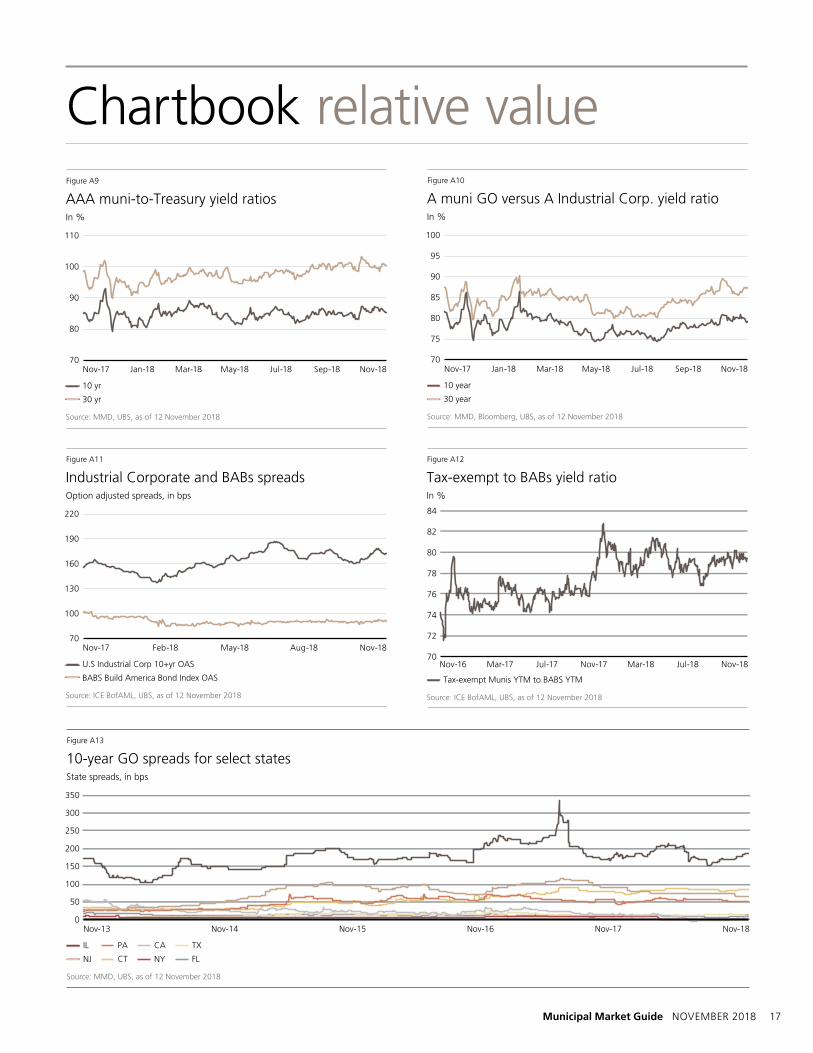
Historical events’ impact on muni-to-Treasury (m/T) yield ratio (1986 through present)
Source: MMD, UBS, as of 12 November 2018
Figure A8
AAA GO 30 yr – Treasury 30 yr
m/T ratio, in %
Municipal Market Guide NOVEMBER 2018 17
Nov-18Nov-17 Jan-18 Mar-18 Jul-18 Sep-18May-18
110
100
70
90
80
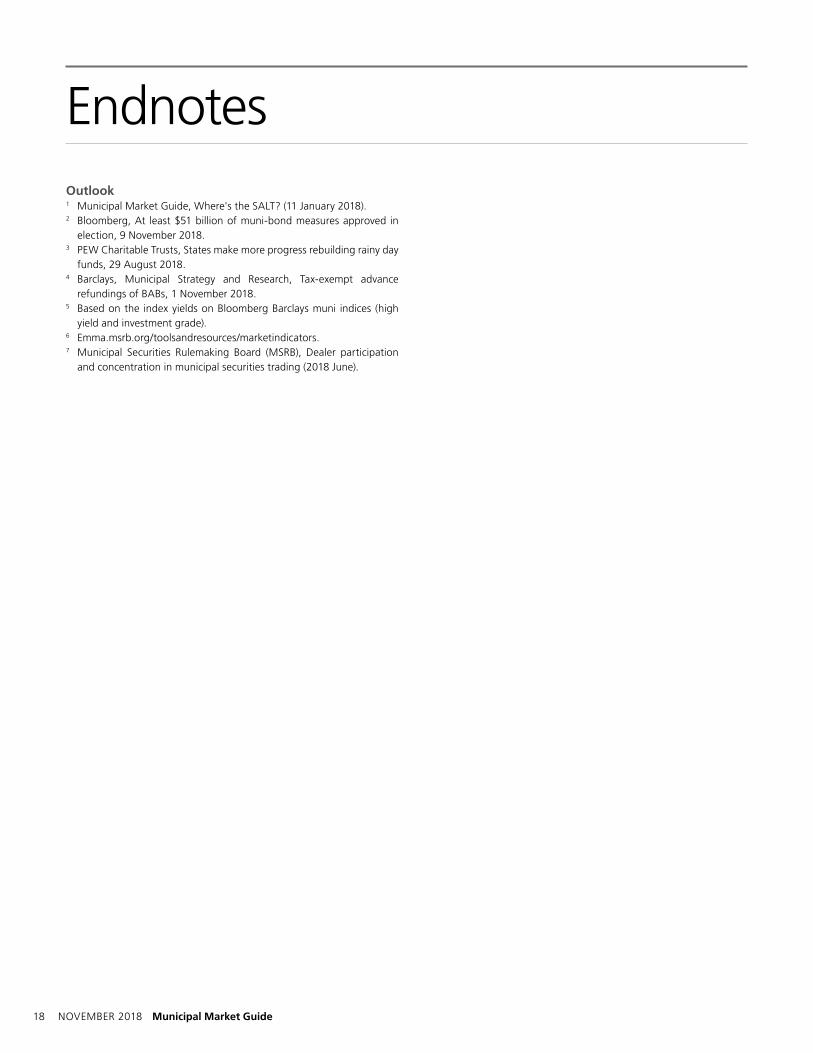
AAA muni-to-Treasury yield ratios
Source: MMD, UBS, as of 12 November 2018
Figure A9
10 yr
30 yr
In %
Nov-18Nov-17 Feb-18 Aug-18May-18
220
190
70
160
130
100
Industrial Corporate and BABs spreads
Source: ICE BofAML, UBS, as of 12 November 2018
Figure A11
U.S Industrial Corp 10+yr OAS
BABS Build America Bond Index OAS
Option adjusted spreads, in bps
Nov-18Nov-17 Jan-18 Mar-18 Jul-18 Sep-18May-18
100
90
95
70
85
80
75
A muni GO versus A Industrial Corp. yield ratio
Source: MMD, Bloomberg, UBS, as of 12 November 2018
Figure A10
10 year
30 year
In %
Nov-18Nov-16 Mar-17 Jul-17 Mar-18 Jul-18Nov-17
84
78
80
82
70
76
74
72
Tax-exempt to BABs yield ratio
Source: ICE BofAML, UBS, as of 12 November 2018
Figure A12
Tax-exempt Munis YTM to BABS YTM
In %
350
300
250
150
0
50
200
100
Nov-17Nov-16Nov-15Nov-14Nov-13 Nov-18
IL
NJ
PA
CT
CA
NY
TX
FL
10-year GO spreads for select states
Source: MMD, UBS, as of 12 November 2018
Figure A13
State spreads, in bps
Chartbook relative value
18 NOVEMBER 2018 Municipal Market Guide
Outlook1 Municipal Market Guide, Where's the SALT? (11 January 2018).2 Bloomberg, At least $51 billion of muni-bond measures approved in
election, 9 November 2018.3 PEW Charitable Trusts, States make more progress rebuilding rainy day
funds, 29 August 2018.4 Barclays, Municipal Strategy and Research, Tax-exempt advance
refundings of BABs, 1 November 2018.5 Based on the index yields on Bloomberg Barclays muni indices (high
yield and investment grade).6 Emma.msrb.org/toolsandresources/marketindicators.7 Municipal Securities Rulemaking Board (MSRB), Dealer participation
and concentration in municipal securities trading (2018 June).
Endnotes
Municipal Market Guide NOVEMBER 2018 19
Required disclosures
UBS Closed-End Funds Ratings and Definitions
UBS Financial Services Rating Definition and criteria
Buy Higher stability of principal and higher stability of distribution
Hold Potential loss of principal, lower degree of distribution stability
Sell High potential for loss of principal and distribution risk
Municipal bonds: Although historical default rates are very low, all munici-pal bonds carry credit risk, with the degree of risk largely following the par-ticular bond‘s sector. Additionally, all municipal bonds feature valuation, return, and liquidity risk. Valuation tends to follow internal and external factors, including the level of interest rates, bond ratings, supply factors, and media reporting. These can be difficult or impossible to project accu-rately. Also, most municipal bonds are callable and/or subject to earlier than expected redemption, which can reduce an investor’s total return. Because of the large number of municipal issuers and credit structures, not all bonds can be easily or quickly sold on the open market.
Closed-end fundsInvestment Risk: Performance results reflect past performance and is no assurance that a Fund will meet its investment objective. Market Risk: The market value, net asset value (NAV) and distribution rate of a fund’s shares will fluctuate with market conditions. Leverage Risk: Each Fund’s use of leverage (borrowing to increase invest-ments) creates the possibility of higher volatility and greater risk for the Fund’s per share NAV, market price, distributions and returns. Credit Risk: Refers to the possibility that the issuer of the bond will not be able to make principal and interest payments (default).
Statement of risk
Each research analyst primarily responsible for the content of this research report, in whole or in part, certifies that with respect to each security or issuer that the analyst covered in this report: (1) all of the views expressed accurately reflect his or her personal views about those securities or issu-
Prepayment Risk: Issuers may exercise their option to prepay principal ear-lier than scheduled, forcing the Fund to reinvest in lower-yielding securities.Interest Rate Risk: Fixed-income securities will decline in value if market interest rates rise. Reinvestment Risk: If market interest rates decline, income earned from the Fund’s portfolio may be reinvested at rates below that of the original bond that generated the income. Liquidity Risk: This is the risk that the fund may not be able to sell securi-ties in its portfolio at the time or price desired by the Fund. Below Investment Grade Risk: Investments rated below investment grade (typically referred to as “junk”) are generally subject to greater price volatil-ity and illiquidity than higher rated investments. Management risk: The risk that investment management decisions may not produce the desired results.
Analyst certificationers; and (2) no part of his or her compensation was, is, or will be, directly or indirectly, related to the specific recommendations or views expressed by that research analyst in the research report.
UBS does and seeks to do business with issuers covered in its research reports. As a result, investors should be aware that the firm may have a con-flict of interest that could affect the objectivity of UBS research reports.
For a complete set of required disclosures relating to the companies that are the subject of this report, please mail a request to UBS CIO Wealth Man-agement Research Business Management, 1285 Avenue of the Americas, 20th Floor, Avenue of the Americas, New York, NY 10019.
20 NOVEMBER 2018 Municipal Market Guide
Required disclosures
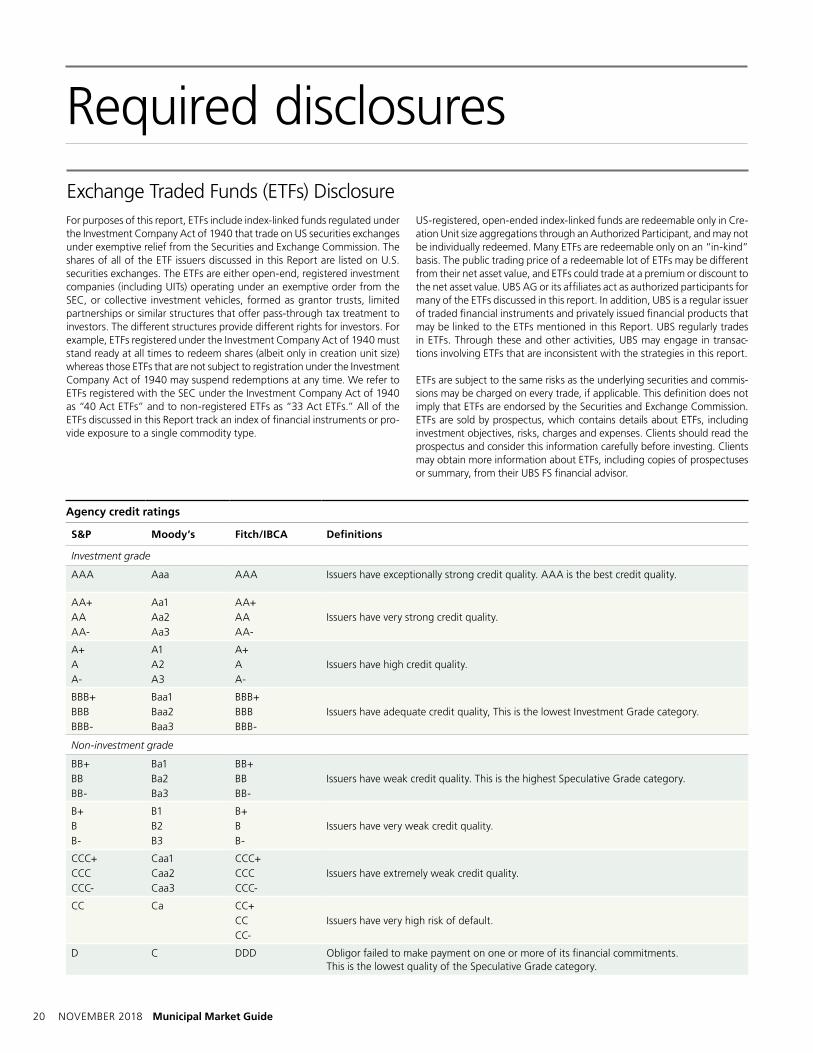
Agency credit ratings
S&P Moody’s Fitch/IBCA Definitions
Investment grade
AAA Aaa AAA Issuers have exceptionally strong credit quality. AAA is the best credit quality.
AA+ Aa1 AA+AA Aa2 AA Issuers have very strong credit quality.AA- Aa3 AA-
A+ A1 A+A A2 A Issuers have high credit quality.A- A3 A-
BBB+ Baa1 BBB+BBB Baa2 BBB Issuers have adequate credit quality, This is the lowest Investment Grade category.BBB- Baa3 BBB-
Non-investment grade
BB+ Ba1 BB+BB Ba2 BB Issuers have weak credit quality. This is the highest Speculative Grade category.BB- Ba3 BB-
B+ B1 B+B B2 B Issuers have very weak credit quality.B- B3 B-
CC Ca CC+CC Issuers have very high risk of default.CC-
D C DDD Obligor failed to make payment on one or more of its financial commitments. This is the lowest quality of the Speculative Grade category.
For purposes of this report, ETFs include index-linked funds regulated under the Investment Company Act of 1940 that trade on US securities exchanges under exemptive relief from the Securities and Exchange Commission. The shares of all of the ETF issuers discussed in this Report are listed on U.S. securities exchanges. The ETFs are either open-end, registered investment companies (including UITs) operating under an exemptive order from the SEC, or collective investment vehicles, formed as grantor trusts, limited partnerships or similar structures that offer pass-through tax treatment to investors. The different structures provide different rights for investors. For example, ETFs registered under the Investment Company Act of 1940 must stand ready at all times to redeem shares (albeit only in creation unit size) whereas those ETFs that are not subject to registration under the Investment Company Act of 1940 may suspend redemptions at any time. We refer to ETFs registered with the SEC under the Investment Company Act of 1940 as “40 Act ETFs” and to non-registered ETFs as “33 Act ETFs.” All of the ETFs discussed in this Report track an index of financial instruments or pro-vide exposure to a single commodity type.
Exchange Traded Funds (ETFs) DisclosureUS-registered, open-ended index-linked funds are redeemable only in Cre-ation Unit size aggregations through an Authorized Participant, and may not be individually redeemed. Many ETFs are redeemable only on an “in-kind” basis. The public trading price of a redeemable lot of ETFs may be different from their net asset value, and ETFs could trade at a premium or discount to the net asset value. UBS AG or its affiliates act as authorized participants for many of the ETFs discussed in this report. In addition, UBS is a regular issuer of traded financial instruments and privately issued financial products that may be linked to the ETFs mentioned in this Report. UBS regularly trades in ETFs. Through these and other activities, UBS may engage in transac-tions involving ETFs that are inconsistent with the strategies in this report.
ETFs are subject to the same risks as the underlying securities and commis-sions may be charged on every trade, if applicable. This definition does not imply that ETFs are endorsed by the Securities and Exchange Commission. ETFs are sold by prospectus, which contains details about ETFs, including investment objectives, risks, charges and expenses. Clients should read the prospectus and consider this information carefully before investing. Clients may obtain more information about ETFs, including copies of prospectuses or summary, from their UBS FS financial advisor.
Municipal Market Guide NOVEMBER 2018 21
DisclaimerIn certain countries UBS AG is referred to as UBS SA. This publication is for our clients’ information only and is not intended as an offer, or a solicitation of an offer, to buy or sell any investment or other specific product. It does not constitute a personal recommendation or take into account the particular investment objectives, financial situation and needs of any specific recipient. We recommend that recipients take financial and/or tax advice as to the implications of investing in any of the products mentioned herein. We do not provide tax advice. The analysis contained herein is based on numerous assumptions. Different assumptions could result in materially different results. Other than disclosures relating to UBS AG, its subsidiaries and affiliates, all information expressed in this document were obtained from sources believed to be reliable and in good faith, but no representation or warranty, express or implied, is made as to its accuracy or completeness. All information and opinions are current only as of the date of this report, and are subject to change without notice. This publication is not intended to be a complete statement or summary of the securities, markets or developments referred to in the report. Opinions may differ or be contrary to those expressed by other business areas or groups of UBS AG, its subsidiaries and affiliates. Research publications from Chief Investment Office Global Wealth Management (CIO GWM), formerly known as CIO Americas, Wealth Management, are written by UBS Global Wealth Management, a Business Division of UBS AG (UBS) or an affiliate thereof (collectively, UBS). UBS Investment Research is written by UBS Investment Bank. Except for economic forecasts, the research process of CIO GWM is independent of UBS Investment Research. As a consequence research methodologies applied and assumptions made by CIO GWM and UBS Investment Research may differ, for example, in terms of investment horizon, model assumptions, and valuation methods. Therefore investment recommendations independently provided by the two UBS research organizations can be different. The analyst(s) responsible for the preparation of this report may interact with trading desk personnel, sales personnel and other constituencies for the purpose of gathering, synthesizing and interpreting market information. The compensation of the analyst(s) who prepared this report is determined exclusively by research management and senior management (not including investment banking). Analyst compensation is not based on investment banking, sales and trading or principal trading revenues, however, compensation may relate to the revenues of UBS as a whole, of which investment banking, sales and trading and principal trading are a part.
UBS AG, its affiliates, subsidiaries and employees may trade as principal and buy and sell securities identified herein. At any time, investment decisions (including whether to buy, sell or hold securities) made by UBS and its employees may differ from or be contrary to the opinions expressed in UBS research publications. Some investments may not be readily realizable since the market in the securities is illiquid and therefore valuing the investment and identifying the risk to which you are exposed may be difficult to quantify. UBS relies on information barriers to control the flow of information contained in one or more areas within UBS, into other areas, units, groups or affiliates of UBS. Some investments may be subject to sudden and large falls in value and on realization you may receive back less than you invested or may be required to pay more. Changes in foreign currency exchange rates may have an adverse effect on the price, value or income of an investment. Past performance of an investment is not a guide to its future performance. Additional information will be made available upon request. This report is for distribution only under such circumstances as may be permitted by applicable law. The securities described herein may not be eligible for sale in all jurisdictions or to all categories of investors. Distributed to US persons by UBS Financial Services Inc. or UBS Securities LLC, subsidiaries of UBS AG. UBS Switzerland AG, UBS Deutschland AG, UBS Bank, S.A., UBS Brasil Administradora de Valores Mobiliarios Ltda, UBS Asesores Mexico, S.A. de C.V., UBS Securities Japan Co., Ltd, UBS Wealth Management Israel Ltd and UBS Menkul Degerler AS are affiliates of UBS AG. UBS Financial Services Incorporated of PuertoRico is a subsidiary of UBS Financial Services Inc. UBS Financial Services Inc. accepts responsibility for the content of a report prepared by a non-US affiliate when it distributes reports to US persons. All transactions by a US person in the securities mentioned in this report should be effected through a US-registered broker dealer affiliated with UBS, and not through a non-US affiliate. The contents of this report have not been and will not be approved by any securities or investment authority in the United States or elsewhere. UBS Financial Services Inc. is not acting as a municipal advisor to any municipal entity or obligated person within the meaning of Section 15B of the Securities Exchange Act (the “Municipal Advisor Rule”) and the opinions or views contained herein are not intended to be, and do not constitute, advice within the meaning of the Municipal Advisor Rule.
Version as per April 2018.
UBS specifically prohibits the redistribution or reproduction of this material in whole or in part without the prior written permission of UBS. UBS accepts no liability whatsoever for any redistribution of this document or its contents by third parties.