En colaboración con: Nº 8 8 JUNIO 2018 Autores: Jorge Olcina Cantos, Andrés Campos Rosique, Ignacio Casals del Busto, Juan Ayanz López-Cuervo, Miguel Rodríguez Mateos, Montse Martínez Puentes Otras colaboraciones: Joaquín Marco Terres, Agustín Plaza Martínez, José Ramón Moya Botella, Luis Cutillas Lozano RESILIENCIA EN EL CICLO URBANO DEL AGUA. EXTREMOS PLUVIOMÉTRICOS Y ADAPTACIÓN AL CAMBIO CLIMÁTICO EN EL ÁMBITO MEDITERRÁNEO
Transcript
Nº 8
8JUNE 2018
Authors:
Other collaborators: "* )
RESILIENCE IN THE URBAN WATER CYCLE. RAINFALL EXTREMES AND ADAPTING TO CLIMATE CHANGE IN THE MEDITERRANEAN AREA
In collaboration with:
Jorge Olcina Cantos, Andrés Campos Rosique, Ignacio Casals del Busto, Juan Ayanz López-Cuervo, Miguel Rodríguez Mateos, Montse Martínez Puentes
Joaquín Marco Terres, Agustín Plaza Martínez, José Ramón Moya Botella, Luis Cutillas Lozano
Nº 8
8JUNIO 2018
Autores: Jorge Olcina Cantos, Andrés Campos Rosique, Ignacio Casals del Busto, Juan Ayanz López-Cuervo, Miguel Rodríguez Mateos, Montse Martínez PuentesOtras colaboraciones: Joaquín Marco Terres, Agustín Plaza Martínez, José Ramón Moya Botella, Luis Cutillas Lozano"* )
RESILIENCIA EN EL CICLO URBANO DEL AGUA. EXTREMOS PLUVIOMÉTRICOS Y ADAPTACIÓN AL CAMBIO CLIMÁTICO EN EL ÁMBITO MEDITERRÁNEO
En colaboración con:
8
Nº 8
8JUNIO 2018
Autores: Jorge Olcina Cantos, Andrés Campos Rosique, Ignacio Casals del Busto, Juan Ayanz López-Cuervo, Miguel Rodríguez Mateos, Montse Martínez PuentesOtras colaboraciones: Joaquín Marco Terres, Agustín Plaza Martínez, José Ramón Moya Botella, Luis Cutillas Lozano"* )
RESILIENCIA EN EL CICLO URBANO DEL AGUA. EXTREMOS PLUVIOMÉTRICOS Y ADAPTACIÓN AL CAMBIO CLIMÁTICO EN EL ÁMBITO MEDITERRÁNEO
En colaboración con:
Nº 8
8JUNE 2018
Authors:
Other collaborators: "* )
RESILIENCE IN THE URBAN WATER CYCLE. RAINFALL EXTREMES AND ADAPTING TO CLIMATE CHANGE IN THE MEDITERRANEAN AREA
In collaboration with:
Jorge Olcina Cantos, Andrés Campos Rosique, Ignacio Casals del Busto, Juan Ayanz López-Cuervo, Miguel Rodríguez Mateos, Montse Martínez Puentes
Joaquín Marco Terres, Agustín Plaza Martínez, José Ramón Moya Botella, Luis Cutillas Lozano
RESILIENCIA EN EL CICLO URBANO DEL AGUA. EXTREMOS PLUVIOMÉTRICOS Y ADAPTACIÓN AL CAMBIO CLIMÁTICO EN EL ÁMBITO MEDITERRÁNEO
Nº 8
8 Autores: Jorge Olcina Cantos, Andrés Campos Rosique, Ignacio Casals del Busto, Juan Ayanz López-Cuervo, Miguel Rodríguez Mateos, Montse Martínez PuentesOtras colaboraciones: Joaquín Marco Terres, Agustín Plaza Martínez, José Ramón Moya Botella, Luis Cutillas Lozano
la Universidad de Alicante y responsable del Instituto de Climatología de la Universidad de Alicante. Actualmente, presidente de Asociación de Geógrafos de España
• AndrésCamposRosique,ingenierodeProyectosdeOficinaTécnica,Aguas de Alicante
Agua Reutilizada de Aguas de Alicante• LuisCutillasLozano,técnicodeExplotacióndeSaneamientodeAguasde
Alicante
SUMARIO PÁG
1. INTRODUCCIÓN: CLIMA, CAMBIO CLIMÁTICO, AGUA Y RESILIENCIA URBANA
2. EL CLIMA MEDITERRÁNEO, UN CLIMA DE ELEVADO CONFORT PERO CON EXTREMOS PLUVIOMÉTRICOS
2.1. SEQUÍAS Y ABASTECIMIENTOS DE AGUA2.2. EPISODIOS DE LLUVIA EXTREMA EN EL CLIMA MEDITERRÁNEO2.3. INFLUENCIA DEL CAMBIO CLIMÁTICO2.4. RETOS PARA EL CICLO URBANO DEL AGUA
3. RECURSOS HÍDRICOS
3.1. ANTECEDENTES HISTÓRICOS DEL ABASTECIMIENTO DE ALICANTE3.2. LAS GARANTÍAS DE SUMINISTRO
3.2.1. Evolución y combinación de fuentes de abastecimiento3.2.2.Eficienciaenelusodelosrecursoshídricos
3.3. LA REUTILIZACIÓN DE AGUA PARA USOS URBANOS EN ALICANTE3.3.1. El desarrollo de la doble red de agua reutilizada3.3.2.Impactodelaguaregeneradaenelámbitourbano3.3.3.Contextoeconómicodelareutilización3.3.4.Factoresdeéxito
4. EL DRENAJE URBANO
4.1. ANTECEDENTES HISTÓRICOS. EVOLUCIÓN URBANA DE ALICANTE: UN PROCESO DE “DIGESTIÓN” PROGRESIVA DE BARRANCOS EN SU TRAMA URBANA 4.2. ORÍGENES Y DESARROLLO DE LA RED DE DRENAJE EN ALICANTE
4.2.1.Primerasactuacioneshistóricassobreeldrenaje4.2.2. El crecimiento del puerto de Alicante y su impacto sobre el drenaje urbano4.2.3. El plan del arquitecto José Guardiola
4.3. HISTORIA RECIENTE Y EPISODIOS SINGULARES4.4. EL CAMBIO DE PARADIGMA: DE LA VISIÓN HIGIENISTA A LA PROTECCIÓN FRENTE A LAS INUNDACIONES Y LA APUESTA POR LA SOSTENIBILIDAD AMBIENTAL
4.4.1. El Plan Antirriadas de la ciudad de Alicante4.4.2. Actuaciones complementarias del Plan contra Inundaciones de Alicante
5
14
15161926
27
273030313636384042
44
45
4849
505052
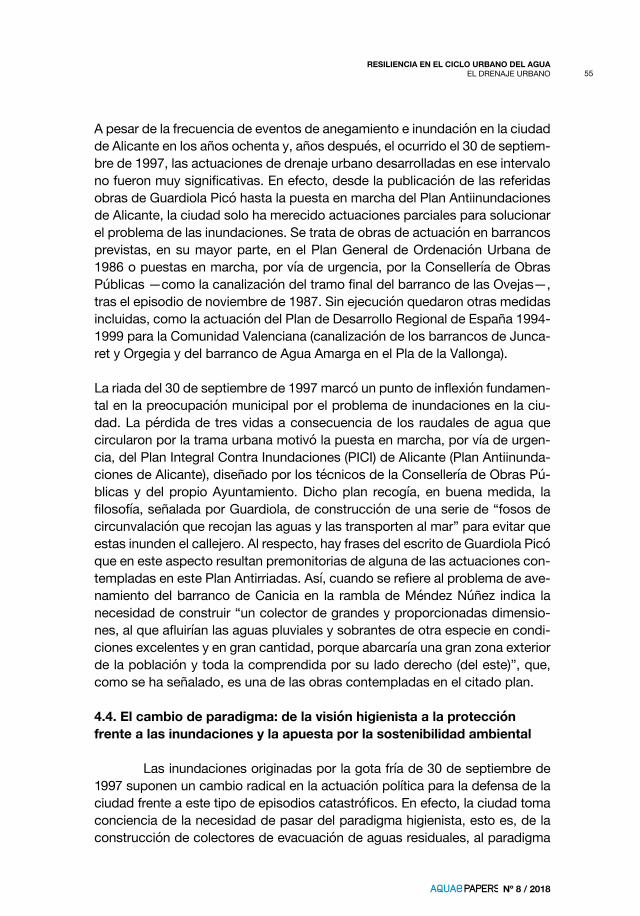
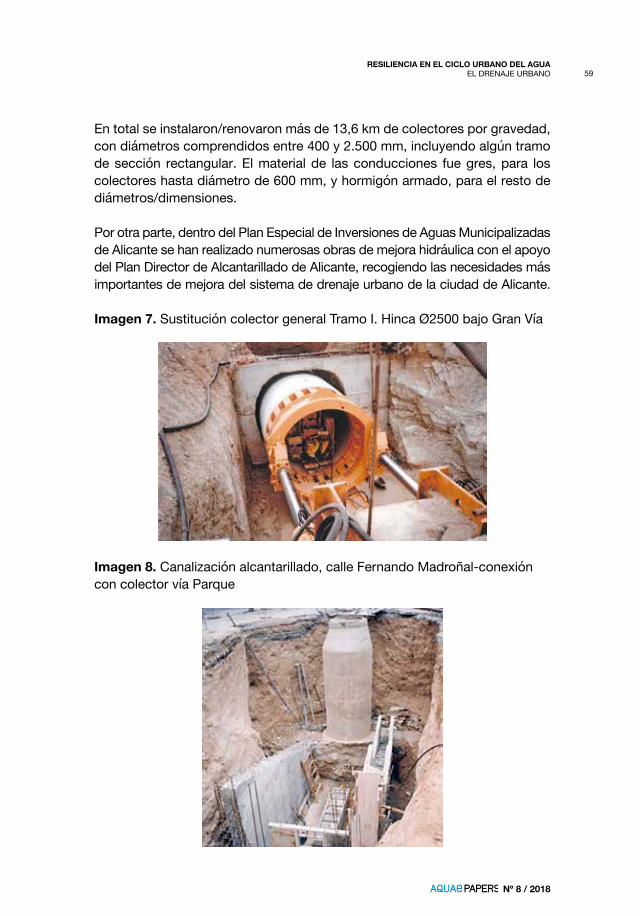
5556
57
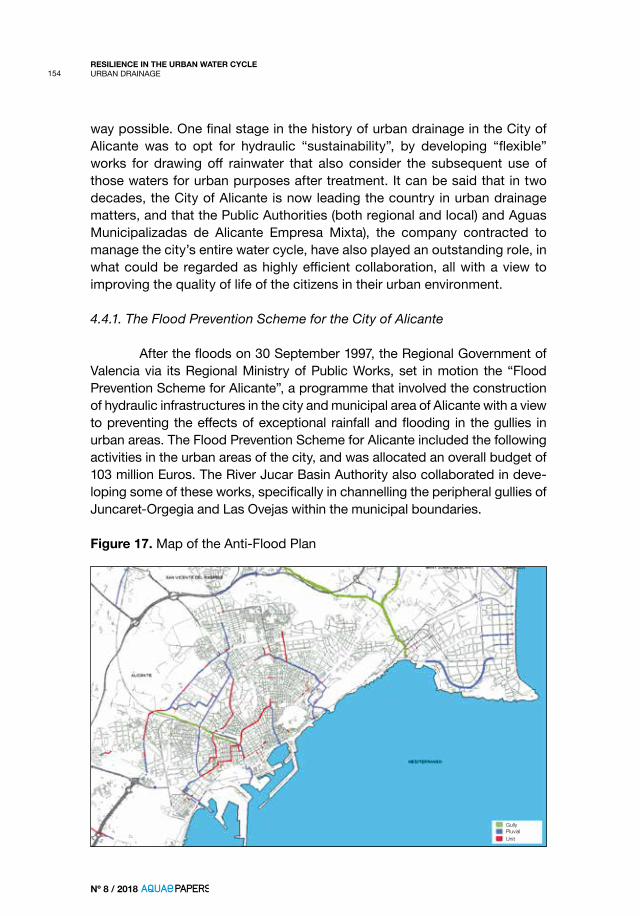
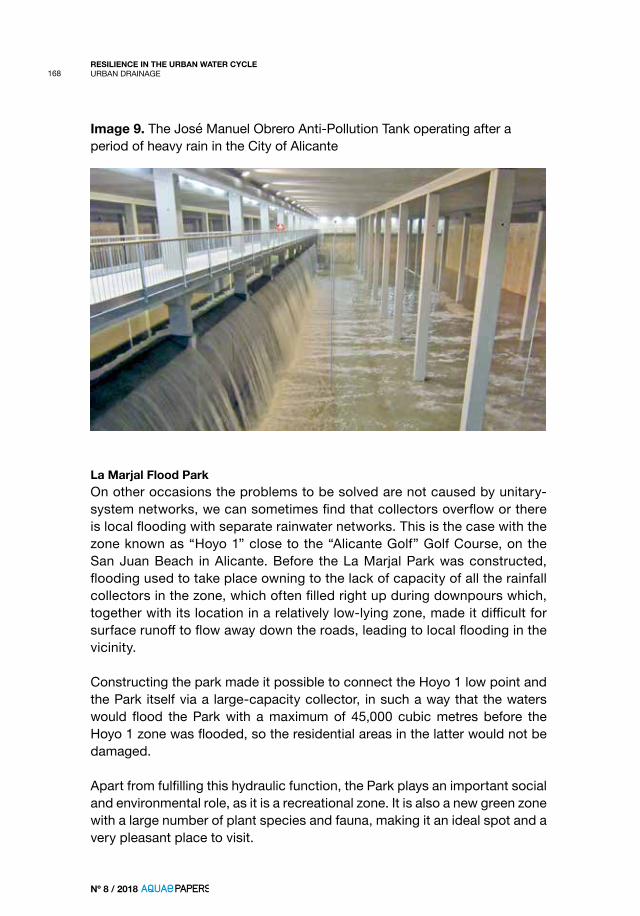
4.4.3. Gestión avanzada del drenaje urbano4.4.4. Actuaciones singulares: el depósito anticontaminación José Manuel Obrero y el parque inundable La Marjal4.4.5. Diagnóstico del riesgo de inundaciones en la ciudad de Alicante: el episodio de lluvias muy intensas del 13 de marzo de 2017
4.5. RETOS FUTUROS DEL DRENAJE URBANO. LOS SISTEMAS URBANOS DE DRENAJE SOSTENIBLE (SUDS) COMO MEDIDAS DE ADAPTACIÓN AL CAMBIO CLIMÁTICO
5. CONCLUSIONES
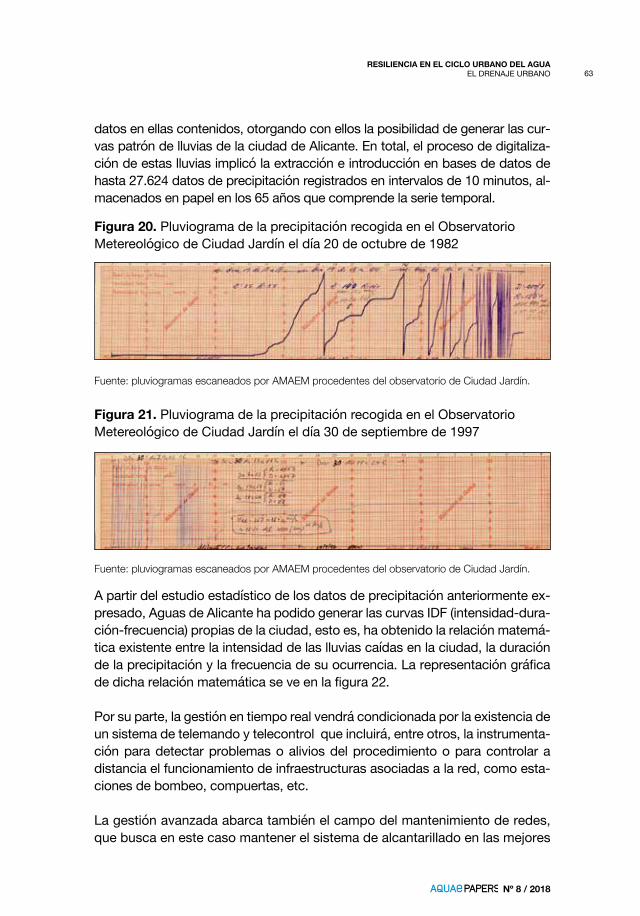
6. ÍNDICE DE ILUSTRACIONES
7. BIBLIOGRAFÍA
AUTORES
ENGLISH VERSION
61
67
72
76
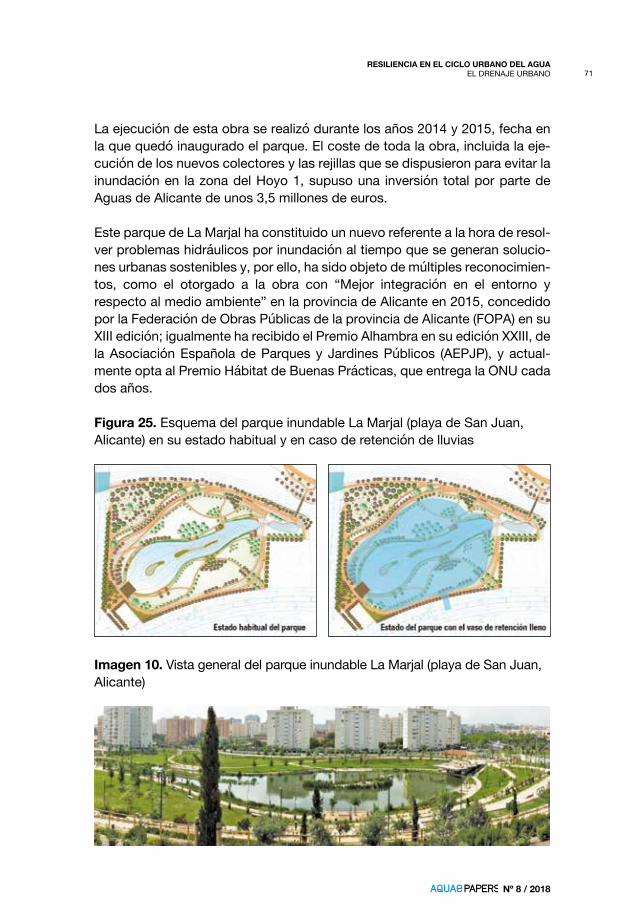
82
85
89
96
99
5
Nº 8 / 2018
RESILIENCIA EN EL CICLO URBANO DEL AGUAINTRODUCCIÓN: CLIMA, CAMBIO CLIMÁTICO, AGUA Y RESILIENCIA URBANA
1. INTRODUCCIÓN: CLIMA, CAMBIO CLIMÁTICO, AGUA Y RESILIENCIA URBANA
El cambio climático, los extremos pluviométricos que conlleva sudesarrolloyquehancomenzadoyaamanifestarse,seconvierteenelejeprincipaldeactuacióndelagestióndelaguaenlasáreasurbanas.Laadap-tación de infraestructuras de abastecimiento y de evacuación de pluviales a lanuevarealidadclimáticaqueseestimaparalosterritoriosdeclimamedi-terráneoresultanecesariasisequiereprepararlaciudadparaaumentarsuresistencia y resiliencia a las condiciones ambientales del futuro inmediato. LaciudaddeAlicante,enellitoralmediterráneoespañol,hadesarrolladoenlas dos últimas décadas una serie de actuaciones orientadas a disminuir los riesgosdelaguayprepararse,deestemodo,alescenariodelcambioclimá-tico. Se analizan en este trabajo las causas que originan la peligrosidad cli-máticarelacionadaconlosextremospluviométricosenelámbitomediterrá-neo, destacando el caso alicantino como ejemplo de territorio con elevado impactodelosriesgosclimáticosydelcambioclimático,debidoasusaltosnivelesdevulnerabilidadyexposición.Yseabordanlassoluciones—histó-ricasyactuales—llevadasacaboparadisminuirelimpactodeinundacionesysequías,apartirdelanálisisdetalladodelasactuacionesrealizadasenelmediourbano,quehanevolucionadoalolargodeltiempodesdelassolucio-nes meramente estructurales a las basadas en la integración paisajística y la mejora de la resiliencia urbana, en virtud de la incorporación de los principios delasostenibilidadambiental,territorialyderesponsabilidadsocialquehanguiado las actuaciones de la sociedad que gestiona el ciclo integral del agua enlaciudaddeAlicante.Todoellocomomodelodebuenasprácticasaim-pulsaraúnmásenelfuturo,quepuedaservirdeejemploparaentornosur-banosmediterráneosconunaproblemáticaclimática,ambientalyterritorialsimilar.
En2018másdelamitaddelapoblaciónmundialviveenciudades.EnEu-ropa esa proporción se eleva al 75%. El porcentaje de la población mundial residenteenciudadesseelevaráal70%enapenastresdécadas.LaTierrasehaconvertidoenunespaciogeográficodominadoporlaciudad.Enape-nasmediosiglo,latransformaciónhasidoacelerada,brutal.Sehapasadodelprotagonismoprincipaldelcampohastamediadosdelpasadosigloalpredominio de la ciudad en los procesos de transformación territorial que va amarcarelfuturodelplaneta.Estecambiohasupuestomejorasindiscutiblesparalahumanidad,perohatenidotambiénuncosteimportanteparalapro-piasalubridaddelasuperficieterrestre.Unodeestosefectos,seguramenteelmásdestacado,hasidolacontaminaciónatmosféricacongasesderiva-dos de la quema de combustibles fósiles, cuyo impacto directo en el actual
6
Nº 8 / 2018
RESILIENCIA EN EL CICLO URBANO DEL AGUAINTRODUCCIÓN: CLIMA, CAMBIO CLIMÁTICO, AGUA Y RESILIENCIA URBANA
procesodecalentamientoclimáticomundialesevidente.Elcambioclimáticoporelefectoinvernaderoesunprocesoincontestablecientíficamenteenlaactualidad,queestáprovocandocambiosenlascondicionesclimáticasha-bitualesdelasregionesdelmundo.Laregiónmediterránea,declimahabi-tualmente confortable y salutífero, registra en ocasiones episodios de rango extraordinario que condicionan la vida y la economía de sus habitantes.Inundacionesysequíassonlospeligrosatmosféricosmáshabitualesenelámbitomediterráneo,quehanobligadoalserhumano,desdeépocashistó-ricas, a adaptar la implantación de actividades económicas y de los núcleos urbanosaestosextremosclimáticos.
Laconvivenciaconlasinundacionesysequíasenelmundomediterráneohaexperimentadocambios a lo largode la historia.De la adaptaciónde losusosdelsueloylasciudadesaestospeligrosclimáticos,quefuelamedidahabitualenlassociedadestradicionalesdebaseagraria,sepasóalosinten-tosdedominacióndelanaturalezaporpartedelassociedadesmediterrá-neas, merced a las mejoras de la ciencia y de la técnica. Esta actitud frente almediohasidocaracterísticahastafinalesdelacenturiapasada,conunimpacto importante sobre el territorio. A partir de 1992, la Cumbre de la Tie-rra de Río de Janeiro inicia unas nuevas maneras en la relación entre el ser humanoy lanaturaleza,quesemanifiestanen laapuestadecididapor lasostenibilidad como principio de acción de las actuaciones en el medio.
Enlaactualidad,existeunaconvivencianecesariaentrelasactuacioneses-tructurales y las propuestas de sostenibilidad ambiental y territorial en las accionesdemitigaciónyadaptaciónalosextremosatmosféricosprincipalesdelmundomediterráneo.Estoesespecialmentenotableenlasáreasurba-nas,donde,dehecho,lasaccionesestructuraleshanidoreduciendosuim-pactosobreelterritorio,adaptándosealosnuevosprincipiosdedesarrolloacorde con los rasgos y posibilidades del medio.
Sehapasado,pues,delencauzamientodecaucesfluvialesodelasconduc-cionesdeaguadeimprontaregional(trasvases)comoactuacionesbásicasparalareduccióndelriesgodeinundacionesysequíasenlosámbitosurba-nosmediterráneos,aldesarrollodeparquesinundables,restauraciónfluvial,depósitospluvialesolapropiaadaptacióndeldiseñourbanoadichosextre-mosatmosféricos,comoejemplosdebuenasprácticasdeadaptaciónsos-tenible orientadas a minimizar las consecuencias de los mismos.
RESILIENCIA EN EL CICLO URBANO DEL AGUAINTRODUCCIÓN: CLIMA, CAMBIO CLIMÁTICO, AGUA Y RESILIENCIA URBANA
entrada,debeseñalarsequeunaatmósferamáscálidaessiempreunaat-mósferademovimientosdemasasdeairemásenérgicosycontrastados,enlabúsquedadeunequilibrio—teórico—dentrodelsistemadebalanceenergético global y/o regional. De manera que el calentamiento térmico planetario,quevieneregistrándosedesdehacetresdécadas,favoreceeldesarrollodecambiosdetiempomásrápidosycontrastados,ydeeventosderangoextremodeformacadavezmásfrecuente.Estacuestiónyasepercibe en las secuencias sinópticas que se registran en nuestro país (Gil OlcinayOlcinaCantos,2017).Losmodelosdecambioclimáticoseñalan,además, que las áreas con climamediterráneo tienen una probabilidadmuyelevadadeexperimentarenlaspróximasdécadaslassiguientesalte-raciones:
• Subidadetemperaturamedia,quesemanifestarátantoenlasmáximasdiurnascomoenlasmínimasnocturnas.Esunhechoprobadoelincre-mento importante que han experimentado las denominadas “nochestropicales”(temperaturaporencimade20ºC)enellitoralmediterráneoespañol.Desde1980,elnúmerodeestasnochesdeelevadodiscomfort climáticosehamultiplicadoportres,yenlaactualidadseregistramásde70jornadasconestetipodenochesdecalor.Endefinitiva,seasisteyaaunapérdidadeconfortclimáticoquepodríasermayorenlaspróximasdécadas.
• Mayor irregularidad en las precipitaciones y una tendencia general al des-censoenlosvaloresanuales.Esunhechocomprobado,conlosdatosde lluviade lasseriesclimáticasen la fachadamediterráneaespañola.Hay dos aspectos de interés para la adaptación de las ciudades al cam-bioclimáticoenrelaciónconestoscambiosenlasprecipitaciones:estálloviendo menos en la cabecera de los ríos que tienen su nacimiento en la cordillera Ibérica (Júcar, Turia y Tajo), y esta reducción de caudales en cabeceraesmásnotableenprimavera,queesunaestaciónfundamentalparalaplanificacióndeusosdelaguadelosmesesdeverano(regadíosy gasto turístico). Y en segundo lugar, las lluvias torrenciales, caracterís-ticasdelosotoñoseneláreamediterránea,soncadavezmenosabun-dantesensucuantíatotal,perodemayorintensidadhoraria;esdecir,noson necesarias cantidades enormes de lluvia (superiores a 200 mm) para ocasionarproblemasde inundacionesen lasáreasurbanas, comoerahabitualenladécadadelossetenta,ochentaonoventadelpasadosiglo.Ahora,conlluviasde50-75mm,queprecipitanenapenasunahora,essuficienteparaocasionarproblemasdeanegamiento,loqueobligaare-pensar el diseño de sistemas urbanos de evacuación de agua pluvial para iradaptándoloaestanuevaformadellover.
8
Nº 8 / 2018
RESILIENCIA EN EL CICLO URBANO DEL AGUAINTRODUCCIÓN: CLIMA, CAMBIO CLIMÁTICO, AGUA Y RESILIENCIA URBANA
• ElmarMediterráneo, nuestra principal seña de identidad geográfica yculturalenlasregionesypaísesribereñosdeestemar,estáexperimen-tando cambios acelerados que van a condicionar, también, el comporta-mientoclimáticofuturoenlasregionesribereñas.Lomásdestacadoeselaumentodelatemperaturaenlasuperficiemarinaqueseharegistradodesde 1980: por término medio, 1 ºC en toda la cuenca occidental del Mediterráneo,aunquehaysectorescon2ºCdeaumento,enalgomásde tres décadas. Este aumento es muy notable en primavera y otoño, y prolongaelmantenimientodeaguascálidasomuycálidaspropiasdelve-ranohacialosmesescontiguosdeestasdosestacionesdelaño.Demaneraque las condicionesde inestabilidadpotencial (aguas cálidas delmar)semantienendurantemásmesesdelaño,consuefectoeneldesarrollomásprobabledeeventosdelluviaintensaduranteunperiododetiempomayor. Por tanto, el calendario de lluvias torrenciales en el litoral medite-rráneoespañolyanoselimitaalotoño,sinoqueestetipodeextremoplu-viométricopuededesarrollarseasimismo,enprimavera,alfinaldeotoñoy comienzos del invierno, así como en los meses del verano, siempre y cuando se desarrollen las condiciones atmosféricas favorables.
Laadaptacióndelasciudadesalcambioclimáticonoesunacuestiónespe-cíficadel nuestropaís odel litoralmediterráneoespañol, perodadas susespecialescondicionesclimáticas,actualesyfuturas,afectaatodoelplane-ta. Es importante reconocer, por parte de Administraciones y ciudadanos, lanecesidaddeponerenmarchamedidasqueaumentenlaresistenciaylaresilienciadelasáreasurbanasdeláreamediterráneaespañola,debidoasuelevadavulnerabilidadyexposiciónalosextremosatmosféricosprincipales(inundacionesysequías)ya laevolución futuraquepuedenexperimentarestosriesgosenelcontextodelcalentamientoclimáticoterrestre.Esciertoquesehandiseñadoy realizadoactuacionesenestesentidoendiversasciudadesdeestaregiónmediterráneaenEspaña,peroquedatodavíamuchoporhacer.
RESILIENCIA EN EL CICLO URBANO DEL AGUAINTRODUCCIÓN: CLIMA, CAMBIO CLIMÁTICO, AGUA Y RESILIENCIA URBANA
español. Se trata de actuaciones que combinan obra civil de poco impacto ambiental y adecuación al entorno urbano, adoptando criterios de integra-ciónpaisajística,asícomomedidasdeplanificaciónterritorialefectivaincor-poradas a los documentos de planeamiento urbanístico.
Algunos ejemplos son muy interesantes, como la aprobación de la política detejadosverdesenCopenhagueoAmberes;laconstruccióndeviviendaspalafíticas en Nueva Orleans para evitar desastres como el ocasionado por elhuracánKatrinaen2005;laconstruccióndeunpabellónmultiusosflotan-teenRotterdamresistentealascrecidasfluvialesyelrecrecimientodepól-deres potencialmente afectables por la acción combinada de inundación y oleajesintensosenáreascosterasendiversasáreasdeHolanda1;yedifica-ciones sobreelevadas en Helsinki, en el marco del Proyecto BaltCICA2, pues-toenmarchaporlospaísesribereñosdelmarBálticoparalaadaptaciónalcambioclimático.
Por su impacto territorial, al tratarse de una gran megalópolis, es necesario destacar lapuestaenmarchadelPlanNYC:A Greener, Greater New York, puestoenmarchaen2007comoplanestratégicoparalaciudad,conhori-zonte 2030 y reformulado en 2011. El PlanNYC contiene 132 iniciativas y 400 objetivosconcretosadesarrollarcondichohorizontetemporal.Juntoaotrosaspectos relativos a vivienda, espacios verdes, agua, residuos, calidad del aireymovilidad,elplanincluyeunapartadoespecíficoalaadaptacióndelamegalópolisalcambioclimático.Endichoapartadoseincluyen13iniciativasde mitigación y adaptación entre las que destacan: la reducción del 30% de las emisiones de gases de efecto invernadero respecto al nivel de emisiones de2005,en2030;laactualización,juntoalaFEMA,delosmapasdeinunda-cióndelaciudadparaelperiododeretornode100años;laactualizacióndelasnormasdeconstrucción;elfomentodemedidasdeprotecciónfrentealas inundaciones en las viviendas en acción coordinada con las compañías deseguros;lareduccióndelaisladecalorurbano;laintegracióndelaspro-yeccionesdelcambioclimáticoenlaplanificacióndelagestióndelasemer-gencias y la comunicación del riesgo a las comunidades de la ciudad para aumentarsuresistenciafrentealcambioclimáticoysuspeligrosatmosféri-cos asociados.
La Unión Europea aprobó en 2013 la Estrategia de Adaptación al Cambio Climáticoque,a travésdeochoacciones,persigueconvertira lospaíseseuropeosenterritoriosmásresilientesanteloscambiosprevistosenlas
RESILIENCIA EN EL CICLO URBANO DEL AGUAINTRODUCCIÓN: CLIMA, CAMBIO CLIMÁTICO, AGUA Y RESILIENCIA URBANA
condicionesclimáticas.Paradesarrollarestasaccionessehanestablecidotres prioridades a desarrollar en los años inmediatos: implementar las actua-ciones previstas en los Estados miembros, mejorar la información sobre el cambioclimáticoparapodertomardecisionesfundadasyactuardeformaprioritaria sobre sectores especialmente vulnerables. La plataforma Clima-te-Adaptreúne,enestecontexto,lainformaciónsobrelosproyectoseuro-peosdeadaptaciónalcambioclimáticoqueseestándesarrollandoendife-rentes países en los últimos años.
Resulta destacado el proyecto de adaptación al cambio climático que seestállevandoacaboenBerlín.Conelobjetivodereducirelefectodelaisladecalorurbana,enlacapitalalemanasehaaprobadounaordenanzamuni-cipal para la aplicación de un indicador para el desarrollo de zonas verdes en manzanasyedificios,quetieneencuentaelvolumenconstruidoylaanti-güedaddelosedificios.EselllamadoBiotopeFactorArea(BAF),desarrolla-do para “verdear” los barrios del centro de la ciudad, y que tiene como obje-tivoprincipalasegurarqueunaproporcióndeterminadadeunáreaedificadase deje sin desarrollar y se cubra de vegetación. El programa BAF pretende compatibilizaraltasdensidadesdeedificaciónenelcentrodeBerlínconeldesarrollo de la infraestructura verde de la ciudad.
Sobre labasede indicadorBAF,sehandesarrolladoprogramassimilarespara el desarrollo urbano de Malmö (Suecia, 2001) o de la ciudad de Seattle (EstadosUnidos,2007).KazmierczakyCarter(2010)hananalizadodiversasiniciativas mundiales desarrolladas en los últimos años y que tienen como principio de actuación la aplicación de indicadores de “verdeamiento” de áreasurbanasparalimitarlosefectosdelaisladecaloromejorarelconfortclimáticogeneraldelasciudades.Setratadeejemplosdebuenasprácticasde desarrollo urbanístico orientadas a la mitigación de efectos que puede originar el cambio en las condiciones climáticas futuras, que son lasquemayoresresultadosestánteniendocomoaccionesefectivasdeadaptaciónalcambioclimáticoenlaescalalocal.Enestalíneadeactuación,eincluidaasimismoenlasiniciativasdelaplataformaClimate-Adapt,seestáaplicandoestafilosofíadeincrementarlaszonasverdesurbanasenStuttgart(Alema-nia), dentro del proyecto municipal de creación de un corredor de ventilación verde para reducir el impacto térmico de la isla de calor urbana.
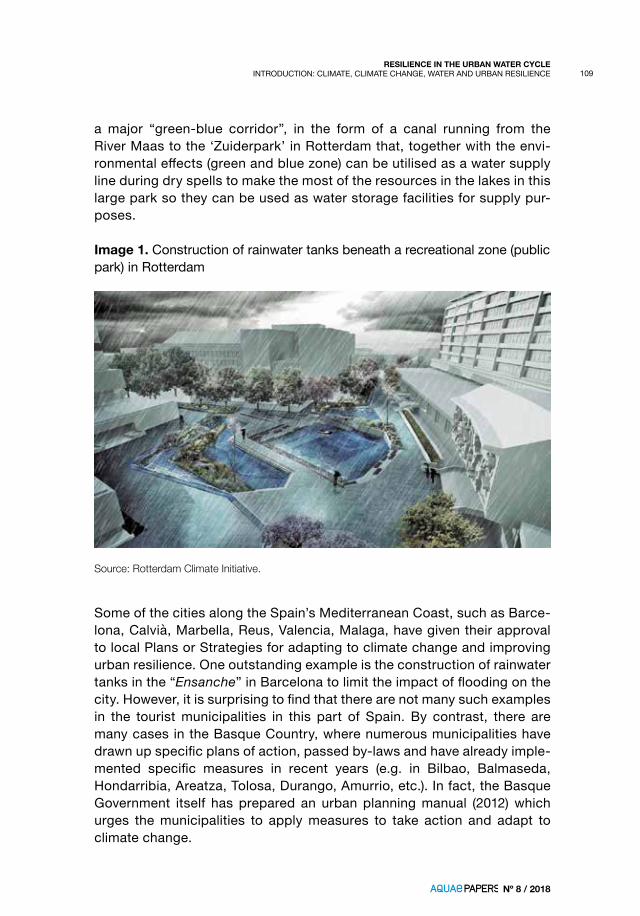
ElprogramadeadaptaciónalcambioclimáticodelaciudaddeRotterdamreviste enorme interés por la concepción integral del fenómeno (subida nivel del mar, intrusión marina, incremento de eventos de inundación, incremento de la isla de calor urbana y discomfortclimático)ydelarespuesta(medidaestructuralydeplanificaciónterritorial).Así,sehadiseñadolaEstrategia de
11
Nº 8 / 2018
RESILIENCIA EN EL CICLO URBANO DEL AGUAINTRODUCCIÓN: CLIMA, CAMBIO CLIMÁTICO, AGUA Y RESILIENCIA URBANA
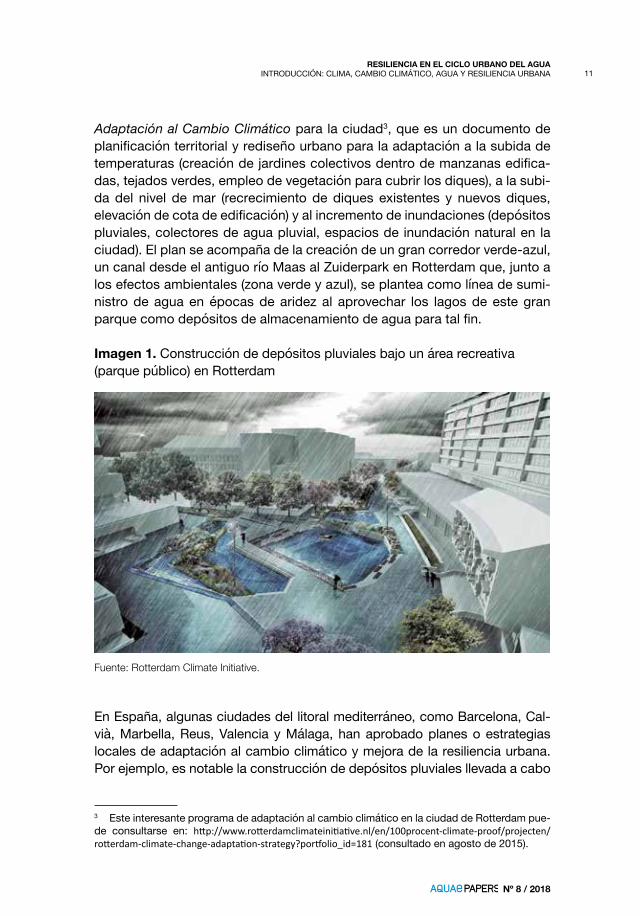
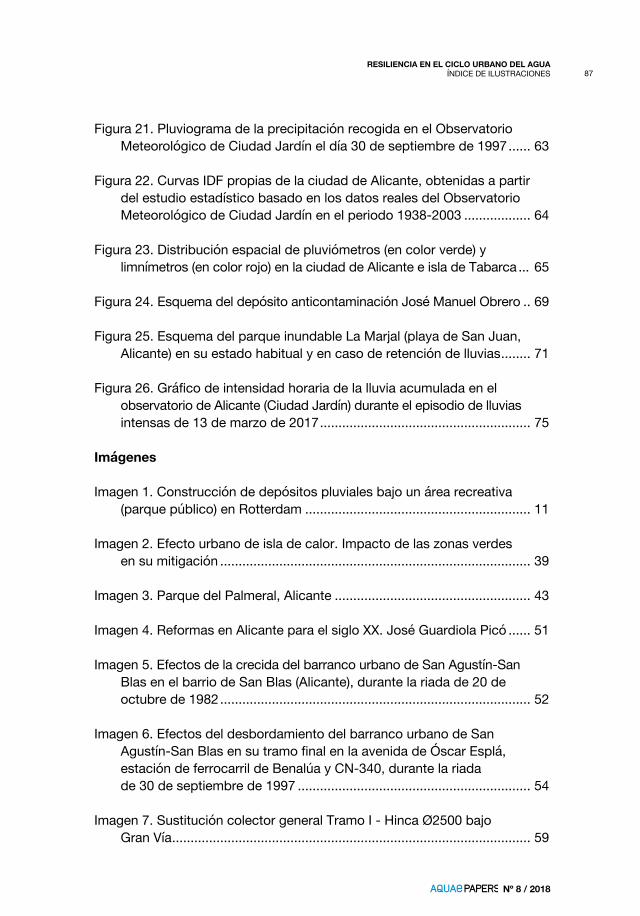
Adaptación al Cambio Climático para la ciudad3, que es un documento de planificaciónterritorialyrediseñourbanoparalaadaptaciónalasubidadetemperaturas(creacióndejardinescolectivosdentrodemanzanasedifica-das, tejados verdes, empleo de vegetación para cubrir los diques), a la subi-dadel nivel demar (recrecimiento dediques existentes y nuevosdiques,elevacióndecotadeedificación)yalincrementodeinundaciones(depósitospluviales, colectores de agua pluvial, espacios de inundación natural en la ciudad). El plan se acompaña de la creación de un gran corredor verde-azul, un canal desde el antiguo río Maas al Zuiderpark en Rotterdam que, junto a los efectos ambientales (zona verde y azul), se plantea como línea de sumi-nistrode aguaen épocasde aridez al aprovechar los lagosde estegranparquecomodepósitosdealmacenamientodeaguaparatalfin.
Imagen 1. Construccióndedepósitospluvialesbajounárearecreativa(parque público) en Rotterdam
Fuente: Rotterdam Climate Initiative.
EnEspaña,algunasciudadesdellitoralmediterráneo,comoBarcelona,Cal-vià,Marbella,Reus,Valencia yMálaga,hanaprobadoplanesoestrategiaslocalesdeadaptaciónalcambioclimáticoymejoradelaresilienciaurbana.Por ejemplo, es notable la construcción de depósitos pluviales llevada a cabo
3 EsteinteresanteprogramadeadaptaciónalcambioclimáticoenlaciudaddeRotterdampue-de consultarse en: http://www.rotterdamclimateinitiative.nl/en/100procent-climate-proof/projecten/rotterdam-climate-change-adaptation-strategy?portfolio_id=181 (consultado en agosto de 2015).
RESILIENCIA EN EL CICLO URBANO DEL AGUAINTRODUCCIÓN: CLIMA, CAMBIO CLIMÁTICO, AGUA Y RESILIENCIA URBANA
enelEnsanchedeBarcelonaparareducirelimpactodelasinundacionesenlaciudad.Perosorprendequenosonmuchos, todavía, losejemplosquepueden encontrarse en los municipios turísticos de esta parte del territorio español. Contrasta esta situación con el impulso que hamerecido estacuestión,porcontra,enelPaísVasco,dondenumerososmunicipioshanelaboradoplanesespecíficosdeacción,ordenanzasmunicipalesyhande-sarrollado ya medidas concretas en los últimos años (por ejemplo, Bilbao, Balmaseda, Honsarribia, Areatza, Tolosa, Durango, Amurrio, etc.). El propio Gobierno vasco ha desarrollado un manual de planeamiento urbanístico(2012) donde insta a los municipios a aplicar medidas de acción y adaptación anteelcambioclimático.
LaFederaciónEspañoladeMunicipiosyProvincias,porsuparte,hadesa-rrollado en los últimos años diferentes iniciativas para fomentar la acción lo-calenmateriadeluchayadaptaciónalcambioclimático.AlacreacióndelamencionadaReddeCiudadesEspañolasporelClima,haseguidolaelabo-ración,desde2009,deinformesanualesdepolíticaslocalesdeluchacontraelcambioclimático,lapreparacióndeundocumentoinformativoVulnerabi-lidad al cambio climático a escala local (2010)4 y la redacción de la Guía para el desarrollo de normativa local en la lucha contra el cambio climático (2012)5, conpautasparalaredacciónypuestaenmarchadeordenanzasmunicipa-les en los sectores relacionados con la mitigación y adaptación al cambio climático(energía,transporte,residuos,agua,vivienda,planeamientourba-no,participación,fiscalidad).
Asimismo, la empresa de implantación urbana en aquellos sectores depen-dientesdelaguaparasudesarrolloyexpansiónharealizadoestrategiasymedidasparalaadaptaciónalcambioclimáticoquemerecendestacarse.Elcasodelsectorturísticoeselmásdestacadoenestesentido(OlcinayVera,2016).Tantooperadoresturísticoscomocadenashotelerashandesarrolladodesde los años noventa una serie de estrategias y medidas de adaptación al cambio climático que están dando resultados concretos de gran interés.Gruposhoteleros internacionalizadosestándesarrollandosuspropiases-trategias de reducción de consumo de energía y agua, en el marco de polí-ticasgeneralesdereduccióndecostesempresariales,quehansupuestolarenovación de instalaciones eléctricas y de agua, con efectos palpables de disminucióndeconsumoporplazahotelera ydíaenestasdosvariables
4 Federación Española de Municipios y Provincias (2010), Vulnerabilidad al cambio climático a escala local, Ministerio de Medio Ambiente y Red Española de Ciudades por el Clima, Madrid, 310 p. 5 Federación Española de Municipios y Provincias (2012), Guía para el desarrollo de normativa local en la lucha contra el cambio climático, Ministerio de Medio Ambiente y Red Española de Ciuda-des por el Clima, Madrid, 253 p.
13
Nº 8 / 2018
RESILIENCIA EN EL CICLO URBANO DEL AGUAINTRODUCCIÓN: CLIMA, CAMBIO CLIMÁTICO, AGUA Y RESILIENCIA URBANA
ambientales. De manera que, aunque insertas en concepciones de rentabili-dad económica de la empresa, debe valorarse muy positivamente los resul-tadosqueseestánobteniendoaescaladeinstalaciónhotelera,quesupo-nenunejemploparacadenashotelerasdemenordimensiónuhotelesdetitularidadfamiliar.Lasactuacionesdeadaptaciónquehanrealizadoempre-sariosturísticosparticularesenlosúltimosañosbásicamenteestándirigidasalfomentodelahorrodeenergíayaguaenapartamentosy,sobretodo,eninstalacioneshoteleras,quesehadifundidoalrestodeedificacionesdeme-nor tamaño en diversos destinos turísticos. Es lo que sucede en la Costa Brava, la Costa Dorada, Mallorca, Benidorm, el litoral de Murcia y en la Cos-tadelSol.Enestoscasos,surgeprimero lanecesidaddeahorraragua,apartirdeladécadadelosañosochentadelpasadosiglo,yaellosehaunidolanecesidaddelahorrodeenergíaenlosúltimosquinceaños,debidoalin-cremento de tarifas eléctricas y al aumento del gasto de energía eléctrica anual de una instalaciónhotelera.Además suele coincidir con épocasdesequía en destinos turísticos, lo que motiva la realización de acciones de iniciativa privada que complementan o, incluso, suplen las acciones desarro-lladasporlasAdministracionespúblicas.AsíhaocurridoenBenidorm,traslasequíade1978;enel litoralcatalán,traslassequíasde1990-1995yde2008;enBalearesyenlaCostadelSol,porlasequíade1990-1995;yenellitoraldeMurciaporlasfrecuentessequíasdesdelosañosochentadelpa-sado siglo.
LaciudaddeAlicante,urbemediterráneadetradiciónhistórica,conuncre-cimiento población y urbanístico muy intenso en la segunda mitad del siglo XX, constituyeunbuenejemplodeespaciourbanoquehapadecidoefectosdeinundacionesysequíasalolargodesuhistoria,conunimpactoagravadoenlasúltimasdécadasporelaumentodelavulnerabilidadylaexposiciónaestosdospeligrosclimáticos.Parareducirlasconsecuenciasdeestosepisodiossehanimplantadoactuacionesdiversas,estructuralesydeplanificaciónte-rritorial. Desde los años noventa del siglo pasado, merced a las actuaciones desarrolladas de forma conjunta y coordinada por las Administraciones pú-blicas(regionalylocal)ylaempresaHidraqua,seharealizadounaapuestaporlasostenibilidadambientalyterritorialalahoradediseñarmedidasdeminimización de los efectos de inundaciones y sequías.
Este estudio presenta la relación de actuaciones desarrolladas en la ciudad de Alicante para aumentar la resiliencia ante inundaciones y sequías en las últimas décadas. Un buen ejemplo de apuesta por la adaptación responsa-ble al cambio climático y sus extremos atmosféricos asociados y por lasmedidasdesostenibilidadambientalyterritorialalahoradeafrontarlosre-tos que la gestión integral del agua urbana requiere en el siglo XXI.
14
Nº 8 / 2018
RESILIENCIA EN EL CICLO URBANO DEL AGUAEL CLIMA MEDITERRÁNEO, UN CLIMA DE ELEVADO CONFORT PERO CON EXTREMOS PLUVIOMÉTRICOS
2. EL CLIMA MEDITERRÁNEO, UN CLIMA DE ELEVADO CONFORT PERO CON EXTREMOS PLUVIOMÉTRICOS
El clima mediterráneo presenta una de las variedades climáticasmásconfortablesdelmundo.Demodosingular,seextiendeenelentornodelacuencamarinadelMediterráneoyesgeneralmentesuave,singrandesso-bresaltos térmicos, con inviernos frescos pero con ausencia de grandes fríos, y veranos calurosos, pero no tórridos. La circulación de la brisa marina atem-peralosrigorestérmicosydulcificaelambienteenlasáreascosteras.
Comonormageneral, las tierras de la fachadamediterránea española, alestarsituadasasotaventodelosflujoshúmedosqueprocedendelAtlántico,reciben menos aportes de precipitación de las borrascas que entran por el oeste peninsular. Por el contrario, las situaciones atmosféricas que arrastran vientosdesdeelmarMediterráneohacialastierraspeninsulares—yBalea-res—sonlosquemayorvolumendelluviassuponenanualmente.
Enellitoralmediterráneoespañollasprecipitacionesqueserecogenanual-mentevandisminuyendodenorteasurhaciaelsurestepeninsular(surdeAlicante, gran parte de la Región de Murcia y de Almería), para aumentar de nuevoenlastierrasdelacostatropicalgranadinaylaCostadelSol,hastalasestribacionesdelestrechodeGibraltar.Detalmanera,ladistribucióndeprecipitaciones muestra una evidente relación con la presencia y orientación de los relieves y con la propia disposición de la línea de costa.
Junto a la cuantía, en general poco abundante y desigualmente repartida a lolargodelaño,delasprecipitacionesenlafachadamediterráneapeninsu-lar, otro rasgo inherenteaestamodalidadclimáticaes la irregularidaddeestaslluvias;irregularidadintraanual,puestoquelasmayoresprecipitacio-nes se concentran en los meses equinocciales (otoño y primavera), e irregu-laridad interanual, donde se alternan años muy poco lluviosos, que son los másfrecuentes,conañosmuylluviosos(1989,2017).Estosúltimosserela-cionan con el desarrollo de mecanismos de circulación atmosféricas de va-riabilidad como la oscilacióndelAtlánticoNorte (NAO) y la oscilacióndelMediterráneooccidental(WeMO).
15
Nº 8 / 2018
RESILIENCIA EN EL CICLO URBANO DEL AGUAEL CLIMA MEDITERRÁNEO, UN CLIMA DE ELEVADO CONFORT PERO CON EXTREMOS PLUVIOMÉTRICOS
La alternancia de años secos y lluviosos tiene una implicación importante en laplanificacióndelaguadeestosterritorios,quedebentenerprevistalaeleva-da irregularidad interanual de las lluvias para poder garantizar en todo momen-tolasdemandasexistentes.Deahílaapuestaqueenmuchosterritorios,es-pecialmenteenlasciudadesdellitoralmediterráneoespañol,sehahechoporladiversificaciónen las fuentesdesuministrodeaguaparaevitarposiblesproblemas de abastecimiento vinculados a la irregularidad anual de las lluvias.
Sequías y episodios de lluvia torrencial caracterizan, singularmente, el clima mediterráneo.Sonlosextremosatmosféricosqueconmayorfrecuenciaal-teranel funcionamientodeesta variedadclimática.Unclimaconelevadoconfortyaltamentesalutífero,peroqueenocasionesmanifiestasuladome-nos agradable, con el desarrollo de peligros meteorológicos.
Figura 1. Precipitación diaria en Alicante (1940-2016)
Fuente: AEMET. Observatorio Ciudad Jardín (Alicante).
0
100
200
300
01/0
1/19
40
01/0
1/19
42
01/0
1/19
44
01/0
1/19
46
01/0
1/19
48
01/0
1/19
50
01/0
1/19
52
01/0
1/19
54
01/0
1/19
56
01/0
1/19
58
01/0
1/19
60
01/0
1/19
62
01/0
1/19
64
01/0
1/19
66
01/0
1/19
68
01/0
1/19
70
01/0
1/19
72
01/0
1/19
74
01/0
1/19
76
01/0
1/19
78
01/0
1/19
80
01/0
1/19
82
01/0
1/19
84
01/0
1/19
86
01/0
1/19
88
01/0
1/19
90
01/0
1/19
92
01/0
1/19
94
01/0
1/19
96
01/0
1/19
98
01/0
1/20
00
01/0
1/20
02
01/0
1/20
04
01/0
1/20
06
01/0
1/20
08
01/0
1/20
10
01/0
1/20
12
01/0
1/20
14
01/0
1/20
16
Precipitación: l/m2
2.1. Sequías y abastecimientos de agua
Lassecuenciasdesequíasonunrasgopropiodelclimamediterrá-neo. En realidad, los años con lluvias por debajo de las medias normales es lo habitual.Ellitoralmediterráneoespañolespartícipedelassecuenciasdese-quía que afectan al resto del territorio español, las denominadas sequías ibéri-cas, que suponen descensos de precipitación superiores al 40% en un año. Pero también se desarrollan en este espacio sequías surestinas, propias del territorio del sureste peninsular, que no afectan al resto de la península Ibérica.
Las sequías ibéricas se originan por la frecuencia de la instalación de anti-ciclones a lo largo del año. En estas condiciones no se dan circunstancias favorables para el desarrollo de precipitaciones, que se reducen de manera significativarespectoalosvaloresnormales.Lassequíassurestinasafec-tan,exclusivamente,alterritorioqueintegranlaregiónclimáticadelsureste
16
Nº 8 / 2018
RESILIENCIA EN EL CICLO URBANO DEL AGUAEL CLIMA MEDITERRÁNEO, UN CLIMA DE ELEVADO CONFORT PERO CON EXTREMOS PLUVIOMÉTRICOS
ibérico,ademásdeestarcausadasporlapresenciadejornadasanticiclóni-cas, aunque en una proporción de días normal, registran numerosos días de poniente, esto es, de paso de borrascas y frentes que, tras atravesar la penín-sulaIbérica,llegansinefectividadpluviométricaaesteextremodelterritorio.
Esinteresantedestacarqueenañosmuysecosqueseregistraneneláreamediterráneaespañola,especialmenteenelterritoriodelsurestepeninsular,los valores de lluvia que se pueden recoger en un año son muy inferiores a los queseanotan,portérminomedio,enlocalidadesdelafranjadelSahelafrica-no,enelbordemeridionaldeldesiertodelSáhara.Esodamuestradelainten-sidad que alcanza en esta parte de España la reducción de lluvias, algunos años originada por las secuencias secas. Así, Torrevieja, en el litoral meridional alicantino, acumuló apenas 73 mm en 1961 y Pilar de la Horadada, solo 83 mm en1995;enlacapitalmurciana,serecogieronapenas90mmen1945.
Alicante,enestecontextogeográfico,sufreconregularidadlosefectosplu-viométricos del desarrollo de episodios de reducción de lluvia (sequías anua-les y secuencias largas de sequía), de manera que su sistema de abasteci-mientodeaguahadebidoadaptarse,desdecomienzosdelsigloXX,aestetipodecoyunturaparaevitaroreduciralmáximosusefectos.
Desde la utilización de fuentes y pozos urbanos, a la traída de aguas desde elAltoVinalopóhastaAlicante,pasandoporlaconexiónamediadosdelsi-glo XX con la Mancomunidad de los Canales de Taibilla, sin olvidar la llegada de las aguas del trasvase Tajo-Segura o, recientemente, la incorporación de recursos de agua no convencionales procedentes de la depuración y la des-alación, se han desarrollado una serie de actuaciones necesarias para lagarantíadel abastecimientohídricode la ciudad,motivadas, en todos loscasos, por los efectos de episodios de sequía desarrollados en años previos, que actuaronde incentivadores para la búsquedade soluciones eficacesque pusieran solución a la dependencia del abastecimiento de la ciudad ante coyunturas climáticas adversas. En la actualidad, puede afirmarse que lagarantíadeabastecimientodeaguaenlaciudaddeAlicanteesprácticamen-teabsolutayquehadejadodeserdependientedeldesarrollodelassequías,loquesuponeelhaberrealizadounagestióndelaguaeficaz,quehabusca-dodiversificar las fuentesdesuministrocomosoluciónracionalysensatapara la garantía del abastecimiento.
2.2. Episodios de lluvia extrema en el clima mediterráneo
RESILIENCIA EN EL CICLO URBANO DEL AGUAEL CLIMA MEDITERRÁNEO, UN CLIMA DE ELEVADO CONFORT PERO CON EXTREMOS PLUVIOMÉTRICOS
mismasencortoespaciodetiempo.Esteeselaspectomásdestacadoaefectosdelaplanificacióndeinfraestructurasdeevacuacióndeaguasenlosentornos urbanos para reducir el riesgo de inundaciones.
Losregistrosoficialesdelluviaen24horasenelterritoriodellitoralmediterrá-neoespañolofrecenvaloresrécordporencimadelos300y400mm.Perohaylocalidadesquehansuperadoampliamenteestedato,duplicandootriplican-do ese volumen de precipitación diaria acumulada (como vemos a continua-ción).Estosregistroshanocurridoencondicionesdetiempoatmosféricomuyinestables(airefríoencapasaltas—vaguadas,gotasfrías—).Larelacióndevaloresextremosdelluviaporencimade400mm/24henundíacomprende:
• 1.121 mm en Casas del Barón (Valencia), 20 de octubre de 1982 (estima-do).
• 871mmenJávea(Alicante),2deoctubrede1957.• 817 mm en Oliva (Valencia), 3 de noviembre de 1987. • 790 mm en La Pobla del Duc (Valencia), 4 de noviembre de 1987.• 720 mm en Gandía (Valencia), 3 de noviembre de 1987.• 632 mm en Bicorp (Valencia), 20 de octubre de 1982.• 600 mm en Albuñol (Granada) y en Zúrgena (Almería), 19 de octubre de
1973.• 536 mm en Escorca Son Torrella (Mallorca), 22 de octubre de 1959.• 520 mm en Tavernes de Valldigna (Valencia), 11 de septiembre de 1998.• 520 mm en Sumacarcer (Valencia), 4 de noviembre de 1987.• 500 mm en Benifairó de Valldigna (Valencia), 11 de septiembre de 1996.• 460 mm en Escorca Gorg Blau (Mallorca), 29 de septiembre de 1940. • 450 mm en Alforja (Tarragona), 10 de octubre de 1994.• 430 mm en Cadaqués (Girona), 14 de octubre de 1986.• 426 mm en Cofrentes y Jalance (Valencia), 20 de octubre de 1982.• 425 mm en Denia (Alicante), 3 de noviembre de 1987.• 416 mm en Alcalalí (Alicante), 12 de octubre de 2007.• 412 mm en Gallinera (Alicante), 7 de mayo de 1982.• 410 mm en Alginet (Valencia), 6 de noviembre de 1983.• 409 mm en el cabo de San Antonio (Alicante), 1 de octubre de 1957.
Hayundato realmentesorprendentede lluviamáximadiariaenelsuresteibérico, que es el estimado en la célebre Riada de Santa Teresa, durante la
18
Nº 8 / 2018
RESILIENCIA EN EL CICLO URBANO DEL AGUAEL CLIMA MEDITERRÁNEO, UN CLIMA DE ELEVADO CONFORT PERO CON EXTREMOS PLUVIOMÉTRICOS
nochedel14al15deoctubrede1879,lamayordelaquehaynoticiahistóri-ca en la cuenca del Segura, en el río Vélez, una de las ramas madres del Guadalentín,se recogieronmásde600mmenunahora.La localidaddeSueca(Valencia)tieneanotadalaintensidadmáselevadadeEspañaenunintervalode2horasy30minutos(296mm,23deseptiembrede2008).En20minutos,laestacióndelSistemaAutomáticodeInformaciónHidrológica(SAIH), ubicada en la localidad valenciana de Manuel, registró 90,6 mm el 1deagostode1993.Yentansolo1minuto,laintensidadmáselevadaano-tada en España corresponde a la localidad de Montserrat (Valencia), el 10 de octubre de 2008 (10,2 mm).
Figura 2.GráficodelluviasenAlicante(20precipitacionesmásintensas)
Fuente: AEMET. Observatorio Ciudad Jardín (Alicante).
0
50
100
150
200
250
300
Ener
o-40
A
bril-
42
Julio
-44
Oct
ubre
-46
Ener
o-49
A
bril-
51
Julio
-53
Oct
ubre
-55
Ener
o-58
A
bril-
60
Julio
-62
Oct
ubre
-64
Ener
o-67
A
bril-
69
Julio
-71
Oct
ubre
-73
Ener
o-76
A
bril-
78
Julio
-80
Oct
ubre
-82
Ener
o-85
A
bril-
87
Julio
-89
Oct
ubre
-91
Ener
o-94
A
bril-
96
Julio
-98
Oct
ubre
-00
Oct
ubre
-09
En
ero-
03
Abr
il-05
Ju
lio-0
7
Ener
o-12
A
bril-
14
Julio
-16
Precipitación: l/m2
Setratadevaloresde intensidadde lasprecipitaciones (diariayhoraria)que deben conocerse a efectos de calibrar la capacidad de evacuación de lasredesdedrenajeurbanaenlasciudadesdellitoralmediterráneoy,aun-que resultan realmente elevados y suponen un indudable encarecimiento de las obras de avenamiento urbano, son valores de salvaguarda de la vida humanaydeevitacióndeelevadaspérdidaseconómicasparaestosespa-cios urbanos.
RESILIENCIA EN EL CICLO URBANO DEL AGUAEL CLIMA MEDITERRÁNEO, UN CLIMA DE ELEVADO CONFORT PERO CON EXTREMOS PLUVIOMÉTRICOS
litoralmediterráneoespañol y, si se confirman losmodelosclimáticos, seestimaqueseráunrasgodestacadodelasprecipitacionesenestapartedeEspañaenlaspróximasdécadas.
Figura 3. Cambio en las precipitaciones intensas. Alicante (2000-2100)
Fuente: AEMET. Proyecciones climáticas para el siglo XXI.
• El incrementodetemperaturasqueseharegistradoenlastresúltimasdécadasnoencuentraexplicaciónsoloporcausasexclusivamentenatu-rales(radiaciónsolar).Hayotrofactorqueestáalterandoelfuncionamien-to normal del balance energético del planeta al originar una incentivación delpodercaloríficodelaradiacióndeondalarga,originadaenlasuper-ficieterrestreymarina,quenosalealexteriorporquequedaconfinadaenlosprimeroskilómetrosdelaatmósfera.Yestehechoestáenrelacióncon la presencia de gases primarios procedentes de la actividad econó-micahumana(CO2,óxidonitrosoymetano)ydepositadosenlaatmós-fera, o de la interacción de estos con otros gases cuya contribución real
20
Nº 8 / 2018
RESILIENCIA EN EL CICLO URBANO DEL AGUAEL CLIMA MEDITERRÁNEO, UN CLIMA DE ELEVADO CONFORT PERO CON EXTREMOS PLUVIOMÉTRICOS
al balance energético planetario sigue siendo una incertidumbre, como el ozono troposférico.
• Unaatmósferaquepierdesuequilibriotérmicoysevuelvemáscálidaomásfríaesunaatmósferaqueregistraprocesosdereajusteenergéticomásviolentos;esdecir,lostiposdetiempocambianconmásrapidezeintensidad.Sehacemásfrecuentelagénesisdesituacionesderangoex-traordinario. Esto es especialmente notable en las latitudes medias, al ser elescenariodedesarrollodelosmovimientosdeexpansióndelasmasasdeairefrías(denorteasur)ycálidas(desuranorte).
• Desde1980,lastemperaturashansubidomásenlatitudesmediasyaltasqueenlasintertropicalesy,especialmente,enelhemisferionorte.Ellosereflejatantoenlosregistrosinstrumentalesdelosobservatorioscomoenlas termografías realizadas a partir de datos de satélites.
LacuencadelMediterráneoesunadelasáreasmundialesdondeseestimaquepuedansermásevidentes loscambiosen lascondicionesclimáticasdurantelaspróximasdécadas.Lasubidadetemperaturasyeldescensodeprecipitaciones obligan a tomar medidas para la adaptación para reducir el discomfort térmico previsto y la reducción de recursos de agua convencional que traería consigo una disminución de las lluvias. El estudio Proyecciones climáticas para el siglo XXI (AEMET, 2015), actualización de las proyecciones elaboradasen2011,hamanejadotresvariables(temperaturamáxima,tem-peraturamínimayprecipitación)enelanálisisdelaevoluciónmodelizadadelclimaenEspañaparalaspróximasdécadas.Losresultadosvienenaconfir-mar los datos apuntados en informes anteriores de la propia Agencia Estatal ydelaOficinaEspañoladeCambioClimático.Paraelconjuntopeninsular,elincrementoenlastemperaturasmáximasen2100seestimaentre1ºCy7ºCparadiferentesescenariosdeemisióndegases;enlastemperaturasmíni-maselaumentosecifraentre1ºCy6ºC;y,porsuparte,lasprecipitacionesse reducirían entre un 4 y 8% respecto a las medias del periodo 1961-2000-2005, con un margen de incertidumbre del 10%.
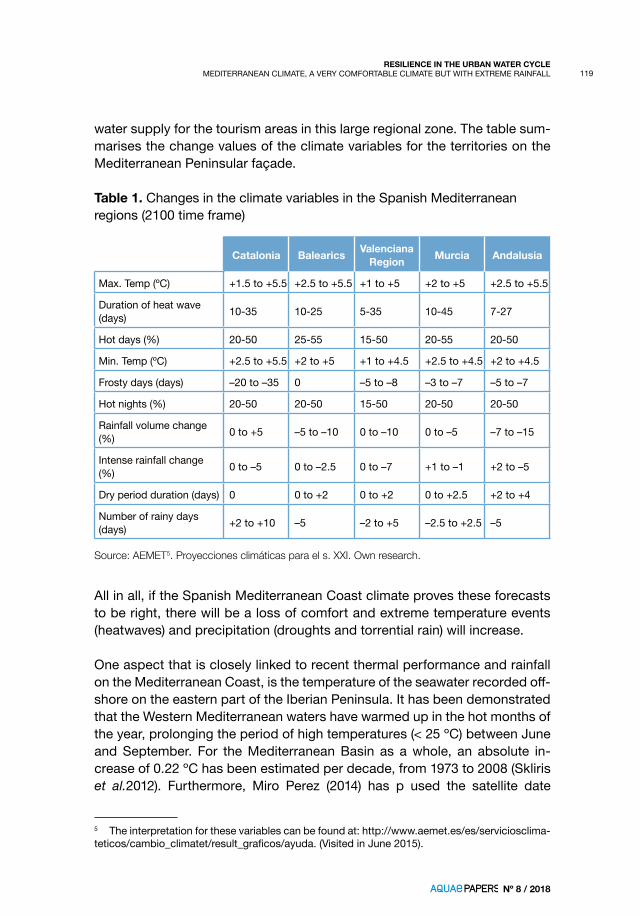
Es interesante destacar los valores de diferentes variables térmicas y plu-viométricascalculadosenesteinforme,conhorizonte2100,paralasregio-nesdellitoralmediterráneo,objetodeanálisis,puestoquedesuevoluciónfuturavaadepender laplanificaciónde la temporada turísticay lapropiaplanificaciónhidrológica,básicapara lagarantíadesuministroa lasáreasturísticas de este gran espacio regional. La tabla 1 resume los valores de cambioenlasvariablesclimáticasparalosterritoriosdelafachadamedite-rráneapeninsular.
21
Nº 8 / 2018
RESILIENCIA EN EL CICLO URBANO DEL AGUAEL CLIMA MEDITERRÁNEO, UN CLIMA DE ELEVADO CONFORT PERO CON EXTREMOS PLUVIOMÉTRICOS
Tabla 1. Cambiosenlasvariablesclimáticasdelasregiones delMediterráneoespañol(horizonte2100)
Nº días de lluvia (días) +2a+10 –5 –2a+5 –2,5a+2,5 –5
Fuente: AEMET6. Proyecciones climáticas para el siglo XXI. Elaboración propia.
Endefinitiva,elclimaenellitoralmediterráneoespañol,sisecumplenestasprevisiones, perderá confort y se incrementarán los eventos extremos detemperatura (golpes de calor) y precipitación (sequías y lluvias torrenciales).
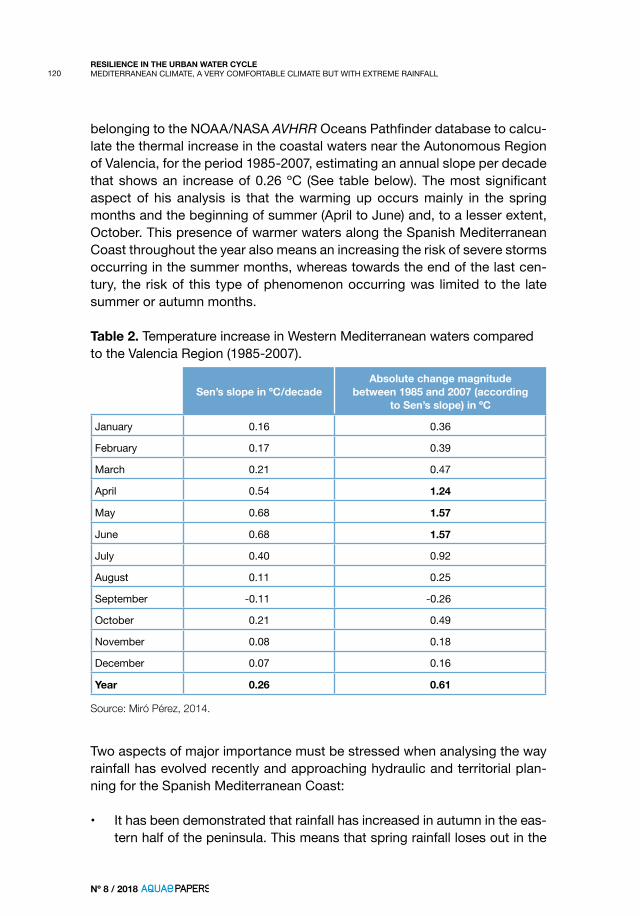
Unaspectoqueguardaestrecharelaciónconelcomportamientotérmicoypluviométricorecienteenellitoralmediterráneoeslatemperaturadelaguadelmarregistradafrentealascostasdelestepeninsular.Sehacomprobadouncalentamientode las aguasdelMediterráneooccidental en losmesescálidosdelaño,prolongando,asimismo,elperiododetemperaturaseleva-das (< 25 ˚C) entre junio y septiembre.Para el conjuntode la cuencadelMediterráneo,sehaestimadounincrementoabsolutode0,22ºCpordéca-da, desde 1973 a 2008 (Skliris et al., 2012). Por su parte, Miro Pérez (2014), a partir del uso de datos de satélite pertenecientes a la base de datos de la NOAA/NASA AVHRR OceansPathfinder,hacalculadoelincrementotérmicoenlasaguasdellitoralpróximoalaComunidadValenciana,paraelperio-do 1985-2007, estimando una pendiente anual por década de 0,26 ºC de
RESILIENCIA EN EL CICLO URBANO DEL AGUAEL CLIMA MEDITERRÁNEO, UN CLIMA DE ELEVADO CONFORT PERO CON EXTREMOS PLUVIOMÉTRICOS
incremento(véasetabla2).Lomássignificativodesuanálisisesquelares-ponsabilidad del calentamiento recae especialmente en los meses de prima-vera e inicio de verano (abril a junio) y, en menor medida, octubre. Esta pre-senciadeaguasmáscálidasfrentealascostasdelMediterráneoespañolalo largo del año supone también el aumento de la peligrosidad de formación másfrecuentedetormentasintensasenmesesestivalesdelaño,cuandoelcalendarioderiesgodeestetipodeepisodiosselimitaba,hastafinalesdelsiglo pasado, a los meses tardo-estivales o propiamente otoñales.
Tabla 2. IncrementodetemperaturaenlasaguasdelMediterráneooccidental frente a la Comunidad Valenciana (1985-2007)
Pendiente Sen en ºC/década
Magnitud absoluta de cambio entre 1985 y 2007 (según
pendiente Sen) en ºC
Enero 0,16 0,36
Febrero 0,17 0,39
Marzo 0,21 0,47
Abril 0,54 1,24
Mayo 0,68 1,57
Junio 0,68 1,57
Julio 0,40 0,92
Agosto 0,11 0,25
Septiembre -0,11 -0,26
Octubre 0,21 0,49
Noviembre 0,08 0,18
Diciembre 0,07 0,16
Año 0,26 0,61
Fuente: Miró Pérez, 2014.
Aefectosdelaevoluciónrecientedelasprecipitacionesydelaplanificaciónhidráulicayterritorialenellitoralmediterráneoespañol,esnecesariodesta-car dos aspectos de gran importancia:
• Se ha comprobado un incremento de precipitaciones en otoño en lamitad este peninsular. Esto quiere decir que las lluvias de primavera pierden peso en el reparto anual de precipitaciones y, por contra, gana importancia la cuantía de lluvias acumulada en los meses de otoño. Es unindiciodecambioclimáticoydesusefectosenelcomportamiento
23
Nº 8 / 2018
RESILIENCIA EN EL CICLO URBANO DEL AGUAEL CLIMA MEDITERRÁNEO, UN CLIMA DE ELEVADO CONFORT PERO CON EXTREMOS PLUVIOMÉTRICOS
Figura 4. Cambios en los patrones estacionales de precipitación en la península Ibérica en 1976-2005 (inferior), respecto al periodo 1946-1975 (superior)
Fuente: De Luis, Brunetti, González-Hidalgo, Longares y Martín Vide (2013).
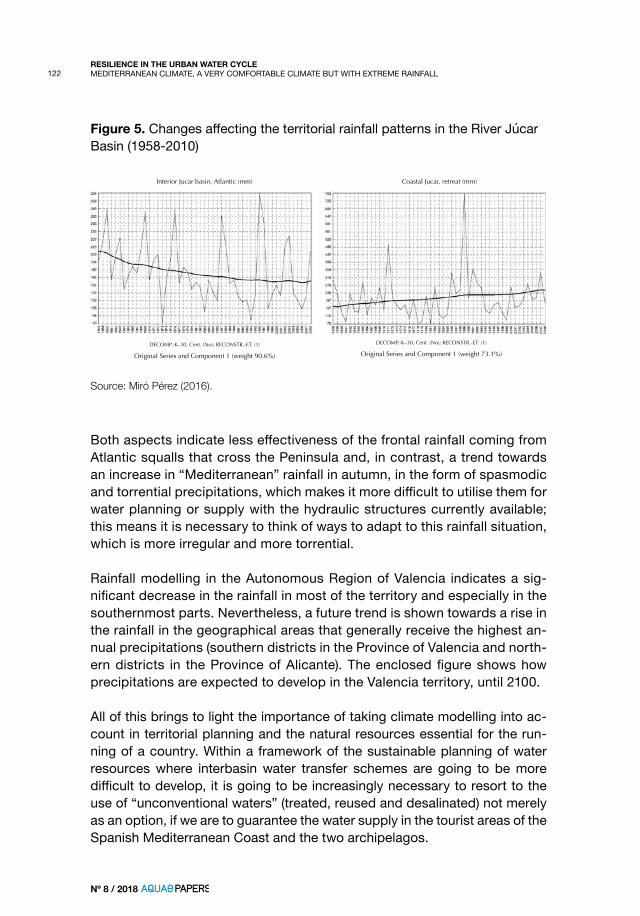
• Asimismo, para algunos ámbitos de planificación hidrológica, comoen el Júcar o Segura, analizando tendencias recientes de precipita-ción, se comprueba que las lluvias se reducen en la cabecera de estas cuencashidrológicas,mientrasmanifiestanunatendenciaalaumentoen las áreas litorales de estos ámbitos. Esto tiene una importanciadestacada, puesto que los aportes de cabecera en las cuencas hi-drográficasmediterráneassonfundamentalesparagarantizarelciclohidrológicoanual.
24
Nº 8 / 2018
RESILIENCIA EN EL CICLO URBANO DEL AGUAEL CLIMA MEDITERRÁNEO, UN CLIMA DE ELEVADO CONFORT PERO CON EXTREMOS PLUVIOMÉTRICOS
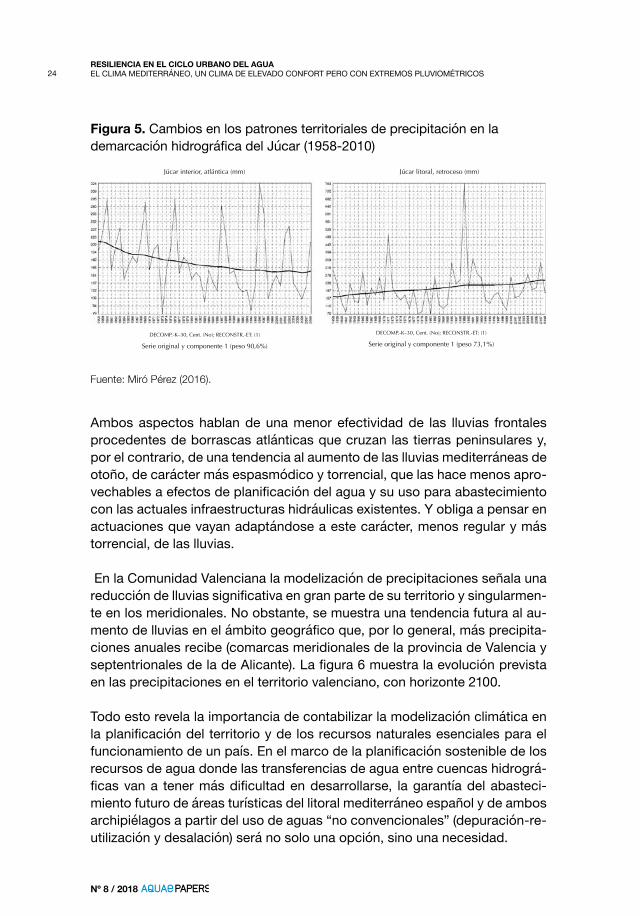
Figura 5. Cambios en los patrones territoriales de precipitación en la demarcaciónhidrográficadelJúcar(1958-2010)
Júcar interior, atlántica (mm)
DECOMP.-K–30, Cent. (No); RECONSTR.-ET: (1)
Serie original y componente 1 (peso 90,6%)
DECOMP.-K–30, Cent. (No); RECONSTR.-ET: (1)
Serie original y componente 1 (peso 73,1%)
Júcar litoral, retroceso (mm)
Fuente: Miró Pérez (2016).
Ambosaspectoshablandeunamenor efectividadde las lluvias frontalesprocedentesdeborrascasatlánticasquecruzanlastierraspeninsularesy,porelcontrario,deunatendenciaalaumentodelaslluviasmediterráneasdeotoño,decaráctermásespasmódicoytorrencial,quelashacemenosapro-vechablesaefectosdeplanificacióndelaguaysuusoparaabastecimientoconlasactualesinfraestructurashidráulicasexistentes.Yobligaapensarenactuacionesquevayanadaptándoseaestecarácter,menosregularymástorrencial, de las lluvias.
En la Comunidad Valenciana la modelización de precipitaciones señala una reduccióndelluviassignificativaengranpartedesuterritorioysingularmen-te en los meridionales. No obstante, se muestra una tendencia futura al au-mentodelluviasenelámbitogeográficoque,porlogeneral,másprecipita-ciones anuales recibe (comarcas meridionales de la provincia de Valencia y septentrionalesdeladeAlicante).Lafigura6muestralaevoluciónprevistaenlasprecipitacionesenelterritoriovalenciano,conhorizonte2100.
– Cambio en los patrones estacionales de precipitación con mayor concentración de lluvias en otoño y reducción en primavera
– Tendencia al incremento de las lluvias en la zonas litorales frente a las de interior
– Aumento detemperaturaenelmarMediterráneo,conmayorriesgode torrencialidad en las precipitaciones
En resumen,pérdidaderegularidadydeconfortclimáticoyaumentodeextremospluviométricos (secuencias de sequía, episodios de lluvia intensa y torrencial)
Fuente: elaboración propia.
2.4. Retos para el ciclo urbano del agua
Losextremosatmosféricosdelclimamediterráneosuponenunretoparaelciclourbanodelagua.Lasciudadesmediterráneasdebenestarpre-paradas para soportar meses de escasa precipitación y, en sentido contra-rio, para aguantar lluvias torrenciales que originan anegamientos e inunda-ciones.Se requiere unaplanificaciónhidráulica y territorial “deextremos”quegaranticeel aguaenunespaciogeográficosometidoaepisodiosdesequía y con demandas urbanas importantes. E igualmente, que evite la pér-dida de vidas humanas y la génesis de pérdidas económicas elevadas aconsecuencia de lluvias muy abundantes en corto espacio de tiempo.
RESILIENCIA EN EL CICLO URBANO DEL AGUARECURSOS HÍDRICOS
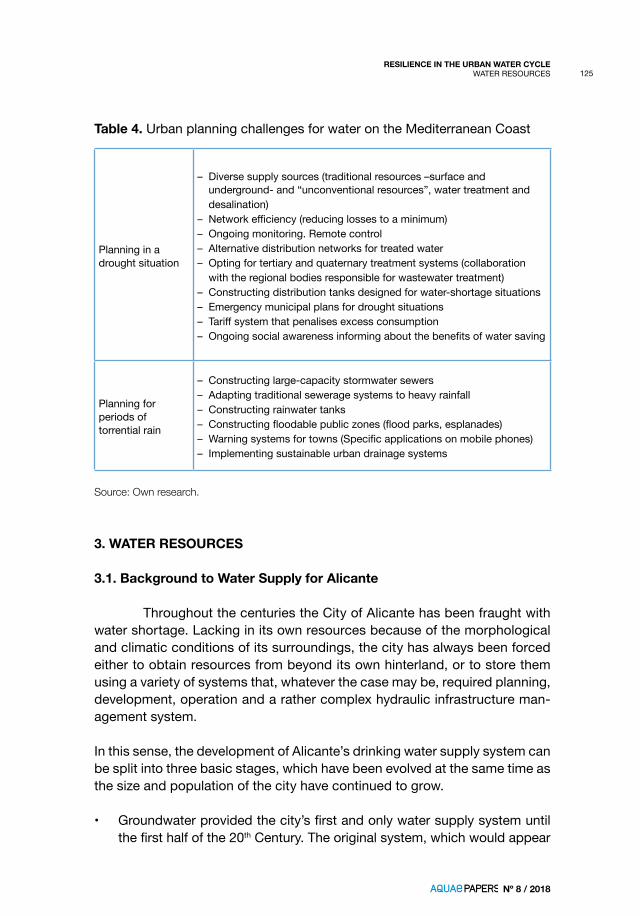
Tabla 4.Retosdelaplanificaciónurbanadelaguaenellitoralmediterráneo
Planificaciónen situación de sequía
– Fuentes de abastecimiento diversas (recursos tradicionales —superficialesysubterráneas—y“noconvencionales”,depuraciónydesalación)
– Eficienciaenlasredes(reduccióndepérdidasalmáximo)– Monitorización continua. Telemando– Redes alternativas de distribución de agua depurada– Apuesta por los sistemas terciarios y cuaternarios de depuración
(colaboración con organismos regionales responsables de la depuración de agua residual)
– Construcción de depósitos de distribución dimensionados para situaciones de escasez
– Planes municipales de emergencia ante sequías– Sistemastarifariosquepenalicenelexcesodeconsumo– Sensibilizaciónsocialcontinuadelosbeneficiosdelahorrodelagua
Planificacióndeepisodios de lluvia torrencial
– Construcción de colectores de agua pluvial de gran capacidad– Adecuación de sistemas tradicionales de alcantarillado a lluvias
intensas– Construcción de depósitos pluviales– Construccióndeespaciospúblicos(parques,explanadas)inundables– Sistemasdealertaalaspoblaciones(appsespecíficasenmóviles)– Implantación de sistemas de drenaje urbano sostenible
Fuente: elaboración propia.
3. RECURSOS HÍDRICOS
3.1. Antecedentes históricos del abastecimiento de Alicante
LarealidadhistóricadelaciudaddeAlicantehasidolaindigenciahídricasecular.Lafaltaderecursospropios,comoconsecuenciadelascon-dicionesmorfoclimáticasdelentornoendondeseenclava,haconducidoala necesidad de obtener recursos fuera de su enclave, o al acopio de los mismos desde diversos sistemas que, en cualquier caso, pasan por un con-ceptodeplanificación,desarrollo,explotaciónygestióndeinfraestructurashidráulicasbastantecomplejo.
Enestesentido,sepuedeenmarcarentresetapaseldesarrollobásicodelsistemadeabastecimientodeaguapotabledeAlicante,etapasquehansidodesarrolladas paralelamente a un continuo y creciente desarrollo de su capi-talhumano.
RESILIENCIA EN EL CICLO URBANO DEL AGUARECURSOS HÍDRICOS
primigenio, que se remonta cuanto menos a la época musulmana, al parecer, debió de consistir en procedimientos elementales de elevación de aguas poco profundas. Durante los siglos XVII y XVIII, la tecnología permiteelaborarminadosyexcavacióndepozosygalerías,constitu-yendo las norias y los molinos de agua parte esencial de la economía hidráulica,queperduranhastalosalboresdelsigloXX.
• La creciente demanda de recursos y los periodos recurrentes de sequía fueronelestímuloquemotivódesdefinesdelsigloXIXycomienzosdelsigloXXlaejecucióndenotablesobrashidráulicas.Laprimeradeellasfue la traída de aguas de La Alcoraya, cuya inauguración tuvo lugar en 1881. Su distribución domiciliaria la realizaron los aguadores, que reco-rrían laciudadconsuscántarosprocedentesde lascinco fuentes ins-taladas en el espacio urbano. Este primer intento fue secundado por un nuevoproyecto,sicabeaúnmásambiciosoeinnovador,elproyectodelCanal de Alicante que, con una longitud total de 48 km, transportaría en 1898lasaguasdelospozosartesianosdeSax,sitosenelAltoVinalopó.El caudal aportado fue de 10 l/s, que repartidos entre el censo del mo-mento,suponíaunadotaciónde21,6 l/hab/día,dotaciónsuperior,conmucho,alaquefigurabaenesemomentoenotrascapitales.
La Sociedad General de Aguas de Barcelona, responsable del abasteci-mientoalaciudaddesdeelaño1926,iniciahaciamediadosdelosañostreinta de ese siglo importantes inversiones que se materializarían en el aumento de la capacidad de transporte de la traída de aguas, la amplia-ción de la red urbana, la reprofundización de los pozos y la adquisición de nuevascaptacionessubterráneas;aunqueesteúltimohechoseproduci-ríayaenlosañossetenta.Sellega,deestemodo,alfinaldeunperiododeconsolidaciónyexpansióndelabastecimientourbanoyalamunicipa-lización del servicio a través de la Sociedad de Aguas de Alicante.
• Lasnuevasfuentesderecursoshídricosprontosemuestraninsuficientespara la creciente demanda, sobre todo del litoral, lo que obliga al Ayunta-miento de Alicante a integrarse en la Mancomunidad de los Canales del Taibilla, que disponía de caudales procedentes del río Taibilla, ubicado en la vecina cuenca del Segura. Sin embargo, pronto, en la década de los sesenta, la propia Mancomunidad de los Canales del Taibilla (MCT) se ve desbordadaparasatisfacerlasdemandasdesuscomuneros,quehabíanpasado de 2 a 26 en tan solo una diez años.
Enestecontexto, surgea la luzpúblicaen1967elProyectodelTrasvaseTajo-Segura, cuya conclusión va pareja a las nuevas infraestructuras que
29
Nº 8 / 2018
RESILIENCIA EN EL CICLO URBANO DEL AGUARECURSOS HÍDRICOS
realiza Aguas de Alicante, vertebradas en dos líneas de actuaciones princi-pales: la mejora del transporte de los caudales procedentes del Alto Vinalo-pó, mediante el doblaje y sustitución del primitivo Canal del Cid en todo su tramodemampostería,trabajosqueaúnhoyestánvigentesypermitentra-segarcaudalessuperioresa2.000l/s;ydiversificarydirigirlascaptacionesdeaguasubterráneashaciaacuíferosconmejorcalidaddeaguaymayoresrecursos.
Sinembargo,todosestosesfuerzossehantornadoinsuficientesylasnece-sidadesdeaguaseguiráncreciendo,según lasprevisiones futuras,por loque laetapacontemporáneabuscasusnuevas fuentesde recursosenelagua desalinizada, como las del Canal de Alicante I y II, gestionadas por la MCT, con una producción nominal de 50.000 y 65.000 m3/día, respectiva-mente,deaguadesalinizadaparaconsumohumano;ylarecientepuestaenmarchadeladesaladoradelaMarinaBaja,situadaenMutxamel,gestionadaporAguasdelasCuencasMediterráneas(ACUAMED),conunacapacidadmáximanominalde18.000m3/día, en su primera fase.
Figura 7.Evolucióndelosrecursoshídricosprocedentesdedesalaciónenel sistema de abastecimiento de la Mancomunidad de Canales del Taibilla, durante el periodo 2003-2015
Evolución de los recursos de agua potable desalada, disponibles en la MCT (m3)
Alicante I Alicante II S. Pedro I S. Pedro II Valdelentisco
Laapariciónenescenadeestetipoderecursonohasidomasiva,sinoquesuconcursosehaproducidodeformaprogresiva,iniciándoseenelentor-nodeAlicante,conladisponibilidadde5hm3 en el año 2003, procedentes de la primera línea de producción de la desalinizadora de Aguamarga, en
30
Nº 8 / 2018
RESILIENCIA EN EL CICLO URBANO DEL AGUARECURSOS HÍDRICOS
Alicante,eincrementándosedeformaescalonadahastalos28hm3 de 2009, aportados por las dos líneas de producción de la desalinizadora de Agua-marga,conunmínimodeunos4hm3 durante cada uno de los años 2013 y 2014.
3.2. Las garantías de suministro
3.2.1. Evolución y combinación de fuentes de abastecimiento
Lagestiónderecursoshídricosenlasregionesáridasysemiáridasdelámbitomediterráneo,comoeselcasodeAlicante,esunatareacomple-jaenlaqueintervienenungrannúmerodefactoreshidrológicos,ambienta-les y de gestión, que deben considerarse para proporcionar un abasteci-miento que permita asegurar y combinar unos niveles mínimos de calidad de vida, así como de protección medioambiental.
Lassequías,tanfrecuentesenelámbitomediterráneo,intensificanaúnmásestos problemas. Dado que son fenómenos impredecibles (tanto en su ocu-rrencia como en su duración), la previsión y la preparación son elementos clave para reducir su impacto.
En este sentido, el modelo actual de abastecimiento, utilizado por Aguas de Alicante,EM(AMAEM),combinadeformaeficientedostiposderecursos:
• Superficiales:procedentesdelaMancomunidaddelosCanalesdelTai-billay,portanto,sincompetenciasparagestionarsuexplotación,man-teniendosolamenteelcontroldeladistribución.Unacaracterísticabási-ca de este tipo de recurso es el predominio de los recursos frente a las reservas.Elorigendeestetipoderecursossehadiversificadodurantelos últimos años, incluyendo en la actualidad un importante porcentaje derivado de procesos de desalación.
• Subterráneos:procedentesdeconcesionesadministrativasdeaprove-chamiento de aguas subterráneas propias—ya sean explotadas concaptacionesdetitularidaddeAMAEMoajena—y,portanto,conposi-bilidades de controlar el ciclo integral de gestión, abarcando tanto su captación, transporte como su distribución. En este tipo de recursos, al contrario que en el caso anterior, priman las reservas frente a los recursos.
RESILIENCIA EN EL CICLO URBANO DEL AGUARECURSOS HÍDRICOS
(ya sea en cuanto a fuentes potenciales de recursos, en el caso de aguas superficiales,comoautilizacióndedistintasmasasdeaguasubterráneas,enelcasodeaguassubterráneas),hapermitidosentarlasbasesquepro-porcionanalabastecimiento,lassuficientesgarantíasdesuministro,tanne-cesarias para un abastecimiento de magnitud creciente como es el de Ali-cante y sus poblaciones colindantes, como para asegurar el suministro ininterrumpido de agua potable a la población, incluso en épocas especial-mente adversas como en las que nos encontramos actualmente inmersos, utilizandoparaellotantolosrecursoscomolasreservasdeaguasubterrá-nea, preservadas durante las épocas de menor demanda.
La mencionada garantía de suministro se fundamenta tanto en una ade-cuada y eficaz gestión en el uso conjunto de ambos tipos de recursos,como en su integración con otras técnicas de gestión del agua, como pue-den ser: la utilización de fuentes alternativas de agua para usos no pota-bles,lautilizacióndelacesióntemporaldederechos,tecnologíasdereuti-lización, etc.
Decapitalimportanciaserá,portanto,lacorrectaplanificacióndelefectodelos cambios que puedan producirse en el futuro sobre la demanda de recur-soshídricosysudisponibilidad,porefectosdelcambioclimático.
3.2.2. Eficiencia en el uso de los recursos hídricos
EnAlicante, lagestióneficaz seentiendecomo todas las laboresorientadas a la reducción de la entrada del recurso a la red de agua potable, alavezquesecumplenlasnecesidadesyderechosdelosabonadosydelos grupos de interés, en caudal, presión y calidad del agua.
Sobrelaeficienciaenlared,losestudiosincidenenlasaccionesencamina-das a la disminución del Agua No Registrada o ANR, siendo este indicador la diferencia entre el volumen de agua suministrada al sistema y el volumen de agua registrada en los medidores de los clientes (Alegre, 2000, 2006).
Acontinuaciónseexponeenformadediagramaslasactuacionestécnicasycomerciales destinadas a la reducción del ANR, agrupadas por objetivos (para un mayor desglose, consultar Álvarez et al., 2014).
32
Nº 8 / 2018
RESILIENCIA EN EL CICLO URBANO DEL AGUARECURSOS HÍDRICOS
Figura 8. Actuaciones técnicas y comerciales destinadas a la reducción del ANR
CONTROLACTIVO DE
FUGAS
REDUCCIÓNDEL
SUBCONTAJE
VELOCIDADY CALIDAD DEREPARACIÓN
MEJORA EN LALECTURA DE
CONTADORESPÉRDIDAS REALES
GESTIÓNINFRAEST.
MEJORA ENEL MANEJODE DATOS
GESTIÓNDE CLIENTESGESTIÓN DE
LA PRESIÓN
SECTORIZ.RED
REDUCCIÓNDEL FRAUDE
• Inevitables• Nivel económico• Potencialmente
recuperables
PÉRDIDAS COMERCIALES
• Inevitables• Nivel económico• Potencialmente
recuperables
Noesobjetodeestaexposicióneldesarrolloexhaustivodelasactuacionesplanteadas,peroseexponensomeramenteaquellasquepuedenresultarde mayor interés.
Sectorización de la red. Control de consumos mínimos nocturnosActualmente la red de distribución de Alicante es controlada a través de 67 sectoreshidráulicosquepermitenmonitorizarelcaudalsuministradoacadazona.Lareducidalongituddeestossectores(algomásdeochokilómetrosderedporsector,enpromedio)yelusodealgoritmosdeanálisismuyelabo-rados para el estudio del caudal mínimo nocturno permiten detectar fugas en fasesmuytempranas.Enocasiones,sehallegadoadiagnosticarylocalizarfugasdecaudalestanreducidoscomo500litrosalahora.
Control activo de pérdidas en la red: priorización en la búsqueda de fugasRealización de inspecciones preventivas de la red de distribución, según una frecuencia óptima de cada sector. Estas inspecciones se programan mediantelaayudadelaherramientainformáticaPRIFUaplicadaalabús-queda preventiva en la totalidad de la red.
Gestión de infraestructuras: mejoras en automatizaciónMonitorizacióncontinuadelared,paralocualestánoperativas114estacionesde telemando y telecontrol y 156 dataloggers. En concreto se supervisan 150 niveles, 32 analizadores de cloro en continuo, 234 contadores y 185 presiones.
Gestión de infraestructuras. Doble Red Urbana para la Reutilización de aguas (DRUR)EncapítulosposterioresseexplicaráeldesarrollodelaDRURycómohaprovocado en pocos años un cambio en el patrón de consumo en parques y jardines públicos y privados.
33
Nº 8 / 2018
RESILIENCIA EN EL CICLO URBANO DEL AGUARECURSOS HÍDRICOS
Reducción del subcontajeRenovación y actualización del parque de contadores, determinada por cri-terios de edad media, volumen medido y retorno de la inversión. En el perio-do2012-2016sehanrenovadounamediade25.382contadores,alcanzandoelmáximoenelaño2015con27.077medidores.
Mejora en la lectura de contadoresImplantacióndelatelelecturaderedfija,víaradiodelargoalcance,previstaparalatotalidaddelparquedecontadores.Enelaño2017estáimplantadaen el 60% del parque de contadores.
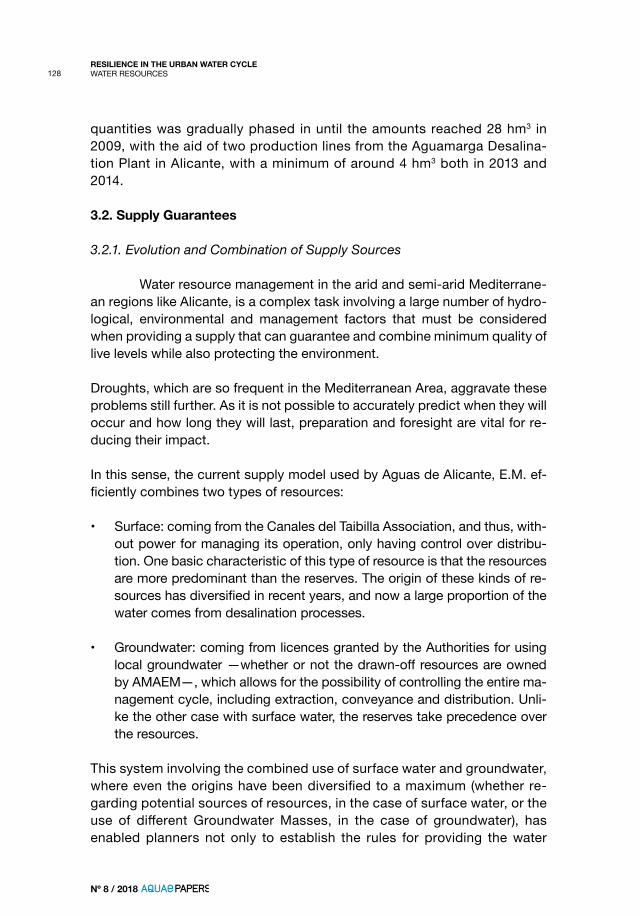
Gestión de clientes: lecturas e información comercialLecturasistemáticadetodoslosclientes,implantacióndetelelecturacomoyasehaexpuesto,actualizaciónconstantedelainformacióncomercial,másde 185.291 consultas atendidas en la línea 900 de atención telefónica gratui-ta, etc.
Gestión de clientes: concienciación de uso eficienteEntre2007y2016másde30.500alumnossehanconcienciadomediantepro-gramas educativos dirigidos a colegios, institutos y universidades. Un indica-dordedichaconcienciaciónesladisminucióndeladotaciónenlitrosaldíaporcontrato(esdecir,porpuntodesuministro)expuestaacontinuación.
Figura 9. Evolución de la dotación de agua suministrada y número de contratos 1991-2016
100
120
140
160
180
200
220
0
50.000
100.000
150.000
200.000
1991
19
92
1993
19
94
1995
19
96
1997
19
98
1999
20
00
2001
20
02
2003
20
04
2005
20
06
2007
20
08
2009
20
10
2011
20
12
2013
20
14
2015
20
16
Contratos m3/contrato/año
Rendimiento técnico hidráulico Las actuaciones encaminadas a conseguir reducciones del Agua No Regis-trada(ANR),comolasexpuestas,sonlabaseparaalcanzarmejoresvaloresenlosdosprincipalesindicadoresdeeficiencia(Álvarezet al., 2014): rendi-mientotécnicohidráulicoyniveleconómicodepérdidas
34
Nº 8 / 2018
RESILIENCIA EN EL CICLO URBANO DEL AGUARECURSOS HÍDRICOS
En concreto, en Alicante el valor del agua suministrada al sistema durante los últimos25añossehamantenidorelativamenteestable.
Figura 10. Evolución del agua suministrada 1991-2016
0 5
10 15 20 25 30 35
1991
1992
1993
1994
1995
1996
1997
1998
1999
2000
2001
2002
2003
2004
2005
2006
2007
2008
2009
2010
2011
2012
2013
2014
2015
2016
Suministro (Hm3)
Ademásdelascausasqueincidendirectamenteenladisminucióndecon-sumopercápita,comoloscambiosenloshábitosdeconsumoylaeficienciacreciente de los electrodomésticos (Albiol y Angulo, Aquae Papers nº 6, “La reducción del consumo de agua en España: Causas y tendencias”), en el casodeAlicantehantenidoespecialrelevanciamediantecorrectaspolíticasde gestión (renovación de contadores, telelectura, renovación de las redes de distribución,etc.)quehanpermitidomantenerelrendimientotécnicohidráu-lico en torno al 90% en la ciudad de Alicante en el periodo 2010-2015.
Figura 11.RendimientotécnicohidráulicoenAlicanteyporcomunidadesautónomas
0 10 20 30 40 50 60 70 80 90
100
Alica
nte
ciuda
dAn
dalu
cíaAr
agón
Astu
rias
Bale
ares
, Isla
sCa
naria
sCa
ntab
riaCa
still
a y L
eón
Cast
illa-
La M
anch
aCa
talu
ñaCe
uta
y Mel
illa
Com
unid
ad V
alen
ciana
Extre
mad
ura
Galici
a
Mad
rid, C
omun
idad
de
Mur
cia, R
egió
n de
Navar
raPa
ís Va
sco
Rioj
a, La
35
Nº 8 / 2018
RESILIENCIA EN EL CICLO URBANO DEL AGUARECURSOS HÍDRICOS
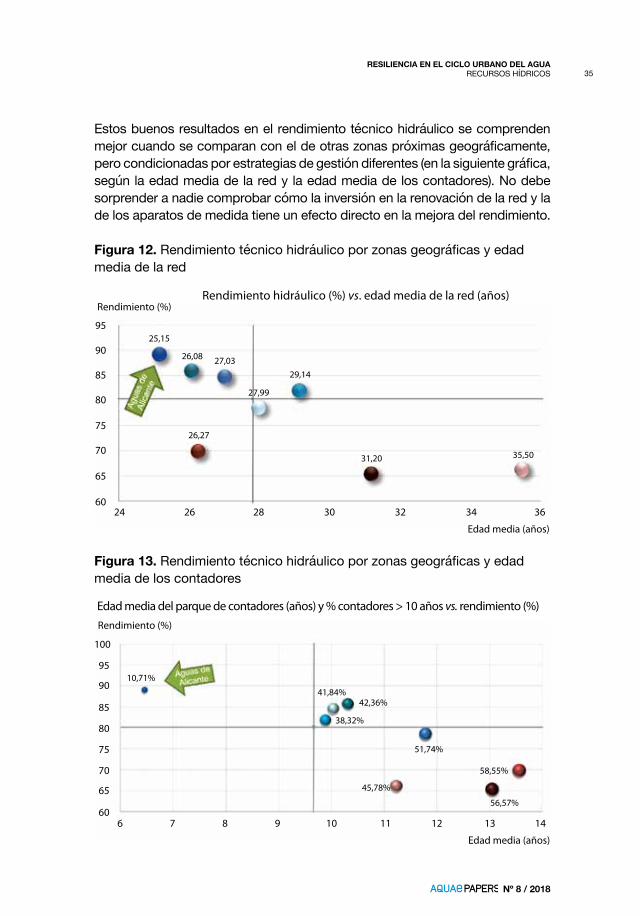
Estosbuenosresultadosenelrendimientotécnicohidráulicosecomprendenmejorcuandosecomparanconeldeotraszonaspróximasgeográficamente,perocondicionadasporestrategiasdegestióndiferentes(enlasiguientegráfica,según la edad media de la red y la edad media de los contadores). No debe sorprender a nadie comprobar cómo la inversión en la renovación de la red y la de los aparatos de medida tiene un efecto directo en la mejora del rendimiento.
Figura 12.Rendimientotécnicohidráulicoporzonasgeográficasyedadmedia de la red
Rendimiento hidráulico (%) vs. edad media de la red (años)Rendimiento (%)
95
90
85
80
75
70
65
60 24 26 28 32 34 36
35,5031,20
26,27
27,99
29,1427,0326,08
25,15
Edad media (años)
30
Figura 13. Rendimientotécnicohidráulicoporzonasgeográficasyedadmedia de los contadores
Edad media del parque de contadores (años) y % contadores > 10 años vs. rendimiento (%)Rendimiento (%)
95
100
90
85
80
75
70
65
60 6 7 8 9 10 11 12 13 14
Edad media (años)
10,71%
41,84%42,36%
38,32%
51,74%
45,78%
58,55%
56,57%
36
Nº 8 / 2018
RESILIENCIA EN EL CICLO URBANO DEL AGUARECURSOS HÍDRICOS
Nivel económico de pérdidasNo por obvio es menos importante recordar que las redes de distribución soninfraestructurasocultas,cuyacondiciónesdemuydifícildiagnóstico;ysin embargo, es preciso, en la medida de lo posible, anticiparnos a su fallo ynolimitarnosaunaestrategiareactivacuandoesteyasehaproducido.Este objetivo solo se puede alcanzar mediante su renovación en el momen-to correcto. El elevado coste e impacto de las renovaciones de redes, así como la importancia clave de mantener estas infraestructuras en las mejo-rescondicionesposiblesparaminimizarlasfugasyroturas,hacenimpres-cindible el uso de aplicaciones de optimización que den soporte a la deci-siónenesteámbito.Conestefin,sedesarrollólaherramientaMETRAWAdepriorización en renovación de redes.
Estaherramientainformáticamulticriterio(contemplatantofactorestécni-cos como económicos) determina los tramos de red a renovar en el corto, medio y largo plazo, según el nivel de inversiones disponible. De esa forma, laherramientaaplicacriteriosexpertosdeformasistemática,evitandoses-gos subjetivos, omisión de datos, etc. Esta solución, que se calibra perió-dicamente en función de los resultados reales, también proyecta simula-ciones de la evolución del rendimiento en caso de distintas asignaciones económicas a la renovación.
3.3. La reutilización de agua para usos urbanos en Alicante
Unodelosfactoresclavesparaentenderelusoeficientedelosre-cursosenelcasodeAlicante,yengeneralenelcontextomediterráneo,esla reutilización del agua depurada y regenerada. Por su importancia presente y su potencial futuro, merece un epígrafe aparte en este estudio.
Aunqueladiversificacióndefuentesyamencionadahapermitidodisponerde un suministro garantizado de agua, el uso de estos recursos de difícil obtención, que conllevan procesos de desalación, transporte desde grandes distanciasy/oextracciónagranprofundidad,paraciertosusos(riegourba-no, baldeo de calles, etc.) no es deseable.
3.3.1. El desarrollo de la Doble Red Urbana para la Reutilización de aguas
EnAlicante,elorigendelareutilizacióndelaguapuedetrazarsehas-ta el año 1995, en el que el campo de golf de Bonalba solicita la concesión
37
Nº 8 / 2018
RESILIENCIA EN EL CICLO URBANO DEL AGUARECURSOS HÍDRICOS
de agua reutilizada para el riego de sus instalaciones. Esta reutilización se convierteenrealidadalañosiguiente,cuandolaEmpresaMixtadeAguasResiduales de Alicante, S.A. (EMARASA) pone en funcionamiento la primera estación de tratamiento terciario de Alicante, con una capacidad de 2.500 m3 diarios.
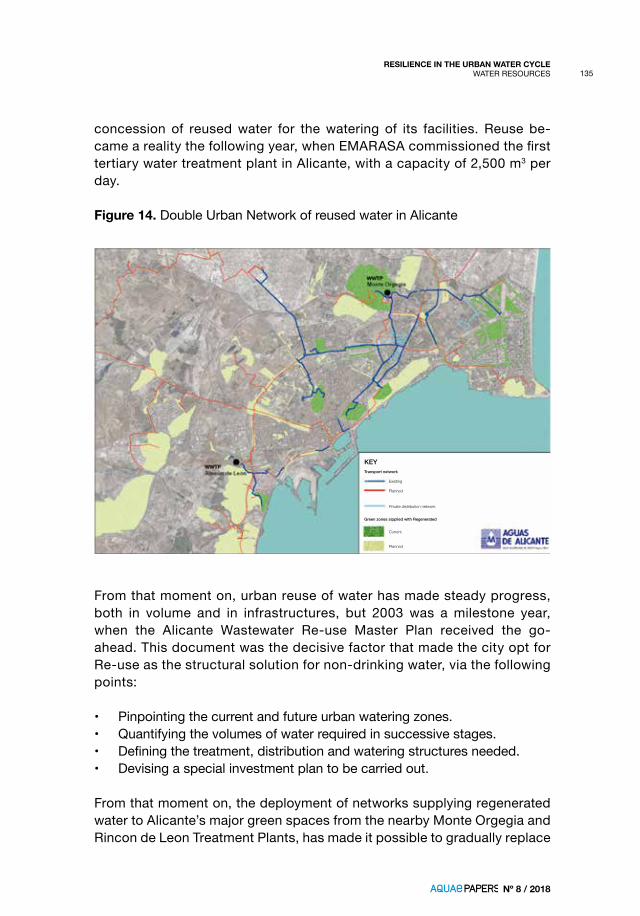
Figura 14. Doble Red Urbana para la Reutilización de aguas (DRUR) en Alicante
A partir de aquí, la reutilización urbana avanza progresivamente, tanto en volumencomoeninfraestructuras,peroelhitofundamentalllegaen2003,con la aprobación del Plan Director de Reutilización de Aguas Residuales de Alicante. Este documento marca la apuesta decidida de la ciudad por la reu-tilización como solución estructural para los usos no potables, a través de los siguientes puntos:
sarias.• Creación de un plan especial de inversiones a desarrollar.
Desde ese momento, el despliegue de las redes que, desde las cercanas de-puradoras de Monte Orgegia y Rincón de León, suministran agua regenerada
38
Nº 8 / 2018
RESILIENCIA EN EL CICLO URBANO DEL AGUARECURSOS HÍDRICOS
alasgrandeszonasverdesdeAlicantehapermitidolasustituciónpaulatinadeloscaudalesdeaguapotable,posibilitandoademáselcrecimientodelacoberturavegetalenlaciudad.Dosgráficasresultansumamenteilustrativasa este respecto:
Figura 15. Evolución del uso urbano de agua regenerada y crecimiento de zonas verdes
20022003
20042005
20062007
20082009
20102011
20122013
20142015
1.200.000
Zonas verdesen Alicante 2015
2006
2002· 3,5 m2 por habitante
· 5,3 m2 por habitante
· 9,7 m2 por habitante
Volu
men
agu
a re
utili
zada
(m3 )
Uso urbano de agua reutilizada en Alicante 2002-2015
1.000.000
800.000
600.000
400.000
200.000
0
En la primera, podemos ver la evolución del consumo de agua regenerada para usos urbanos en el periodo 2002-2015, mientras que la segunda nos muestralaevolucióndelasuperficiedezonasverdesporhabitanteenestemismo periodo.
3.3.2. Impacto del agua regenerada en el ámbito urbano
La importancia de este último indicador viene soportada por los múltiples estudios que avalan la importancia de las zonas verdes para la salud física y mental de los ciudadanos. Baste destacar que la Organización MundialdelaSalud(OMS)lohaincluidoexplícitamenteentrelosIndicadoresde Salud en Ciudades Sostenibles, con un valor objetivo de 10 m2/habitante.El informe de la OMS Urban green spaces and health (“Espacios verdes ur-banosysalud”,2016)hacerevisióndetodaslasevidenciascientíficasquerelacionan los efectos positivos de la presencia de parques y jardines con la mejoradelasalud.Entrelosbeneficiosencontrados,seencuentranaquellosque las zonas verdes ejercen sobre el sistema inmunitario, la obesidad, el sueño, las capacidades cognitivas, el sistema cardiovascular, la esperanza de vida o incluso los indicadores de criminalidad.
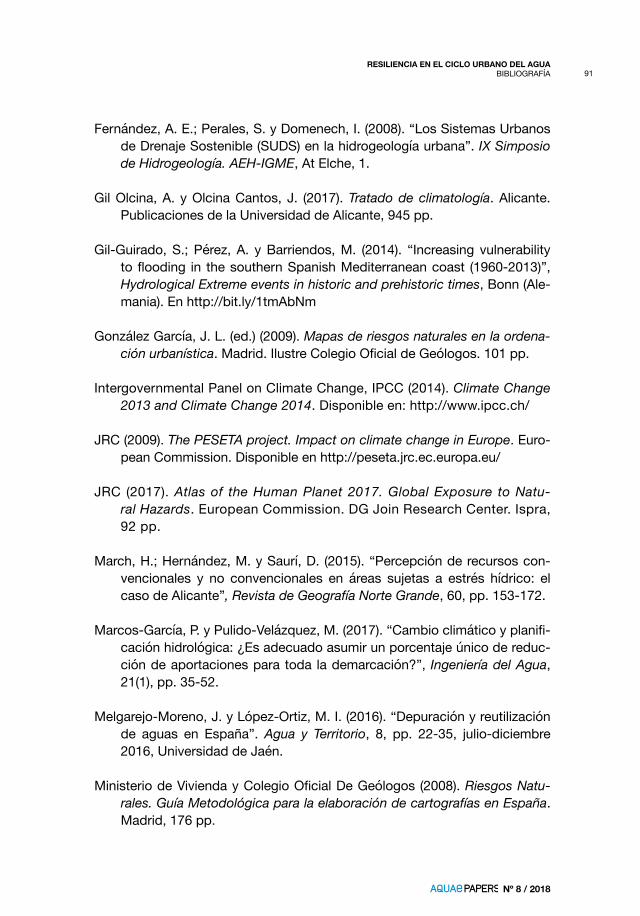
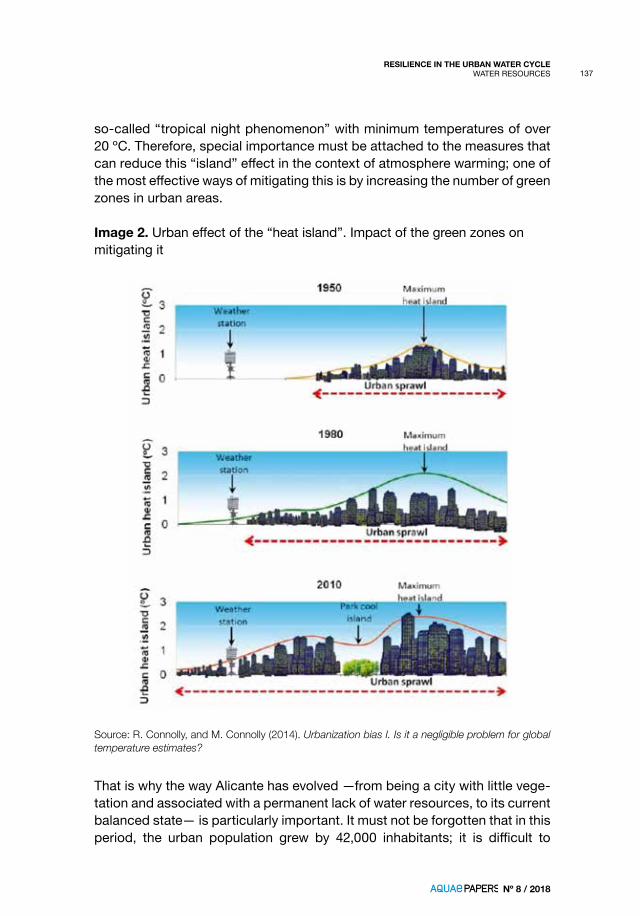
Es bien conocido el denominado “efecto de isla de calor” que eleva la tem-peraturadelasciudadesdebidoalamayorsuperficiedeabsorciónquepre-sentan las zonas edificadas.Este efecto tiene especial impacto sobre las
39
Nº 8 / 2018
RESILIENCIA EN EL CICLO URBANO DEL AGUARECURSOS HÍDRICOS
temperaturasmínimas(nocturnas)quesepuedenllegaraelevarenmásde2 ºC. La importancia de este efecto queda clara cuando recordamos que unadelasconsecuenciasdelcambioclimáticoes,precisamente,lapérdi-dadeconfort climáticodel áreamediterráneaquese refleja, entreotrascosas,enlamayorincidenciadelasconocidascomo“nochestropicales”,con temperaturas mínimas superiores a 20 ºC. Por tanto, las medidas que puedan disminuir este efecto de isla cobran especial importancia en el con-textodelcalentamientoatmosférico.Unade las formasmáseficacesdelograr mitigarlo es, precisamente, mediante el crecimiento de las zonas verdes urbanas.
Imagen 2. Efecto urbano de isla de calor. Impacto de las zonas verdes en su mitigación
Fuente: R. Connolly y M. Connolly (2014), Urbanization bias I. Is it a negligible problem for global temperature estimates?
40
Nº 8 / 2018
RESILIENCIA EN EL CICLO URBANO DEL AGUARECURSOS HÍDRICOS
Esporelloque laevolucióndeAlicante,desdesucarácterdeciudadsinespacios vegetales, asociada a la permanente falta de recursos hídricos,hastasuequilibradasituaciónactual,esespecialmenterelevante.Noolvide-mosqueenesteperiodolapoblaciónurbanacrecióen42.000habitantes;esdifícilimaginarcuálhubierasidoelpanoramasinelconcursodelareutiliza-ción.Sepuedeafirmar,sinningunaexageración,queelaguareutilizadaaña-deunadimensiónextraalaresilienciaurbana:laresilienciapsicológicaquelas zonas verdes proporcionan a los pobladores de la ciudad ante las presio-nes crecientes que pueden afectar negativamente a la salud, tales como polución,ruido,sedentarismootemperaturasextremas.
3.3.3. Contexto económico de la reutilización
La implantación de las infraestructuras necesarias para distribuir el agua regenerada en un entorno urbano consolidado requiere de una inver-sión significativa: se trata de una infraestructura a desarrollar desde cerocuyo coste debe ser competitivo. Una aplicación reduccionista del principio de recuperación de costes establecido en la Directiva Marco del Agua (DMA) podría, por tanto, convertir en inviable su desarrollo, al cargar con costes inasumibles un recurso cuyo uso dejaría de ser rentable.
En este punto, es obligado abrir la perspectiva y recordar que el ciclo urbano del agua es un proceso continuo e integrado, del que la regeneración es un eslabóninseparable.Sicabealgunadudaalrespecto,bastaríaconhacerlapreguntainversaqueP.RougéyF.Hernándezproponíanen2016:“¿Cuál es el coste de no regenerar?”.Enuncontextodeescasezderecursoshídricos,larespuestaesinmediata:lanoreutilizaciónsupondráunadisminucióndeladisponibilidad de los recursos destinados al consumo potable (y agrícola) y en un coste creciente de estos. De otra forma, la inversión en infraestruc-turas de agua regenerada está dedicada a asegurar la garantía de su-ministro del agua potable y la contención de su coste. Como apunta Joa-quín Melgarejo (Depuración y reutilización de aguas en España, 2016) para favorecer la reutilización: “Resulta imprescindible establecer una política de precios que reparta los costes de la regeneración y la gestión de las aguas residuales entre la totalidad del consumo, estableciendo incentivos para lograr que en todos los sectores se utilice agua regenerada cuando esto sea posible”.
El argumento queda reforzado cuando comparamos la inversión y los costes de operación requeridos por las infraestructuras de reutilización con los de-dicados a tratamientos de depuración y potabilización. A este respecto, nos remitimosdenuevoaltrabajodeP.RougéyF.Hernández.
41
Nº 8 / 2018
RESILIENCIA EN EL CICLO URBANO DEL AGUARECURSOS HÍDRICOS
Tabla 5. Comparación de los costes de tratamiento en el ciclo urbano del agua
Tratamiento
Escala de producción
M (M< 1.000 m3/d)
L (1.000 m3/d <L <100.000 m3/d)
XL (XL>100.000 m3/d)
Potabilización
CAPEX (€/m3.d-1) – 350 250
OPEX (€/Dam3) – 70 60
Potabilización avanzada
CAPEX (€/m3.d-1) – 600 300
OPEX (€/Dam3) – 350 200
Depuración
CAPEX (€/m3.d-1) 2.500 1.000 500
OPEX (€/Dam3) 350 200 150
Reutilizacion (terciario con desinfección)
CAPEX (€/m3.d-1) 400 200 100
OPEX (€/Dam3) 40 30 25
Reutilización (desinfección y desalación)
CAPEX (€/m3.d-1) 1.000 600 300
OPEX (€/Dam3) 600 400 200
Desalación agua de mar
CAPEX (€/m3.d-1) 1.500 1.250 1.250
OPEX (€/Dam3) 600 550 500
Fuente: P. Rougé y F. Hernández, El coste de no regenerar, 2016.
Podemosresumirestascifrasafirmandoqueloscostesdeinversiónyope-ración del tratamiento de reutilización suponen, respectivamente, menos de una décima parte del coste de los restantes procedimientos del ciclo (pota-bilización y depuración). Otros puntos de comparación estudiados por los mismos autores nos muestran cómo las inversiones en el tratamiento tercia-riopararegeneraciónson,aproximadamente,unaquintapartedelasreque-ridasparaelalmacenamientoo,mássignificativamente,paradesplegartansolo 10 km de la red de transporte de agua en alta.
A estas consideraciones podemos añadir, obviamente, las ambientales: el con-sumoenergéticoy,porende,lahuelladelcarbonodelprocesodereutilización
42
Nº 8 / 2018
RESILIENCIA EN EL CICLO URBANO DEL AGUARECURSOS HÍDRICOS
vieneaser,enelmásdesfavorabledeloscasos,inferioraunadécimapartede la generada por la producción y potabilización del agua. El tratamiento terciario convencional de una Estación Depuradora de Aguas Residuales (EDAR) urbana, como el de la planta de Monte Orgegia en Alicante, tiene, de hecho,unahuelladecarbonoprácticamentenula.
Por otra parte, de acuerdo con el reciente estudio Reutilización de aguas regeneradas: aproximación a los costes de producción y valoración de su uso (Villar-García, 2016), que estima que el valor económico del agua reutili-zadaproducidaenEspañaestáentornoa2.165millonesdeeurosanuales,el retorno de inversión de este tipo de recurso es sobradamente positivo, en unarelacióndemásde1a3.
Además,comonosrecuerdaestemismoautor,existenotrasvaloracionesasociadas al proceso de reutilización añadidas al valor del recurso que podemos medir en términos económicos, como es el caso de la elimina-cióndevertidosdecargaorgánicaalmedionatural.Alsuponeruntrata-miento mejorado respecto del requerido por la normativa para su vertido al medio natural (tratamiento secundario), se elimina cierta carga de contami-naciónque,deotromodo,acabaríaenelmedio receptor;enelcasodeAlicante,elmarMediterráneo.DeacuerdoconlaestimacióndeVillar-Gar-cía, “en términos absolutos, el tratamiento terciario y su posterior reutiliza-ción elimina vertidos totales al medio natural que podemos cifrar en unas 1.450 toneladas de nitrógeno, 290 toneladas de fósforo y 4.500 toneladas de DBO5”.
Almargendeestasreflexiones,lainversiónenreutilización,comoencual-quier otra infraestructura, no puede perder de vista la otra parte de la ecua-ción: el aseguramiento de los usos y usuarios. Esta condición aparente-menteobviaesclavealahoradeasegurar laviabilidadeconómicadelasactuaciones y el cumplimiento de sus objetivos. Tras el impulso inicial que la concesión solicitada por el campo del golf de Bonalba supuso para Alicante, laestructuradefinanciaciónytarifasquesedescribenenelsiguienteapar-tado fueron fundamentales para la implantación de la doble red.
3.3.4. Factores de éxito
Comosehaexplicadoanteriormente,laadecuadaplanificaciónylaapuesta decidida por la reutilización fueron elementos claves del desarrollo deesterecurso;sinembargo,hayotrosaspectossinloscualesestaexpe-riencianopuededesarrollarseconéxito:unaestructuraadecuadadetarifasyfinanciacióndeinfraestructuras,yunaltoniveldeexigenciatécnica.
43
Nº 8 / 2018
RESILIENCIA EN EL CICLO URBANO DEL AGUARECURSOS HÍDRICOS
Deformacoherentecon lavisión integraldelciclodelaguadescritaenelapartadoanterior,laestructuradefinanciaciónadoptadaenAlicantepuederesumirse de forma relativamente simple: las inversiones en infraestructuras de reutilización son respaldadas de forma conjunta por las tarifas de agua potable y reutilizada, mientras que los costes de operación (tratamiento, energía, mantenimiento, etc.) son repercutidos únicamente en la tarifa de la segunda. El precio medio del agua reciclada resultante de este esquema7 es de0,35euros;aproximadamentelaquintapartedelcorrespondientealaguapotable,deformaqueselograconéxitoelobjetivodefomentarlaadopcióndel recurso alternativo.
Imagen 3. Parque del Palmeral, Alicante
Por otra parte, no podemos dejar de mencionar la importancia de un ade-cuadodesarrollotécnicoytecnológicoenlaimplantacióndelareutilización;la eventual consideración de usos secundarios del riego o la limpieza de callespodríahacernoscaerequivocadamenteenuninsuficienteniveldeexi-gencia. En este sentido, es preciso recordar que la legislación española (RD 1620/2007) establece unos requisitos que, en ocasiones (véase el caso de
7 En enero 2018.
44
Nº 8 / 2018
RESILIENCIA EN EL CICLO URBANO DEL AGUAEL DRENAJE URBANO
laturbidez),lleganasermáselevadosqueaquellosdefinidosparaelaguapotable;sinembargo,esresponsabilidaddelgestorestablecerloscontrolesyestrategiasquepermitanasegurardichosniveles.Así,enelcasodeAlican-te,eldesarrolloyaplicacióndesolucionestecnológicashasidoconstante;desde sistemas de protección en las acometidas para evitar la posibilidad de comunicación entre las conducciones de agua potable y las de agua regene-radaoladefinicióndenormasespecíficasdeinstalación,hastalaoxigena-ción de los almacenamientos y el telecontrol de las redes.
Finalmente,ladescripcióndelaexperienciadeAlicantenoseríacompletasinosehicieramencióndestacadadelapoyopúblicoeinstitucionalatodaslasiniciativas relacionadas con la reutilización en la ciudad. En este sentido, cabe subrayar la unanimidad de todos los representantes públicos en el res-paldoatodaslasdecisionesquehanpermitidolaimplantacióndelaguare-generadaparausosurbanos,deformaquenuncahasidoobjetodecontro-versia política. Igualmente fundamental ha sido la positiva aceptación detodoslosalicantinos,hastaelpuntodequehoyendíanosecomprenderíapor parte de la ciudadanía el uso de agua potable para el riego de los par-ques y jardines de Alicante.
4. EL DRENAJE URBANO
Lacalidaddelmedioenlaciudad,elcaráctermásomenosacordede su trama con el soporte físico donde se asienta, debe considerar, entre otrosfactores,elriesgofrenteaepisodiosnaturalesderangoextraordinarioysuposibleprevención.Lasmedidasestructuraleshansidolasoluciónmásdesarrollada en las ciudades para mejorar las condiciones del drenaje urbano y evitar así que las aguas pluviales pudieran causar daños en las tramas ur-banas.EnEspañay,especialmente,enlasáreasdellitoralmediterráneo,estohasidomanifiestoapartirdelasegundamitaddelsigloXIX,cuandolaexpan-sión moderna de las ciudades obligó a idear e incorporar actuaciones desde la ingeniería para reducir la circulación de la escorrentía pluvial por las calles ysusefectosnodeseados.Porsuparte,losprocesosdeplanificaciónterri-torialennuestropaísnohantenidoencuentaelaspectodelriesgonaturalhastafechareciente.Anivelestatal,soloapartirdelaño2008,conlaaproba-cióndelaleydelsuelo(rev.en2015)hasidoobligatorioelaborarmapasderiesgonaturalparasuconsideraciónenlaplanificaciónurbanayterritorial.Sibienesciertoquealgunascomunidadesautónomashabíanelaboradonor-mativas y planes, algunos años antes, para reducir el riesgo de inundaciones mediante la ordenación territorial; en el litoralmediterráneo español, es elcaso de la Comunidad Valenciana, Cataluña, Andalucía y Baleares.
45
Nº 8 / 2018
RESILIENCIA EN EL CICLO URBANO DEL AGUAEL DRENAJE URBANO
Hayquedestacarelhechodeque,enlaciudad,lareduccióndelriesgodeextremospluviométricosdebecombinar,demodo inteligente,actuacionesde tipo estructural con medidas de ordenación territorial. Las primeras solu-cionanlosproblemaspresentesdedrenajequeyaexistenenlasciudadesyquesemanifiestancuandoaconteceunepisodiodelluviasextraordinarias.Las segundas preparan el territorio para el futuro, evitando, mediante el res-petoalasáreasquepresentanaltoriesgo,consecuenciasnodeseadasencaso de lluvia torrencial. Y a ello se suma la necesaria información y buena educación para el riesgo de los ciudadanos en estos entornos urbanos de riesgo.
La ciudad de Alicante presenta un elevado riesgo frente a las inundaciones causadasporlluviasdeelevadaintensidadhoraria.Esesteunodelosras-gosgeográficossignificativosquehancaracterizadohistóricamentesuevo-luciónurbana,ylosiguehaciendoenlaactualidad,.Algunosdesusbarrioshanpadecidoseriosproblemasaconsecuenciadeavenidasimpetuosasdebarrancosurbanos,quesehansaldadoconimportantesdañoseconómicosyconlapérdidadevidashumanas.Sinolvidarsucesoshistóricosquemere-cen tratamiento destacado en las crónicas de la ciudad (Nicasio Camilo Jo-ver,1863;Viravens,1876),larelación—amplia—deepisodiosacaecidosalo largo del siglo XX demuestran la elevada vulnerabilidad de la trama urbana frentealascrecidasdeunaseriedecauces(barrancos,ramblizos)quehanidoincorporándosealcallejero.Laampliacióndelazonaurbanizadanoharespetado, en ocasiones, el trazado de ramblizos que descienden desde los cerros que salpican su territorio (Tossal, Benacantil, Garbinet, Orgegia, San Julian, Fontcalent) o barrancos que desaguan en el litoral alicantino proce-dentes de los relieves prebéticos que orlan el Campo de Alicante (barrancos de Juncaret, Ovejas, Agua Amarga). Los sectores urbanos de San Gabriel, Sangueta,áreacentralentornoalaRambladeMéndezNúñez,ÓscarEsplá,San Agustín y en la desembocadura del barranco de Maldo en La Albufereta, hansidolosespaciosregularmenteafectadosenlosúltimoscienañosporlasinundaciones.AellossesumaeláreacentraldelaplayadeSanJuan,quehacrecidoapartirdeunantiguoespaciomarjalencoquequedaanega-do, recuperando su antigua función natural, cuando descargan precipitacio-nes intensas.
4.1. Antecedentes históricos. Evolución urbana de Alicante: un proceso de “digestión” progresiva de barrancos en su trama urbana
La evolución urbana de la ciudad de Alicante puede entenderse como laadaptacióndesucaserío,alolargodelahistoria,altrazadodeloscur-sosfluvialesquetapizanelcampodeAlicante.Cincobarrancosprincipales
46
Nº 8 / 2018
RESILIENCIA EN EL CICLO URBANO DEL AGUAEL DRENAJE URBANO
(Canicia,Bonhivern,SanAgustín-SanBlas,OvejasyAguaAmarga)hansido,sucesivamente,“digeridos”porlatramaurbana,incrementándoseelriegodeinundaciónenlasáreassituadasensucurso.Aellosseunenlosbarrancosde Orgegia y Juncaret en el sector septentrional del término municipal y el áreadeavenamientoprecario(endorreísmo)delaplayadeSanJuan.Lavulne-rabilidad de la población alicantina frente al fenómeno natural de las inunda-cioneshaaumentadoencorrespondenciaalaocupacióndelterritorio.
La ciudad de Alicante en su emplazamiento actual en las faldas del monte Benacantilhatenido,desdesufundaciónárabe,unelementodereferenciaurbana importante en el trazado del barranco de Canicia que supuso una barreranaturalparaelcrecimiento.Estecurso,conorigenenlasproximida-desde las lomasdeVirgendelRemedio,descendíahaciaelpiedemontemeridionaldelcerrodelBenacantilparadesembocarenlafachadalitoral.Apartir del siglo XVI se produce la primera “digestión” de un barranco en la tramaurbanaalicantina.Enefecto,endichacenturiaseproducelaforma-cióndedosarrabalesextramuros:eldeSanAntónyeldeSanFrancisco.Eldesarrollo de este espacio urbano suponía la incorporacióndefinitivadelbarrancodeCaniciaalcallejeroalicantino,aunquenoseráhastaelsigloXIXcuando su condición original de vaguada se transforme en calle propiamen-tedicha.
En el siglo XVIII tiene lugar el desarrollo de un nuevo arrabal, el Arrabal Roig, que supone el inicio de la integración progresiva a la trama urbana alicantina de un nuevo cauce, el barranco del Bon Hivern o de La Goteta que, con ori-genen lasproximidadesde las lomasdelGarbinet,circulapor lavertienteseptentrionaldelaSerraGrossa—ensutramomeridional—ydesembocabaoriginariamente junto a la playa del Postiguet.
Doshechosimportantesmarcanelcrecimientodelcaseríoalicantinoenlasegunda mitad del siglo XIX, en lo que respecta a la incorporación de ba-rrancosa su tramaurbana: la aprobacióndelproyectodeensanchey laconstruccióndelbarriohigienistadeBenalúa.Elprimerosuponíalaconso-lidacióndelcallejeroque,porlodemás,serealizaríaalolargodelsigloXX.Con ello quedaba perfectamente asumida la incorporación del barranco de Canicia y de la serie de ramblizos que descienden, en sentido norte-sur, desde el cerro de El Tossal de San Fernando y que atraviesan una serie de callesdelpropioensanche;asícomolosqueensentidoeste-oestealimen-tan el barranco de Canicia por sumargen derecha. La construcción delbarrio de Benalúa en la segunda mitad del siglo XIX, representaba la incor-poración a la trama urbana de la ciudad de un nuevo barranco, el de San Agustín-San Blas.
47
Nº 8 / 2018
RESILIENCIA EN EL CICLO URBANO DEL AGUAEL DRENAJE URBANO
Figura 16. Mapa de la evolución urbana de la ciudad de Alicante, hastaelsigloXVIII
ElsigloXXy,enparticular,susegundamitad,eselsiglodelaexplosiónurba-naquesemanifiestaconlaincorporacióndefinitivaasucallejerodeloscua-trobarrancosprincipalesqueloatraviesan(Canicia,Bonhivern,SanBlas-SanAgustínyOvejas).Es,entonces,cuandolaexpansiónurbanadeAlicante,apartirdeespaciosderiesgodeinundación,terminaporconfigurarunaciudadcon alto riesgo ante este episodio natural.
LasegundamitaddelsigloXXconocelaocupacióndelosmárgenesdelba-rranco de las Ovejas en su tramo medio (polígono industrial del Llano del Espartal)ybajo(barriodeSanGabriel);laincorporacióntotaldelbarrancodeSan Agustín-San Blas, con la construcción del polígono de San Blas, por cuyoejecentral(avenidadelDoctorRico)circuladichobarranco;laconsoli-dacióndelsectoroccidentaldelensancheen tornoa laavenidadeÓscarEsplá,juntoalcaucedelbarrancodeBenalúa.Asimismo,seproducennue-vas“digestiones”debarrancosoáreasdeavenamientoprecarioenlatramaurbana. Así en el límite meridional del término municipal se incorpora el ba-rranco de Agua Amarga debido a la construcción del polígono industrial de Las Atalayas y del paso de la carretera nacional sobre el cauce mediante un puentedecaladoinsuficiente.LosbarrancosdeJuncaret,asupasoporel
48
Nº 8 / 2018
RESILIENCIA EN EL CICLO URBANO DEL AGUAEL DRENAJE URBANO
caseríodelaSantaFaz,OrgegiaysuconfluenciaeneldeMaldo(conjuntosresidenciales en la desembocadura del barranco en La Albufereta), se con-vierten asimismo en espacios de riesgo. La urbanización de la playa de San Juanserealizasobreunsectormarjalencotraselcordóndunardelaplaya;nodebesorprenderqueseconviertaenunáreadeencharcamientocuandoprecipitan fuertes lluvias. En el tramo medio del barranco de Orgegia el creci-mientodel caseríodeElPalamóse realizahaciael este, estoes,hacia lamargenderechadelpropiobarranco.
Alapropiaexpansióndeláreaurbanizadasehanunidootrosfactoresquecontribuyenaagravarelriesgodeinundación:lafaltadeplanificación,hasta1997,decolectoresdeaguaspluvialesdecapacidadsuficienteparaasumirgrandes trombas, el diseño de calzadas por donde circulan aguas de avenida deformaconvexaenlugardecóncava,lafaltadelimpiezadeimbornalesytrapas de evacuación de aguas del alcantarillado, el asfaltado de calles, la construcción de vías urbanas en sentido transversal al trazado de barrancos yconaliviaderosinsuficientesparalaevacuacióndeaguasdeavenida(GranVía);sonaspectosquehanidoaumentandolavulnerabilidaddelapoblaciónurbana de Alicante ante los episodios de lluvia intensa.
LaconfiguracióndelaciudaddeAlicantesepresenta,portanto,comoejem-plodeespaciourbanoqueha ido incrementandosuvulnerabilidadanteelriesgodeinundacionesamedidaqueseha idoconsolidandoelcaserío.Ytodoelloenunaconcepcióndeciudaddondeimperalaprácticaurbanizado-raylaocupacióndelsuelofrentealaplanificacióncuidadosadeusosyes-pacios, y el respeto a los elementos del medio físico que condicionan el de-venirdeunterritorio.EstahasidounaprácticacomúnamuchasciudadesdellitoralmediterráneoespañolalolargodelasegundamitaddelsigloXX.Lanecesidaddesuelo,lademandadevivienda,haobligadoaclasificaráreasde suelo urbano con una celeridad incompatible con la ocupación racional delterritorio.Ellogeneraáreasderiesgoenelmediourbano,convirtiendoenvulnerables las sociedades que allí se acomodan.
4.2. Orígenes y desarrollo de la red de drenaje en Alicante
Comoyasehaexplicadoconanterioridad,laciudaddeAlicantehacrecidodesdelasladerasdelmonteBenacantilhaciacotasinferiores,incor-porando en cada ampliación los diferentes barrancos que ejercían como fronteras naturales a su desarrollo: Mina, Carmen-San Rafael, Canicia, San Agustín-San Blas, Ovejas, Agua Amarga, Orgegia, Juncaret, etc. (Marquie-gui, 2012 y Olcina, 2004). Sin embargo, la incorporación de las sucesivas ramblas al recinto urbano no se acompaña de las obras necesarias para
49
Nº 8 / 2018
RESILIENCIA EN EL CICLO URBANO DEL AGUAEL DRENAJE URBANO
resolver los episodios de lluvia y, por tanto, primero los “cronicones” (Bendi-cho,1640;MaltésyLópez,circa1752;Jover,1862;yViravens,1876),ymástarde la prensa (Olcina et al.,2003),hablandeperiódicasinundacionesqueocasionan recurrentes perjuicios.
ComoejemplodeestoresultailustrativorevisarlosdosartículosdeEcharri,2011y2013.Enellosseexponecómoprimeroenelaño1752ydespuésen1772 las avenidas del barranco de San Agustín-San Blas desmontan los pa-ramentosdelbaluartedeSanCarlos,queseubicabaenlaconfluenciadelaactual calle Ramón y Cajal con la de Canalejas. Se desvía el barranco de San Agustín-San Blas abriendo un nuevo cauce a las aguas pluviales que se co-rrespondeconlaactualavenidadeÓscarEsplá(caucequeabsorberálaciu-dadafinalesde1970conunaconducciónde2.000mmquesemostróinsu-ficienteenlasriadasde1982y1997).
4.2.1. Primeras actuaciones históricas sobre el drenaje
Comoantecedenteshistóricosdestacadosdeobrasdedrenajeur-banoenlaciudaddeAlicante,hayquereferirsealaactuacióndederivacióndeaguasdelbarrancodeCanicia llevadasacaboafinalesdelsigloXVIII,tras el episodio de lluvia torrencial del 7 de noviembre de 1791. Los efectos causadosenlaactualplazadeChapíeinmediatoconventodelasmonjascapuchinas,asícomoenlosalmacenesdecomerciosituadosenlacalledelBarranquet, impulsaron la construcción de un foso de derivación de aguas. El coste total de la obra fue de 58.056 reales de vellón (Ramós Hidalgo, 1984). La propia construcción de la nueva muralla de la ciudad en el siglo XVIII con-templólaexcavacióndeunfosoqueseríautilizadoconelpasodelosañoscomo sistema de evacuación de aguas sucias.
Conrespectoalareddesaneamiento,seconocequeexistíanalmenosdosconductos que vertían al mar, al oeste del primitivo muelle, y otros dos, al estededichomuelle,graciasalosdosplanosdeManuelMiralles(sic. Manuel Mirallas), titulados Plano de Alicante e inmediaciones y Plano geométrico iconográfico del muelle de la ciudad de Alicante, esteúltimo reflejandounproyecto que no se ejecutará y ambos fechados cerca de 1794 (Aguilar,2012).
Otraaproximaciónaldesarrollodelareddesaneamientoconsisteenlarevi-sióndeingresosygastosde1797reflejadaporJover,dondenoconstapar-tida para el alcantarillado, aunque se observa una mínima dotación en obras yconservación.TambiénreflejaelpropioJoverelpresupuestoparaelcolec-tor de La Mina en 1787, así como los presupuestos para el alcantarillado de
50
Nº 8 / 2018
RESILIENCIA EN EL CICLO URBANO DEL AGUAEL DRENAJE URBANO
las calles Mayor, San Francisco, Blasco (actual Pascual Blasco), Castaños, Bailén y San Fernando en los año 1859-1863. Referente a estas obras de mediadosdelXIX,Joverafirma:“[…]sepensóenperfeccionarelsistemadecloacas,alcantarillasydemásobrassubterráneas,tramoquetambiénseha-bía mirado con reprensible abandono”.
4.2.2. El crecimiento del puerto de Alicante y su impacto sobre el drenaje urbano
El consulado del mar en 1785, la constitución como capital de la provinciaen1822,asícomolaconexiónferroviariaconMadriden1858su-pusieron un claro auge comercial que conllevó la esperada ampliación del puerto con la ejecución del nuevo muelle de Poniente, cerrando con ello la dársenadeAlicante.Sinembargo,laconstruccióndelmencionadomuelle,finalizadaen1873,supusodurante40añoselmayorproblemasanitariodelaciudad, en línea con el menguado abastecimiento de agua potable y con el hacinamientodelaclaseobreraenviviendasinsalubres(Salort,2005).
Dicho“inmensopozonegro”,comoseafirmaenelproyectoquesecitaacontinuación,finalizarátraslaejecucióndelProyecto de obras para el sanea-miento del puerto de Alicante y de su zona marítima redactado en 1905 por elingenierodelpuertoRamónMontagut,cuyofindeobrafuerecibidoporelAyuntamiento de Alicante el 31 de agosto de 1914 (Salort, 2005).
4.2.3. El plan del arquitecto José Guardiola
EneltránsitoentrelossiglosXIXyXX,enplenohigienismo,elarqui-tecto Guardiola Picó plantea en su obra Reformas en Alicante para el siglo XX una serie de ideas para llevar a cabo en la ciudad con objeto de evitar uno de sus problemas: la ausencia de redes de avenamiento. El propio Guardiola señala que “la primera causa de nuestro mal estriba en la falta de condicio-nes en los cauces” y defendía la necesidad de dotar a la ciudad de una red de alcantarillado que evitara la proliferación de pozos negros y actuase, al tiempo, de red de avenamiento para evitar las inundaciones en las zonas bajas de la ciudad. La causa de este problema era, según Guardiola, eviden-te:Alicante,porsuubicaciónpróximaalmarylaspendientestopográficasvinculadasalaseriedecerrosqueenclaustransutramaurbana(SanJulián,Benacantil y Tossal), tiene las mejores condiciones para favorecer el avena-miento de las aguas.
Guardiolahaceuncerterodiagnósticodelproblemadelasinundacionesenlas zonas bajas de la ciudad y resalta la idea de mejorar la serie de colectores
51
Nº 8 / 2018
RESILIENCIA EN EL CICLO URBANO DEL AGUAEL DRENAJE URBANO
urbanosparaqueevacuendeformarápidalasaguaspluvialesyevitenasílosefectos que, como señala el autor, padeció la ciudad en la última decena del pasadosiglo:“laenormeinundaciónquealcanzóalconventodelasCapuchi-nas, a pesar de su situación elevada y que tanto daño causó a la zona baja”.
Imagen 4. Reformas en Alicante para el siglo XX. José Guardiola Picó
Fuente: edición preparada por COEPA (1999).
Para mejorar las condiciones de avenamiento de aguas pluviales, Guardiola propone usar el sistema de fosos de circunvalación señalado, es decir, la red de alcantarillado pero con una mayor capacidad de evacuación, idea que, en buena medida, avanza la solución que se llevó a cabo en la ciudad dentro del PlancontraInundacionesdeAlicante,unsiglomástarde.
Desdeentonceslasobrasdemejoradelareddealcantarilladohansidocons-tantes,sibiennosehanacompañado,comoesnecesarioenlosnúcleosurba-nosdellitoralmediterráneoespañol,deunareddeaguaspluvialesparalelaquepermitalasalidarápidadecaudalesencasodelluviasintensas.Lasriadasdeoctubre de 1966, octubre de 1982 y septiembre de 1997 dieron buena prueba de la carencia entonces de una red de pluviales en la ciudad de Alicante.
52
Nº 8 / 2018
RESILIENCIA EN EL CICLO URBANO DEL AGUAEL DRENAJE URBANO
4.3. Historia reciente y episodios singulares
La riada de octubre 1982 en la ciudad de Alicante, inserta en el mis-mo episodio meteorológico que origina la Pantanada de Tous y las gravísimas inundaciones en la ribera del Júcar, supone un cambio en la consideración ciudadanadeestetipodeeventosdepeligrosidadclimáticaehidrológica.Losgravesefectosqueestatrombadeagua(233mm/24h,elsegundodatomáselevadodeprecipitacióndiariaen laciudad)en laciudaddeAlicantegeneró,porvezprimeraenlahistoriadelaciudad,unmovimientodecon-cienciayprotestahacialasautoridadesresponsablesdelgobiernomunici-pal,exigiendomedidasparaqueestetipodeepisodiosnovolvieraaprodu-cir lascatastróficasconsecuenciasquegeneró.Recordemosqueenesteepisodio se vio muy afectado el centro de la ciudad, debido a la crecida del barranco de Canicia y de los colectores de avenamiento que descienden desdelosmontesTossalyBenacantil;asícomoelbarriodeSanGabriel,porlacrecidaextraordinariaqueexperimentóelbarrancodelasOvejas.
Tras este gran episodio de inundación en la ciudad, los ocurridos tras las lluvias de noviembre de 1984, 1985, septiembre de 1986 y noviembre de 1987 no re-sultaron tan dañinos y se saldaron con anegamientos parciales en diferentes sectores urbanos. En estos casos, el foco de intensidad de lluvia no se loca-lizósobreeltérminomunicipaldeAlicante,loqueexplicaquelasconsecuen-cias de estos episodios de lluvia intensa no alcanzaran, de modo alguno, el nivel de daños registrado en 1982.
Imagen 5. Efectos de la crecida del barranco urbano de San Agustín-San Blas en el barrio de San Blas (Alicante), durante la riada del 20 de octubre de 1982
53
Nº 8 / 2018
RESILIENCIA EN EL CICLO URBANO DEL AGUAEL DRENAJE URBANO
Algomásdañinofueeleventoocurridoacomienzosdeseptiembrede1989.Eneste caso, la intensidad de las lluvias y la localización de un foco pluviométrico sobre la ciudad y término municipal de Alicante volvieron a ocasionar daños en lossectoresurbanosdeVistahermosa,LaAlbuferetaySantaFaz,debidoalacrecida de los barrancos de Orgegia y del Juncaret. Asimismo, se produjo la sa-lida del barranco de Bon Hivern con efectos en el sector de la estación de tren de Ferrocarrils de la Generalitat Valenciana (FGV) tren de la Marina, entrada de Ali-canteporeláreadelPostiguetyavenidadeElche,enlasalidasurdelaciudad.
Tabla 6. Episodios de lluvias intensas con efectos de inundación en la ciudad y término municipal de Alicante en los siglos XX y XXI
Fecha Precipitación (e intensidad horaria) en mm23 de septiembre de 1906 50 mm28 de noviembre de 1916 71 mm20 de agosto de 1929 25,6mm(105,6mm/h)18-19 de septiembre de 1929 51,5mm(294mm/h)25 de septiembre de 1931 34,5 mm1 de noviembre de 1934 60 mm8 de agosto de 1945 60 mm2 de noviembre de 1949 49,5mm(190mm/h)20 de septiembre de 1957 54,4mm(120mm/h)2 de septiembre de 1959 46,5 mm28-29 de septiembre de 1959 56,4 y 61,5 mm, respectivamente15 de octubre de 1962 133,8mm(305mm/h)15 de septiembre de 1963 40,9mm(150mm/h)8 de octubre de 1966 88,5 mm4 de octubre de 1969 65,1 mm19 de octubre de 1972 52,7mm(210mm/h)9 de noviembre de 1978 73,3mm(208mm/h)20 de octubre de 1982 233,1mm(180mm/h)4 de noviembre de 1987 92 mm5 de septiembre de 1989 133,6 mm30 de septiembre de 1997 270,3 mm (154,2 mm)3 de mayo de 1999 35 mm23 de octubre de 2000 55,4 mm21 de septiembre 2007 90,4 mm11 y 12 de octubre 2007 49,7 mm y 42,1 mm28 de septiembre 2009 131 mm18 de noviembre de 2012 55,2 mm13 de marzo de 2017 137,4 mm (48,8 mm)
Fuente: AEMET.
54
Nº 8 / 2018
RESILIENCIA EN EL CICLO URBANO DEL AGUAEL DRENAJE URBANO
Peronoseríahastael30deseptiembrede1997cuandolaciudadvolveráapadecer las consecuencias de un episodio de torrencialidad pluvial, con daños generalizados en toda su trama urbana. En esta ocasión, la ciudad registró el valormáselevadodeprecipitaciónen24h(270mm),datoqueestableceelré-cord de lluvia acumulada en una jornada en Alicante. Cuando aconteció este episodio de lluvia torrencial, se estaba construyendo el aparcamiento de la ave-nidadeAlfonsoXelSabioenunodelosejesdelensanchedelaciudad.Estehechoresultóesencialparaevitardañoseconómicosmayoresenelsectorurba-nocomprendidoentrelarambladeMéndezNúñezylacalleÁngelLozano,hacialapartebajade laciudad (explanadadeEspaña),puestoque laexcavaciónpracticadaparadesarrollar lasdosplantasdesótanodedichoparking actuó como enorme depósito de captación de agua pluvial, evitando que el agua cir-culase por las calles buscando su salida al mar. No obstante, las pérdidas eco-nómicas causadas por anegamiento de sótanos, garajes y locales comerciales fueron muy elevadas. Los accesos a la ciudad por el norte y sur quedaron blo-queadosporlacrecidadelosbarrancosdeBonhivern-LaGotetaydelasOve-jas, respectivamente. Y un sector urbano muy afectado por la tromba de agua registrada fue la playa de San Juan, en especial el espacio comprendido entre la avenida Costablanca y la de Niza, en el paseo marítimo de la playa. Este espacio urbano,edificadosobreunaantiguaáreamarjalencaqueocupabaeltraspaísdelcordóndunardedichoespaciolitoral,registraunavenamientomuyprecariodebidoalaescasapendienteexistenteparafavorecereldrenajedelasaguaspluviales. De manera que todo este conjunto de calles y urbanizaciones quedó variasjornadasbajoelagua,hastaquepudieronpracticarsemedidasdeemer-genciaextraordinariasparaevacuarlasaguasretenidas.Asimismo,fueronim-portantes los daños en la Albufereta debido a la crecida del barranco de Maldo.
Imagen 6. Efectos del desbordamiento del barranco urbano de San Agustín-SanBlasensutramofinalenlaavenidadeÓscarEsplá,estacióndeferrocarril de Benalúa y CN-340, durante la riada de 30 de septiembre de 1997
55
Nº 8 / 2018
RESILIENCIA EN EL CICLO URBANO DEL AGUAEL DRENAJE URBANO
A pesar de la frecuencia de eventos de anegamiento e inundación en la ciudad deAlicanteenlosañosochentay,añosdespués,elocurridoel30deseptiem-bre de 1997, las actuaciones de drenaje urbano desarrolladas en ese intervalo nofueronmuysignificativas.Enefecto,desdelapublicacióndelasreferidasobrasdeGuardiolaPicóhastalapuestaenmarchadelPlanAntiinundacionesdeAlicante,laciudadsolohamerecidoactuacionesparcialesparasolucionarel problema de las inundaciones. Se trata de obras de actuación en barrancos previstas, en su mayor parte, en el Plan General de Ordenación Urbana de 1986opuestasenmarcha,porvíadeurgencia,porlaConselleríadeObrasPúblicas—comolacanalizacióndeltramofinaldelbarrancodelasOvejas—,tras el episodio de noviembre de 1987. Sin ejecución quedaron otras medidas incluidas, como la actuación del Plan de Desarrollo Regional de España 1994-1999 para la Comunidad Valenciana (canalización de los barrancos de Junca-ret y Orgegia y del barranco de Agua Amarga en el Pla de la Vallonga).
Lariadadel30deseptiembrede1997marcóunpuntodeinflexiónfundamen-tal en la preocupación municipal por el problema de inundaciones en la ciu-dad. La pérdida de tres vidas a consecuencia de los raudales de agua que circularonporlatramaurbanamotivólapuestaenmarcha,porvíadeurgen-cia, del Plan Integral Contra Inundaciones (PICI) de Alicante (Plan Antiinunda-ciones de Alicante), diseñado por los técnicos de la Consellería de Obras Pú-blicasydelpropioAyuntamiento.Dichoplan recogía,enbuenamedida, lafilosofía,señaladaporGuardiola,deconstruccióndeunaseriede“fososdecircunvalación que recojan las aguas y las transporten al mar” para evitar que estasinundenelcallejero.Alrespecto,hayfrasesdelescritodeGuardiolaPicóque en este aspecto resultan premonitorias de alguna de las actuaciones con-templadasenestePlanAntirriadas.Así,cuandoserefierealproblemadeave-namiento del barranco de Canicia en la rambla de Méndez Núñez indica la necesidad de construir “un colector de grandes y proporcionadas dimensio-nes,alqueafluiríanlasaguaspluvialesysobrantesdeotraespecieencondi-cionesexcelentesyengrancantidad,porqueabarcaríaunagranzonaexteriordelapoblaciónytodalacomprendidaporsuladoderecho(deleste)”,que,comosehaseñalado,esunadelasobrascontempladasenelcitadoplan.
4.4. El cambio de paradigma: de la visión higienista a la protección frente a las inundaciones y la apuesta por la sostenibilidad ambiental
Las inundaciones originadas por la gota fría de 30 de septiembre de 1997 suponen un cambio radical en la actuación política para la defensa de la ciudadfrenteaestetipodeepisodioscatastróficos.Enefecto,laciudadtomaconcienciadelanecesidaddepasardelparadigmahigienista,estoes,delaconstrucción de colectores de evacuación de aguas residuales, al paradigma
56
Nº 8 / 2018
RESILIENCIA EN EL CICLO URBANO DEL AGUAEL DRENAJE URBANO
delaresilienciaanteestetipodeepisodiosdelluviatorrencial,loquehasu-puestoeldiseñodeunaextensa reddecolectoresdegrancapacidadparasoportar, del mejor modo posible, estas puntas de escorrentía urbana. Un últi-mopasoenlahistoriadeldrenajeurbanodelaciudaddeAlicantehasidolaapuestaporlasostenibilidadenmateriahidráulica,coneldesarrollodeobras“blandas”decaptacióndeaguapluvialqueconsideranademáslautilizaciónposteriordedichasaguasparaposiblesusosurbanostrassudepuración.Sepuedeafirmarque,endosdécadas,laciudaddeAlicantesehasituadoalavanguardiadelpaísenmateriadedrenajeurbano.Yenellohantenidounpapeldestacado las Administraciones públicas (regional y local) y la empresa conce-sionaria de la gestión del ciclo integral del agua de la ciudad (AMAEM), en un ejemplodeloquedebeserunacolaboracióneficazyquetienecomoobjetolamejora de las condiciones de vida de los ciudadanos en su medio urbano.
4.4.1. El Plan Antirriadas de la ciudad de Alicante
Tras el episodio de inundaciones del 30 de septiembre de 1997, la Generalitat Valenciana, a través de la Consellería de Obras Públicas, puso en marchaelPlancontraInundacionesdeAlicante,unprogramadeconstrucciónde infraestructurashidráulicasen laciudady términomunicipaldeAlicanteconlafinalidaddeevitarlosefectosdelasprecipitacionesextraordinariasycrecidasdebarrancosenlasáreasurbanas.ElPlancontraInundacionesdeAlicante incluyó las siguientes actuaciones en el conjunto de la trama urbana de la ciudad, con un presupuesto global de 103 millones de euros. En el desa-rrollo de alguna de estas obras colaboró, asimismo, la Confederación Hidro-gráficadelJúcar,enconcretoenlosencauzamientosdelosbarrancosperifé-ricos, en el término municipal, de Juncaret-Orgegia y de las Ovejas.
Entre las actuaciones de mayor calado, podemos destacar el encauzamiento de varios barrancos adyacentes a la ciudad de Alicante, cuando no directamen-te inmersos en ella (Juncaret, Orgegia, de las Ovejas, Bon Hivern-La Goteta, de CaniciaydeSanBlas).Concaráctergeneral,estasintervencionessediseñaronpara soportar lluvias torrenciales con un periodo de retorno de 200 años.
De forma complementaria, pero no menos importante, el Plan Antirriadas dotó a la ciudad de nuevos colectores de grandes dimensiones (colector Vía Parque, desdoblamientodelPláydelColectorGeneral,playadeSanJuan),asícomodeotras actuaciones adicionales (aliviadero de Canalejas, avenamiento de la entra-dasurdeAlicante).Estasobrasenelsectorpropiamenteurbanoestándiseña-das para aminorar el riesgo de inundaciones con periodos de retorno de 50 años. En su conjunto, el Plan Antirriadas viene a crear, por una parte, las barreras ne-cesarias para desviar y conducir las aguas procedentes del entorno periurbano
57
Nº 8 / 2018
RESILIENCIA EN EL CICLO URBANO DEL AGUAEL DRENAJE URBANO
de forma que no lleguen a afectar a la ciudad, y, por otro, provee a Alicante de los grandes colectores capaces de evacuar las lluvias caídas en el casco urbano.
Figura 17. Plano de las actuaciones del Plan Antirriadas
Todas estas actuaciones se desarrollaron en dos etapas. En la primera, desde 1997hasta2001,lasobrassecentraronenconsolidarlosprincipalespuntosde drenaje de la ciudad y en levantar algunas de las principales avenidas para restituir y dotar de mayor capacidad a los colectores ya obsoletos. En una segunda fase, de 2001 a 2005, se realizaron obras fundamentales para confor-mar parte del anillo de cierre y el encauzamiento de los barrancos.
4.4.2. Actuaciones complementarias del Plan contra Inundaciones de Alicante
Estas obras del Plan contra Inundaciones de la ciudad y término de Alicantesehanvistocompletadasporunconjuntodeactuacionescomple-mentarias desarrolladas por el Ayuntamiento de Alicante y Aguas de Alicante EmpresaMixta,queincluyen:
• ObrasderenovacióndelareddealcantarilladofinanciadasporelAyunta-miento de Alicante y Fondos FEDER entre los años 1999 y 2000.
• Obras de inversión de Aguas Municipalizadas de Alicante E.M. realizadas dentro del marco del Plan Especial de Inversiones 2006-2016.
• Obras de inversión ordinaria anuales de Aguas Municipalizadas de Ali-cante E.M.
58
Nº 8 / 2018
RESILIENCIA EN EL CICLO URBANO DEL AGUAEL DRENAJE URBANO
• Obras de Renovación de redes de alcantarillado de Alicante anuales, rea-lizadas por Aguas Municipalizadas de Alicante.
Como complemento al Plan Antirriadas desarrollado por la Generalitat Valen-ciana, el Ayuntamiento de Alicante proyectó y promovió la ejecución, entre los años 1999 y 2001, de una serie de actuaciones y obras destinadas a me-jorarelsistemadeevacuacióndeaguaspluvialesyaarticularlaconexióndeuna serie de redes secundarias de alcantarillado con los grandes colectores pluviales. Estas obras permitieron solucionar diversos problemas de inunda-ciones locales, aumentado la capacidad de los colectores y dotando a estas zonasconsuficientesrejillasdecaptación.
Figura 18. Plano de las actuaciones realizadas en la zona del casco urbano. Obras complementarias
59
Nº 8 / 2018
RESILIENCIA EN EL CICLO URBANO DEL AGUAEL DRENAJE URBANO
Entotalseinstalaron/renovaronmásde13,6kmdecolectoresporgravedad,condiámetroscomprendidosentre400y2.500mm,incluyendoalgúntramode sección rectangular. El material de las conducciones fue gres, para los colectoreshastadiámetrode600mm,yhormigónarmado,paraelrestodediámetros/dimensiones.
Por otra parte, dentro del Plan Especial de Inversiones de Aguas Municipalizadas deAlicantesehanrealizadonumerosasobrasdemejorahidráulicaconelapoyodelPlanDirectordeAlcantarilladodeAlicante,recogiendolasnecesidadesmásimportantes de mejora del sistema de drenaje urbano de la ciudad de Alicante.
Imagen 7. Sustitución colector general Tramo I. Hinca Ø2500 bajo Gran Vía
RESILIENCIA EN EL CICLO URBANO DEL AGUAEL DRENAJE URBANO
En el marco del citado Plan Especial de Inversiones, desde el año 2006 a la ac-tualidad,AguasMunicipalizadasdeAlicanteE.M.hainvertidoaproximadamente28,9 millones de euros en la mejora y ampliación del sistema de alcantarillado de Alicante. Así, se realizó la construcción del depósito anticontaminación José Manuel Obrero en el barrio de San Gabriel y se ejecutaron y renovaron diver-sos colectores fundamentales para el correcto drenaje de las aguas pluviales.
Adicionalmente y con cargo a sus inversiones ordinarias anuales, Aguas Mu-nicipalizadasdeAlicanteE.M.invierteaproximadamenteunos2millonesdeeuros anuales en la red de alcantarillado para implementar las mejoras que sobre estas redes se van requiriendo y que no estaban contempladas en el Plan Especial de Inversiones anterior. De estas inversiones, podemos destacar la construcción del Parque Inundable de La Marjal o la red de alcantarillado del puerto.Concargoigualmenteaestasinversionestambiénsehanejecutadonumerosas mejoras y ampliaciones en el sistema de telemando de alcantarilla-do con objeto de mejorar en la gestión avanzada del drenaje urbano.
Con el objetivo de mantener y renovar la red de alcantarillado para asegurar el correcto funcionamiento del sistema de alcantarillado de Alicante, AMAEM gestiona adicionalmente todo lo anterior, un fondo de reposición con una cuantíaanualaproximadade1,2millonesdeeuros,quehapermitidorenovarlas redes de varios barrios de Alicante.
Enresumen,alolargodelosúltimos20añossehacambiadototalmenteelestado y la capacidad de las redes de alcantarillado de la ciudad de Alicante. Como muestra, basta comparar, por ejemplo, la longitud de colectores con di-mensionesmayoresoigualesaunmetroqueexistíanenelaño1997(antesde la riada de aquel año), con un total de 42 kilómetros de una longitud de red dealcantarilladode492kilómetros;mientrasqueendiciembrede2017estascifras pasaron a ser de 116 kilómetros y 798 kilómetros, respectivamente. Esta mejorasustancialenmásde74kilómetrosdegrandescolectorescapacesdeconducirlosimportantescaudalesquesegenerandurantelaslluviasmásinten-sas,ydemásde306kilómetrosdered,hanmejoradonotablementelacapaci-daddeAlicanteparaafrontarestetipodesituaciones.Pruebadeellohasidoelexcelentecomportamientodelasredeseinfraestructurasenlaspasadasllu-viasdelmesdemarzode2017(lastercerasmáscopiosasdesde1938),sinapenasregistrarincidentes,ynormalizándoseestospocotiempodespuésdelalluvia.Anteunasituaciónanálogayconlasredesquesedisponíanen1997,lasconsecuenciasylosproblemashubieransidonotablementesuperiores.
Este esfuerzo inversor y de mejora no termina aquí, lógicamente, y en los próximosañossecontinuaránperfeccionándose las redesypreparándose
61
Nº 8 / 2018
RESILIENCIA EN EL CICLO URBANO DEL AGUAEL DRENAJE URBANO
mejor para afrontar los nuevos retos y objetivos que un ciudad del siglo XXI debe imponerse.
Figura 19. Red de drenaje en 1997 y 2017
Nota: en color rojo, las conducciones de diámetro superior a 1.000 mm.
4.4.3. Gestión avanzada del drenaje urbano
Lagestióndelasredesdealcantarilladoy,deformamásamplia,lagestióndeldrenajeurbanodenuestrasciudadeshasufridounaevoluciónmásquenotableenlosúltimosaños;evoluciónquevadelamanodelosavancesen la técnica derivados de la revolución tecnológica ocurrida desde la última década del pasado siglo XX. Este gran salto tecnológico implica, por tanto, un gran cambio en la forma de gestionar las infraestructuras de drenaje urbano de las ciudades, que pasan de ser sistemas pasivos a sistemas activos y de-semboca en la denominada Gestión Avanzada del Drenaje Urbano (GADU).
La Gestión Avanzada del Drenaje Urbano integra no solo los procesos de explotacióndered,sinoqueimplicaeimbricaenlosmismoslosprocesosdeplanificación,diseñoyconstruccióndeinfraestructuras.
Los condicionantes que, de forma inequívoca, implican la evolución de un sistema tradicional de drenaje urbano a un sistema avanzado de gestión del mismo,tienenquever,porunlado,conloscadavezmayoresestándaresdecalidaddevidadelciudadanoenelmediourbano;asícomocon lamayorconcienciación acerca del mantenimiento de estándares de calidad am-biental, tanto del medio urbano como del medio receptor de los posibles aliviosdelsistemadealcantarilladoenmomentosdelluvia,quesecuantificaen una presión cada vez mayor a nivel normativo (donde destaca el último RD 1290/2014) y a nivel social. Por otro lado, el progresivo envejecimiento de las redes de alcantarillado de las ciudades se traduce a su vez en la generación
62
Nº 8 / 2018
RESILIENCIA EN EL CICLO URBANO DEL AGUAEL DRENAJE URBANO
de nuevos problemas que van en contra de la citada tendencia incremental en calidad social y ambiental de las urbes del siglo XXI.
Los retos que plantea esta evolución son muy amplios, ya que requieren resolver muchosdelosproblemasqueennuestrasciudadesseproducen(porcausadelas lluvias por los atascos producidos tanto en las propias redes como en sus in-fraestructurasasociadas—porejemplo,enlasEstacionesdeBombeodeAguasResidualesoEBAR—,porlafaltadecapacidadenalgunoscolectoresderivadade posibles errores de diseño o de su propia falta de mantenimiento o por el citadoenvejecimientoprogresivodelasredes),y,almismotiempo,sermásefi-cientes para proteger el medio ambiente, para reducir los consumos energéticos, parareducirlahuelladecarbonoygarantizarelservicioconlamayorcapacidadposible, minimizando los efectos tanto en el funcionamiento normal de los ser-vicios presentes en nuestras ciudades, como en la vida de los ciudadanos (cor-tesdetráficoporhundimientos,olores,inundaciones,etc.)queenellashabitan.
Lasherramientasexistentesadisposicióndelexplotadordered,quepermitenlagestión avanzada de redes, tienen que ver con diversos aspectos que van desde elconocimientoprecisoyexhaustivodelsistema,suestadoysufuncionamientoy la interacción entre el sistema de drenaje urbano con otros subsistemas rela-cionadoscomoladepuradorayelmedioreceptor,hastalagestiónentiemporealolaresilienciaacondicionantesexternoscambiantescadavezmásrestrictivos.
Para dar respuesta a los requerimientos de conocimiento del sistema y de su comportamientoexistendosherramientasfundamentalesqueconformanlabasede la gestión avanzada de redes. Una de ellas son los Sistemas de Información Geográfica(SIG),quepermitencaracterizargráficamenteloselementosconsti-tutivos de las redes de alcantarillado (pozos, colectores, estaciones de bombeo, etc.) y asociarles sus principales datos relacionales mediante bases de datos. La otrasetratadelossistemasdemodelizaciónhidráulicaquepermitenconocercómo se comportan las nuevas redes, incluso antes de ser construidas, y su relaciónconlasredesexistentes,oquesirvenparaverificarelcomportamientogeneraldelainfraestructuraexistentefrenteadiversoseventosdeprecipitación.
Enestesentido,unhitoimportantequediopiealconocimientodetalladodelascondiciones de contorno de precipitación que actúan sobre la red de alcantarilla-do de la ciudad de Alicante fue el estudio realizado por Aguas de Alicante en el año2003,consistenteenladigitalizacióndelasseriespluviográficasregistradasen el Observatorio Meteorológico de Ciudad Jardín, perteneciente a la Agencia Estatal de Meteorología (AEMET), desde el año 1938. En estas series se valora la precipitación acumulada de forma continua en intervalos de precipitación de hasta10minutosypermitenel estudioyposterior análisisestadísticode los
63
Nº 8 / 2018
RESILIENCIA EN EL CICLO URBANO DEL AGUAEL DRENAJE URBANO
datos en ellas contenidos, otorgando con ellos la posibilidad de generar las cur-vas patrón de lluvias de la ciudad de Alicante. En total, el proceso de digitaliza-cióndeestaslluviasimplicólaextraccióneintroducciónenbasesdedatosdehasta27.624datosdeprecipitaciónregistradosenintervalosde10minutos,al-macenados en papel en los 65 años que comprende la serie temporal.
Figura 20. Pluviograma de la precipitación recogida en el Observatorio Metereológico de Ciudad Jardín el día 20 de octubre de 1982
Fuente: pluviogramas escaneados por AMAEM procedentes del observatorio de Ciudad Jardín.
Figura 21. Pluviograma de la precipitación recogida en el Observatorio Metereológico de Ciudad Jardín el día 30 de septiembre de 1997
Fuente: pluviogramas escaneados por AMAEM procedentes del observatorio de Ciudad Jardín.
Porsuparte,lagestiónentiemporealvendrácondicionadaporlaexistenciadeunsistemadetelemandoytelecontrolqueincluirá,entreotros,lainstrumenta-ción para detectar problemas o alivios del procedimiento o para controlar a distancia el funcionamiento de infraestructuras asociadas a la red, como esta-ciones de bombeo, compuertas, etc.
La gestión avanzada abarca también el campo del mantenimiento de redes, que busca en este caso mantener el sistema de alcantarillado en las mejores
64
Nº 8 / 2018
RESILIENCIA EN EL CICLO URBANO DEL AGUAEL DRENAJE URBANO
condiciones posibles de conservación y funcionamiento, optimizando la gestión de los medios y recursos disponibles y dando prioridad a la prevención. Para lle-varacaboestalabor,esnecesariocontarconherramientasdeapoyoaladeci-sión que permitan conocer la evolución del envejecimiento de las redes y la opti-mizacióndelasrehabilitacionesyrenovacionesdelasmismas,asícomooptimizarlas limpiezas de las redes en función de la propensión de las mismas a ensuciarse.
Figura 22. Curvas IDF propias de la ciudad de Alicante, obtenidas a partir del estudio estadístico basado en datos reales del Observatorio Meteorológico de Ciudad Jardín en el periodo 1938-2003
0,0
50,0
100,0
150,0
200,0
250,0
5 10
15
20
25
30
35
40
45
50
55
60
65
70
75
80
85
90
95
100
105
110
115
120
I (m
m/h
)
Duración (min.)
Curvas IDF estación Ciudad Jardín (Alicante)
T1
T2
T5
T10
T15
T20
T25
T50
T75
Un último punto muy importante dentro de la Gestión Avanzada del Drenaje Urbanoeslaadecuadagestióndelriesgoanteeventosdeprecipitaciónextre-ma, o bien ante posibles disfunciones del sistema, que puedan alterar la cali-dad de los medios receptores o las propias estaciones depuradoras.
Para llevar a cabo la misión de protección frente al riesgo de inundaciones en ámbitosurbanos,esnecesario,porunaparte,disponerde inversionesen in-fraestructura que minimicen los riesgos y, por otra, desarrollar planes integrales degestiónderiesgooadoptarsistemasdepredicciónyalertaanteeventosex-tremos que pongan al límite el funcionamiento de las redes.
Lassolucionesparalagestióndelriesgoanteeventosexcepcionalesconsis-ten en la creación de sistemas tecnológicos de previsión, alerta temprana y/o seguimientodelosmismos.Estasherramientasosistemastecnológicosba-san su funcionamiento en:
• Previsiones meteorológicas.
65
Nº 8 / 2018
RESILIENCIA EN EL CICLO URBANO DEL AGUAEL DRENAJE URBANO
• Control en tiempo real de precipitaciones.• Control de los niveles o caudales en el interior de los colectores.• Alerta por posibles alivios al medio receptor en tiempo seco o en tiempo
de lluvia.• Control de vertidos industriales sobre las redes de alcantarillado.• Modelización del comportamiento de los medios receptores ante eventos
de alivio de los sistemas de alcantarillado.
En la actualidad, Aguas de Alicante, con el objetivo de dar solución a las pro-blemáticasdegestióndelriesgomedianteelempleodesistemastecnológi-cos, dispone de una amplia sensorización presente en la red de alcantarillado de la ciudad, que permite un control en tiempo real de los caudales circulan-tesporlamismaydelascondicionesmeteorológicasimperantesenelámbi-to urbano y sus alrededores. Así, se encuentran distribuidos en el término municipal un total de 24 pluviómetros (12 de ellos distribuidos en la propia ciudad)y102limnímetros(medidoresdeniveldelfluido),ubicadosenelinte-rior de la red de alcantarillado, estaciones de bombeo, grandes colectores, cauces de barrancos y en el interior tanto de las infraestructuras ligadas al depósito anti-DSU (anti-Descargas del Sistema Unitario al medio receptor) de San Gabriel como al Parque Inundable de la playa de San Juan.
Figura 23. Distribución espacial de pluviómetros (en color verde) y limnímetros (en color rojo) en la ciudad de Alicante e isla de Tabarca
66
Nº 8 / 2018
RESILIENCIA EN EL CICLO URBANO DEL AGUAEL DRENAJE URBANO
En resumen, para poder abordar mediante una gestión moderna, sostenible, eficaz y eficientequeaproveche todos los recursosque la tecnología y elconocimientonosproporcionan,lagestiónavanzadadelsigloXXIsehadeapoyarenlassiguientesherramientasosistemastecnológicos,siemprebajoel enfoque del desarrollo sostenible:
• Sistemasdeinformacióngeográficaybasesdedatos(actualizadosper-manentemente; por ejemplo, inspecciones de cámaras de televisión,limpiezas de red, etc.).
• Conocimiento y comprensión de las condiciones de contorno (precipi-taciones,infiltraciones,etc.).
• Modelizaciónhidráulica.
• Modelización del comportamiento de los medios receptores ante even-tos de alivio de los sistemas de alcantarillado.
• Planificaciónderiesgosyplanesdegestióndeemergencias(protocolosde alerta y actuación, coordinación, simulacros, etc.).
• Instrumentación para detectar problemas o alivios del sistema (en tiem-po real).
• Herramientas de apoyo a la decisión para estimar la evolución del en-vejecimientodelasredesylaoptimizacióndelasrehabilitacionesyre-novaciones de redes.
• Herramientas para la optimización del mantenimiento y limpieza de las redes en función de su “ensuciabilidad”, garantizando que disponen de todasucapacidadhidráulica.
• Telemando y telecontrol de infraestructuras asociadas a la red (por ejem-plo, estaciones de bombeo, compuertas, infraestructuras singulares de re-tención de aguas como depósitos anticontaminación, antiinundación, etc.).
Todasestasherramientasseguiránevolucionadoyadaptándosealosnuevosretos que día a día van surgiendo. Debemos favorecer la resiliencia de nues-tras ciudades, ligada al comportamiento de las infraestructuras de drenaje, implicando a toda la sociedad en este reto. Desde este punto de vista todos podemos contribuir al mismo, evitando verter en los inodoros elementos que supongan un aumento del riesgo para el funcionamiento de las redes, como
67
Nº 8 / 2018
RESILIENCIA EN EL CICLO URBANO DEL AGUAEL DRENAJE URBANO
sonlasdenominadas“toallitas”uotrosdesechosenlavíapúblicaquepue-dan limitar la capacidad de captación de las rejillas, etc.
4.4.4. Actuaciones singulares: el depósito anticontaminación José Manuel Obrero y el parque inundable La Marjal
El uso de aguas pluviales, retenidas en depósitos o en parques inun-dables,constituyeunaalternativadeextraordinariointerésparapaliarlaes-caseznaturalderecursoshídricoseincrementarlaresilienciadeestosterri-torios ante los posibles efectos que tendría el cambio climático en áreasmediterráneas.Aestefactor,habríaqueincorporarotrasventajas,entrelasquecabríahacermenciónasucarácterderecursorenovable,suobtencióna escala local (lo que elimina las tensiones entre territorios por su uso), su acceso(almenosapriori,gratuito)yunadisponibilidadrelativamentefácil,siempre que se adopten a escala doméstica y vinculados a estrategias de cosechadeaguaydrenajeurbanosostenible.
El uso potencial que ofrecen las aguas pluviales retenidas con este tipo de in-fraestructuras “blandas” que no suponen una transformación radical de las tra-masurbanassepresenta,además,comounaformainteligentedeadaptaciónalcambioclimáticoysusposiblesefectoseneláreamediterránea:unamayorirregularidad de las precipitaciones y mayor intensidad (mayor escorrentía) yunamayorduracióndelosperiodossecos(escasezderecursoshídricos).
AguasdeAlicantehadesarrolladoenlaciudaddeAlicantedosactuacionesdeestascaracterísticasquesehanconvertidoenejemplosdebuenasprác-ticas en la gestión de la escorrentía urbana y el potencial uso posterior del agua pluvial. Se trata del depósito José Manuel Obrero en el barrio de San Gabriel y del parque inundable La Marjal en el sector urbano de la playa de San Juan. De esta manera, el agua de escorrentía procedente de lluvias inten-sas que caen sobre la ciudad no solo permite aumentar la oferta del recurso, sinotambiénreducirelriesgode inundación.Yaellosesumaelbeneficioambiental que supone evitar que el lavado de calles, con sus restos de con-taminación, que llevan a cabo las aguas de lluvia pueda incrementar coyun-turalmente la contaminación del agua y de las playas al depositarse en ellas sin depuración. Esto cobra gran importancia si se tiene en cuenta la relevan-ciaeconómicadelturismodesolyplayaquesedesarrollaenmuchasciuda-desdellitoralmediterráneoespañol,entreellas,laciudaddeAlicante.
Depósito anticontaminación José Manuel ObreroComo en la mayoría de las ciudades de nuestro entorno, las redes de alcan-tarillado tienen un funcionamiento predominantemente unitario, es decir, en el
68
Nº 8 / 2018
RESILIENCIA EN EL CICLO URBANO DEL AGUAEL DRENAJE URBANO
quelasaguasdelluviahandeevacuarseatravésdelosmismoscolectorespor los que circula el agua residual cada día. Esto presenta múltiples incon-venientes, entre otros, la imposibilidad de separar, una vez unidos, los dos tipos de aguas: las de lluvia y las residuales.
En el caso de Alicante, donde el porcentaje de redes unitarias en la actuali-dadesdel86%,sehapresentadohistóricamenteunproblemaenlazonade Cros-San Gabriel, por ser donde se concentran las aguas, tanto de lluvia comoresiduales,quesegeneranenunacuencadeunas1.250has.Estorepresentaaproximadamenteel50%delazonaurbanadelaciudadloque,unidoalhechodecontarconprecipitacionesintensasypendientesmediaso elevadas en esta zona de la ciudad, provoca que se generen caudales muyelevadosenelfinaldelacuencaqueexcedenlacapacidaddelases-taciones de bombeo y del propio tratamiento de la Depuradora de Rincón de León, no por estar estas infradimensionadas, sino por la imposibilidad antesexpresadadepodertratarenunaguaunitariatalesvaloresdecaudaly volumen.
En tanto las redes no sean completamente separativas, es decir, que las aguas pluviales circulen por unos colectores y las residuales por otros, la si-tuaciónenlamayoríadenuestrasciudadesseguirápresentandoestetipodeproblemas. Sin embargo, podemos mitigar estos problemas mediante la construcción de infraestructuras de retención, capaces de almacenar tempo-ralmente grandes volúmenes de agua y, al mismo tiempo, retener la mayor parte de los arrastres que se generan en el interior de los colectores durante unalluvia,deahíladenominaciónde“anticontaminación”o“anti-DSU”(an-ti-Descargas del Sistema Unitario), que se les atribuye a depósitos como el construido en el barrio de Cros-San Gabriel, por parte de Aguas de Alicante, entre el verano de 2009 y abril de 2011.
El depósito anticontaminación de Cros-San Gabriel, también denominado DepósitoIngenieroJoséManuelObreroenhomenajeaunadelaspersonasqueconmayorahíncotrabajóparaqueestedepósitoseahoyendíaunarealidad, tiene una capacidad de almacenamiento de 60.000 m3 (20 piscinas olímpicas),estásituadobajoelcampodefútboldelpolideportivoJuanAn-tonioSamaranchycontribuyenotablementedesdeelotoñode2011aredu-cir los alivios de la red de alcantarillado al barranco de Las Ovejas. En los últimoscincoaños,sehancapturadomásde2.000.000m3 de agua en este depósito,aguaquenosolosehaevitadoaliviaralbarranco,sinoque,ade-más,sehapodidoenviarpocoapocoa ladepuradoradespuésdecadalluvia, permitiendo su reutilización para el riego agrícola o de zonas verdes de la ciudad.
69
Nº 8 / 2018
RESILIENCIA EN EL CICLO URBANO DEL AGUAEL DRENAJE URBANO
Figura 24. Esquema del depósito anticontaminación José Manuel Obrero
Duplicado delcolector de acceso
al puerto
Impulsiones de vaciado
Colectores de entrada(por gravedad)
Impulsionesde entrada
La inversión se realizó dentro del marco del Plan Especial de Inversiones deAguasdeAlicanteconunadotación totaldemásde55millonesdeeuros, de los cuales cerca de 15 fueron destinados a la construcción de este singulardepósito,queyaformapartedelpatrimoniosinmuchasvecesservistodesdeelexterioryquecontinuarádurantemuchosañosaportandobeneficiosmedioambientalesanuestraciudad.
Este tipo de infraestructuras cuenta con innumerables instalaciones y equipos de alta tecnología, dado que todo se controla remotamente, ypermaneceactivolas24horasdeldía,todoslosdíasdelaño,prepara-do siempre para entrar en funcionamiento cuando se requiere. Entre los múltiples elementos con los que cuenta podríamos destacar 20 bombas hidráulicasparaimpulsiónoextraccióndelaguaacumuladaconcercade500 kWdepotencia instalada, turbinasde extracción y renovacióndelaire con capacidad para 36.000 m3/h, 9 sensoresde nivel de agua, 16detectores de gases, compuertas, depósitos de agua regenerada para limpieza, un sistema antiincendios, salas de cuadros de maniobra y tele-mando, una sala de transformador de 800 kVA, un grupo electrógeno de 550 kVA, etc.
70
Nº 8 / 2018
RESILIENCIA EN EL CICLO URBANO DEL AGUAEL DRENAJE URBANO
Imagen 9. Depósito anticontaminación José Manuel Obrero en funcionamiento tras un episodio de lluvias intensas sobre la ciudad de Alicante
Parque inundable de La MarjalEnotrasocasioneslosproblemasaresolvernovienendadosporlaexistenciade redes unitarias, a veces incluso con redes separativas pluviales podemos encontrarnos situaciones donde se pueden producir desbordamientos de los colectores o inundaciones locales, este es el caso de la zona conocida como Hoyo1,enlasproximidadesdelcampodegolfdeAlicante,enlaplayadeSanJuan de Alicante. En esta zona, antes de la construcción del parque de La Mar-jal, por la falta de capacidad de todos los colectores pluviales de la zona (que se llenabanporcompletodurantemuchasdelaslluvias)yporsuubicación(enunazona relativamente deprimida en cuanto a su posibilidad de evacuar las aguas deescorrentíasuperficialporlosviales),segenerabaninundacioneslocales.
La construcción del parque permitió conectar a través de un colector de gran capacidad el punto bajo relativo de la zona del Hoyo 1 con el propio parque, de tal manera que, antes de inundarse esta zona, las aguas pasarían a inundar el parquehastaunmáximode45.000m3, evitando con ello el daño a la zona de las urbanizaciones.
Ademásdeestafunciónhidráulicaparaevitarlasinundaciones,elparquetieneuna importante función social y medioambiental, dado que constituye un lugar de esparcimiento para todos los ciudadanos que acuden al parque y, al mismo tiempo, constituye una nueva zona verde con gran cantidad de especies vege-talesyfauna,quehacedeestelugarunparajeverdaderamentesingularymuyagradable de visitar.
71
Nº 8 / 2018
RESILIENCIA EN EL CICLO URBANO DEL AGUAEL DRENAJE URBANO
Laejecucióndeestaobraserealizódurantelosaños2014y2015,fechaenla que quedó inaugurado el parque. El coste de toda la obra, incluida la eje-cución de los nuevos colectores y las rejillas que se dispusieron para evitar la inundación en la zona del Hoyo 1, supuso una inversión total por parte de Aguas de Alicante de unos 3,5 millones de euros.
EsteparquedeLaMarjalhaconstituidounnuevoreferentealahoraderesol-verproblemashidráulicosporinundaciónaltiempoquesegeneransolucio-nesurbanassosteniblesy,porello,hasidoobjetodemúltiplesreconocimien-tos, como el otorgado a la obra con “Mejor integración en el entorno y respecto al medio ambiente” en la provincia de Alicante en 2015, concedido por la Federación de Obras Públicas de la provincia de Alicante (FOPA) en su XIIIedición;igualmenteharecibidoelPremioAlhambraensuediciónXXIII,dela Asociación Española de Parques y Jardines Públicos (AEPJP), y actual-menteoptaalPremioHábitatdeBuenasPrácticas,queentregalaONUcadados años.
Figura 25. Esquema del parque inundable La Marjal (playa de San Juan, Alicante)ensuestadohabitualyencasoderetencióndelluvias
Imagen 10. Vista general del parque inundable La Marjal (playa de San Juan, Alicante)
72
Nº 8 / 2018
RESILIENCIA EN EL CICLO URBANO DEL AGUAEL DRENAJE URBANO
Alo largode losdosañosque llevaabiertoesteparqueyasehanpodidorecogercuatrolluviasquehanprovocadolaentradadelaguaalmismo,evi-tandoconellolainundacióndelazonadelHoyo1.Laúltimaymásrecientefuelalluviadelpasadodía13demarzode2017,fechaenlaqueentraronmásde 15.000 m3 de agua al parque, con una lluvia de 92 l/m2 en la zona de la playa de San Juan.
Desdeelpuntodevistamedioambientalesteparque,además,segestionaconelmáximorespetohaciatodaslasplantasyanimalesquevivenenél;demodoque,paraelmantenimientodelaláminapermanentedeaguare-generada, se utilizan tratamientos totalmente sostenibles y naturales. Tam-biénsehaninstaladonidosparamurciélagos,fochas,aviones,vencejosyotro tipo de pequeñas aves, que permiten el control de insectos, entre otros. Desdesuinauguraciónhananidadomultituddeestasespecies,ademásdepatos, e incluso algúnmartínpescador; todoello hacequeeste espaciopioneroensudiseñoyfunciónseaunlugaraimitarenmuchasdenuestrasciudades.
Imagen 11. Efectos de llenado con 15.000 m3 del parque inundable La Marjal con ocasión del episodio de lluvias intensas del 13 de marzo de 2017
4.4.5. Diagnóstico del riesgo de inundaciones en la ciudad de Alicante: el episodio de lluvias muy intensas del 13 de marzo de 2017
Finalizadas en 2005 la serie de obras incluidas en el Plan Antiinunda-ciones en la ciudad y término de Alicante (construcción de los grandes co-lectores), así como la serie de actuaciones complementarias desarrolladas conposterioridad,elriesgodeinundacionessehaatenuadoconsiderable-mente. Tan solo una precipitación in situ superior a 400 mm en un intervalo de2horasfocalizadasobreelpropiotérminomunicipalrebasaríalacapaci-dad de evacuación de la red de pluviales instalada. Se trata de un volumen de precipitación no registrada en la ciudad de Alicante desde que se dispone
73
Nº 8 / 2018
RESILIENCIA EN EL CICLO URBANO DEL AGUAEL DRENAJE URBANO
de registro meteorológico (1855), si bien no improbable en el espacio geo-gráficodelafachadamediterráneaespañola,dondenosedesconocenre-gistrosdeestacuantíanisuperioresenintervalosdemenosde6horas.
Desdelasinundacionesdeseptiembrede1997,laciudaddeAlicantenoha-bía registrado un episodio de cuantía y concentración de lluvias tan importan-te como para poder probar el conjunto de obras de drenaje urbano desarro-lladas en las últimas dos décadas. Pero en marzo de 2017, el día 13, se desarrolló un episodio de lluvias torrenciales sobre la ciudad y término de Alicante. Se trató de un evento singular, puesto que no es frecuente que en un mes de invierno se desarrollen lluvias tan cuantiosas. No obstante, debe explicarsesugénesisenelcontextodeunotoño-invierno2016-2017algoanómaloenloatmosféricoenlafachadamediterráneaespañolay,especial-mente, en su mitad meridional, con la ocurrencia de eventos de lluvia torren-cialconunafrecuenciapococomún(Málaga,Murcia,Alicante,surdeValencia).Fuelaconsecuenciadelreajusteatmosféricodebidoalafinalizacióndelin-tensoeventodeElNiñoenelPacíficoyel iniciodeunafasepositivadelaoscilaciónnoratlánticaque favorece lagénesis reiteradadesituacionesdeelevada inestabilidad en esta parte de España.
Endefinitiva,elepisodiodelluviastorrencialesdel13demarzode2017,sinalcanzar la cuantía de las lluvias registradas en octubre de 1982 y septiembre de1997,supusoeltercerdatodelluviaen24horasmáselevadoregistradoenlaciudaddeAlicante,conunvalordeintensidadhorariamuydestacado.Demaneraquesudesarrollohaservidopara realizarundiagnósticode laefectividad de las actuaciones de drenaje realizadas en la ciudad desde 1997.
Ese día tuvo lugar, en efecto, un episodio de lluvias torrenciales en la ciudad de Alicante y municipios de la comarca de L´Alacantí (San Vicente del Ras-peig,SanJuan,MutxamelyCampello),debidoalagénesisdeunasituaciónatmosférica de elevada inestabilidad motivada por la instalación de una bolsa deairefríoenlascapasmediasyaltasdelaatmósfera(configuraciónatmos-férica de gota fría). El resultado fue el desarrollo de un episodio pluviométrico detorrencialidadconregistrosquehanmarcadounrécorddecuantíaen24h,segúnelobservatoriooficialdeCiudadJardín,yvaloresdeintensidadhorariadedichalluviaporencimade40mm/h.Lasconsecuenciasfueronlasalidadebarrancos y ramblizos que se ubican en la comarca de L´Alacantí y la forma-cióndeáreasdeencharcamientoenlaszonasbajasdeláreaafectadaporlatormenta.
El propio observatorio de Alicante (Ciudad Jardín) anotó un volumen de 136,6 l/m2 a lo largo de toda la jornada. No obstante, el momento de mayor
74
Nº 8 / 2018
RESILIENCIA EN EL CICLO URBANO DEL AGUAEL DRENAJE URBANO
intensidaddelluviaocurrióentrelas18y21horas(horacivil)dedichajorna-da, cuando se acumuló un 70% de la lluvia total registrada en ese día.
Asimismo, entre las 18 y 20 horas, la precipitación alcanzógran intensidadhoraria,comodemuestraeldatooficialanotadoenelobservatoriodeAlicante(Ciudad Jardín) de 48,8 l/m2unahora,eneseintervalo;yasimismo,eldatodeacumulación es de 23 litros en tan solo 10 minutos.
Demaneraqueestamosanteuneventodeelevadaintensidadhoraria,quesupuso la acumulación de una cantidad importante de agua en poco interva-lo de tiempo.
Tabla 7. Valores de lluvia intensa registrados en el observatorio de Alicante (Ciudad Jardín), durante el episodio del 13 de marzo de 2017
Día
T. máx. (ºC)
T. mín. (ºC)
T. media
(ºC)
Racha (km/h)
V. máx. (km/h)
Pr. 00-24 h (mm)
Pr. 00-24 h (mm)
Pr. 00-06 h (mm)
Pr. 12-18 h (mm)
Pr. 18-24 h (mm)
(Hora) (Hora) (Hora) (Hora)
15 mar 2017 18.4 (14:10)
8.0 (06:10) 13.2 37
(10:40)22
(14:00) 0.0 0.0 0.0 0.0 0.0
14 mar 2017 0.2 0.0 0.0
13 mar 2017 13.6 (23:20)
8.0 (07:40) 10.8 61
(17:20)28
(17:30) 137.4 21.4 8.4 24.6 83.0
12 mar 2017 22.0 (14:00)
12.2 (03:10) 17.1 23
(22:10)12
(15:50) 4.8 0.0 0.0 0.0 4.8
11 mar 2017 22.3 (14:50)
9.8 (06:50) 16.0 17
(14:20)10
(15:00) 0.0 0.0 0.0 0.0 0.0
10 mar 2017 32.5 (12:50)
14.0 (23:59) 23.3 33
(13:40)20
(13:40) 0.0 0.0 0.0 0.0 0.0
9 mar 2017 27.4 (14:30)
10.5 (04:30) 18.9 19
(12:40)1313
(12:40) 0.0 0.0 0.0 0.0 0.0
Fuente: AEMET. Observatorio de Ciudad Jardín (Alicante).
Enotraslocalidadesdelacomarca,losvaloresdelluviaen24horasanotadosporestacionespertenecientesaaficionados(AVAMET8, Meteoclimatic9) o en-tidadespúblicasoficiales(peronointegradosenlareddeobservatoriosdeAEMET), fueron asimismo muy elevados:
• San Vicente del Raspeig: 171 l/m2.• Laboratorio de Climatología (Universidad de Alicante): 200 l/m2.
8 Disponible en el enlace: www.avamet.org9 Disponible en el enlace: www.meteoclimatic.net
75
Nº 8 / 2018
RESILIENCIA EN EL CICLO URBANO DEL AGUAEL DRENAJE URBANO
• Agost: 139,3 l/m2.• Alicante (cabo de las Huertas): 134 l/m2.• Alicante (playa de San Juan): 138 l/m2.• San Joan d´Alacant: 127 l/m2.
Figura 26. Gráficodeintensidadhorariadelalluviaacumuladaenelobservatorio de Alicante (Ciudad Jardín) durante el episodio de lluvias intensas del 13 de marzo de 2017
0 mm
25 mm
50 mm
75 mm
100 mm
125 mm
150 mm
09 mar.2017
10 mar.2017
11 mar.2017
12 mar.2017
13 mar.2017
14 mar.2017
15 mar.2017
Alicante/Alacant. Precipitaciones (mm)
Precipitación 00-06 h (mm) Precipitación 06-12 h (mm) Precipitación 12-18 h (mm) Precipitación 18-24 h (mm)
Fuente: AEMET. Observatorio de Ciudad Jardín (Alicante).
Eláreademayorconcentracióndeprecipitacioneseintensidadhorariadelasmismas, en la tarde del 13 de marzo, fue el eje comprendido entre la ciudad de San Vicente del Raspeig-San Joan d´Alacant-playa de San Juan. En esta franjade territorio,especialmenteeneláreaentreSanJoand´Alacanty laplayadeSanJuan,esdondeseregistraronlosdañosmásimportantesporanegamiento de viviendas, edificios y locales allí situados. EspecialmenteproblemáticasporlaacumulacióndeaguaregistradaresultaronlazonaentreelhospitaldeSanJuanyeláreaurbanadelHoyo1delaplayadeSanJuan,así como la franja costera de la playa de San Juan, al norte de la avenida de la Costa Blanca.
Como consecuencia de las citadas precipitaciones, el depósito anticonta-minaciónubicadoenelbarriodeSanGabrielalcanzósuvalormáximodellenado,loquesignificaquedichainfraestructuraalmacenólos60.000m3 de aguas unitarias para los que fue diseñado, evitando con ello el alivio de esta cantidad al medio receptor.
76
Nº 8 / 2018
RESILIENCIA EN EL CICLO URBANO DEL AGUAEL DRENAJE URBANO
Por otra parte, el parque inundable La Marjal, ubicado en la playa de San Juan,entróenfuncionamientoapartirdelas18:00horasdeldía13demarzode2017,finalizandosuprocesodellenadoalas22:30horas.Entotal,elvo-lumen de aguas pluviales almacenado en esta infraestructura alcanzó los 15.500 m3,aproximadamenteun35%desucapacidaddealmacenamientototal,loqueconstituyeelmáximovolumenalmacenadodesdesupuestaenservicio en el año 2015.
Adicionalmente, los colectores antirriadas de la ciudad funcionaron de mane-ra adecuada, evacuando los caudales pluviales generados en el centro de la ciudadyenlaplayadeSanJuanhacialosprincipalesbarrancosquelacir-cundan y al mar. A su vez, las diferentes estaciones de bombeo de aguas unitarias y pluviales distribuidas en la ciudad funcionaron de manera conti-nua,sinparos,llegandoasusnivelesmáximosdealmacenamientoyfuncio-namiento.
Es de destacar que en este episodio de lluvia intensa del 13 de marzo de 2017 no se registraron problemas ni avisos relacionados con el funcionamiento de lainfraestructurahidráulicaexistenteenzonasconsideradasconflictivas.
Ensíntesis,elepisodiodelluviasintensasdemarzode2017hapuestodemanifiestolautilidaddeestasobras,quehanevitadodañosimportantesenlaciudadysutérminomunicipal.Noobstante,sehamanifestadoquelaeva-cuación de aguas pluviales en la entrada de la avenida de Denia (antiguo trazado del barranco de Bon Hivern) requiere de aliviaderos de mayor capa-cidad bajo el puente del TRAM, junto al centro comercial Plaza Mar 2. Igual-mente,esteepisodiodelluviasconfirmóqueelsectorurbanoentornoalaavenida de Miriam Blasco en la Condomina precisa de actuaciones que miti-guenelniveldeencharcamientodelaguaquesealcanzaconlluviassuperio-resa30mm/h.Igualmente,elanegamientoquesedesarrollódurantevariosdíastraselepisodiodelluviaseneláreadelaplayadeSanJuan,compren-dida entre la plaza de la Coruña, la glorieta de la Democracia y la avenida de Niza,obligaráadesarrollarnuevasactuacionesdeevacuacióndepluvialesenunáreacomplejaporsuconfiguracióntopográfica(antiguaMarjal)yproximi-dad al nivel del mar.
4.5. Retos futuros del drenaje urbano. Los Sistemas Urbanos de Drenaje Sostenible (SUDS) como medidas de adaptación al cambio climático
Elcambioclimáticoesunodelosmayoresretosalosqueeldrenajeurbanosedebeenfrentarenlospróximosaños.Enteoría,esdebidotantoacausas naturales como antropogénicas, ya que la Convención Marco de las
77
Nº 8 / 2018
RESILIENCIA EN EL CICLO URBANO DEL AGUAEL DRENAJE URBANO
NacionesUnidassobreelCambioClimáticousaeltérmino“cambioclimáti-co”soloparareferirsealcambioporcausashumanas,talescomolaindus-trialización o la urbanización (que conllevan un mayor uso de combustibles fósilesparalaclimatizacióndoméstica,elaumentodesuperficiesimpermea-bles, la disminución de las masas de agua naturales y la pérdida de la vege-tación, etc.).
A pesar de necesitar cambiar urgentemente nuestras fuentes de energía por fuentesmás limpiasy renovablesparaabordar lascausasdeestecambioclimático,tambiénnosdebemosprepararparalosimpactosclimáticospre-sentesyfuturos.Lacapacidaddelasciudadesparaprosperarfrentealrápidocrecimientoyaunclimacambiantedependerádelaformaenqueseplanifi-can,desarrollanygestionanestasciudadesenlaspróximasdécadas.
Imagen 12. Monasterio y plaza de la Santa Faz (Alicante), situado junto al cauce del barranco del Juncaret. Episodio de lluvias intensas del 13 de marzo de 2017
RESILIENCIA EN EL CICLO URBANO DEL AGUAEL DRENAJE URBANO
dedrenajeconvencionalohistórica,enlamayoríadeciudadesyamuyenvejeci-da, que recoge y transporta conjuntamente aguas residuales y pluviales (sistema unitario),puede resultar insuficientee ineficientea lahoradegestionarestoscaudales para los que no fueron diseñadas, llegando a episodios de inundacio-nes (con impactos sobre personas y bienes) y descargas del sistema unitario (DSUS) con impactos sobre los medios receptores (impacto ambiental, social yeconómico);que,encasodeAlicante,incluyesus15kmdeplaya.
Parece, por tanto, imprescindible predecir la magnitud de los impactos del cambioclimáticosobreelciclohidrológicoparadiseñarunossistemasdedrenaje adaptados al futuro. La adaptación de estos sistemas no puede basarse únicamente en la construcción de infraestructura convencional (ampliación de colectores, construcción de depósitos de retención, etc.), ya que puede resultar inasumible para la mayoría de ciudades (debido a su elevadocoste)nosiendolasoluciónmássostenible.Enestesentido,tec-nologías alternativas como las soluciones basadas en la naturaleza o Siste-mas de Drenaje Urbano Sostenible (SDUS) se deberían también tener en cuenta.
Las soluciones basadas en la naturaleza (nature-based solutions, en inglés) generalmente conllevan una gestión y un uso sostenible de la naturaleza paraabordardesafíossocialescomoelcambioclimático,lagestióndelagua,la seguridad alimentaria y la gestión del riesgo de desastres. Por ejemplo, la protección de los manglares en las zonas costeras puede limitar los riesgos de erosión asociados a condiciones meteorológicas extremas, al mismotiempo que proporciona viveros para la producción de pescado para alimen-tar a la población local y capturar CO2. De manera similar, los tejados o muros verdes pueden utilizarse, en la edificación, para enfriar las zonas urbanasdurante el verano, captar agua de lluvia, reducir la contaminación y aumentar el bienestar de la población, al tiempo que mejoran la biodiversidad y conec-tanlaciudadconunecosistemamásamplio.
Paraintentarminimizarlosefectosnegativosdelcambioclimáticosobreelmedio natural y sobre la salud y el bienestar de las personas, las estrategias de ordenación del territorio y los planes urbanísticos deben prestar una atenciónespecialalainformaciónclimáticayaladistribucióndelterritorioentre los distintos usos y actividades, integrando entre sus objetivos impedir y prevenir la degradación de los recursos naturales, procurando un mejor aprovechamientodelosmismosylaadaptacióndelasciudadesalascarac-terísticasbioclimáticasdelazona.Enestesentido,elPlanNacionaldeAdap-taciónalCambioClimáticoproponevariasactuaciones,entrelasqueencon-tramos: el desarrollo y la promoción de la bioconstrucción, especialmente en
79
Nº 8 / 2018
RESILIENCIA EN EL CICLO URBANO DEL AGUAEL DRENAJE URBANO
todos losedificiospúblicos,o laevaluaciónde los requerimientosde lasespecies y variedades vegetales de parques y jardines bajo distintos esce-nariosdecambioclimático,yaquelosespaciosverdespuedenllegarasercadavezmásimportantesparaaliviarlosefectosdelaumentodelastem-peraturas.
Dentro de estas medidas, el Drenaje Urbano Sostenible es una alternativa al enfoqueconvencionalquevamuchomásalládesimplementemitigar lasinundaciones y gestionar la calidad del agua de escorrentía urbana. Los SUDSpuedendefinirsecomoelementos integrantesde la infraestructuraurbano-hidráulico-paisajística cuyamisiónes compensar el efectoque laurbanización e impermeabilización de las ciudades ejercen sobre la canti-dad y contaminación de la escorrentía de agua de lluvia generada, median-telacaptación,retenciónoinfiltraciónenelterreno,deformaqueestanosufraningún deterioro e incluso permita la eliminación, de forma natural, de al menospartedelacargacontaminantequehayapodidoadquirirdurantelos procesos de escorrentía urbana previa. Todo ello tratando de reprodu-cir,lomásfielmenteposible,elciclohidrológiconaturalprevioalaurbani-zaciónoactuacióndelhombre.ExistendiferentestipologíasdeSUDSdelas cuales podemos poner como ejemplo: los tejados verdes o cubiertas eco-lógicas,lospavimentospermeables,lasfranjasodrenesfiltrantes,lascune-tasverdes,losdepósitosdedetención,losestanquesderetención,loshume-dales, etc.
Imagen 13. Ejemplos de SUDS
Nota: a la izquierda parque inundable de la Marjal en Alicante, en el centro ejemplo de tejado verde en el Ayuntamiento de Chicago y derecha cuneta verde. Fuente: AIRCUD (Aqualogy International Research Center for Urban Drainage)
Adoptar este enfoque innovador, alternativo y sostenible de la gestión del aguadelluviaenentornosurbanosreportaunaseriedebeneficiosañadidosentre los que cabe citar los siguientes:
• Reducción del riesgo de inundación aguas abajo, derivado de la disminu-ción de volúmenes y caudales punta de escorrentía.
80
Nº 8 / 2018
RESILIENCIA EN EL CICLO URBANO DEL AGUAEL DRENAJE URBANO
• Menor interferencia en los regímenes naturales de las masas de aguas receptoras, tanto en calidad como en cantidad.
• Mejor funcionamiento de las estaciones depuradoras, al reducirse el in-fluenteenlasmismasyteneresteunpatróndecontaminantesmáscons-tante.
• Reducción del efecto de isla de calor en las ciudades, contrarrestando el aumentodetemperaturaprovocadoporsuperficiesasfaltadasyhormi-gonadas.Sehacomprobadoqueparquesdesolo1-2hectáreaspuedentener2ºCmenosquezonasdeedificiosadyacentes.
• Disminución del consumo de energía, tanto en refrigeración y calefacción de instalaciones como por la disminución del volumen de agua a tratar en los procesos de depuración tradicionales.
• Incremento del valor añadido de las urbanizaciones, debido a la ca-lidad paisajística del entorno y a la dotación de zonas recreacionales adicionaleseincrementodelacalidaddevidadeloshabitantesdelasciudades.
Porejemplo,elusodehumedalesartificialesydeestanques,ademásdepo-der tener un uso recreativo, ayuda a impedir la aparición de altas temperatu-ras,yaquelasmasasdeaguaactúancomoamortiguadortérmico;laszonasdebiorretenciónalmacenanaguadeformasuperficialqueluegoseevapora,realizandoasíunafuncióntambiéndecontroltérmico;olascubiertasverdes,que no solo contribuyen al llamado “efecto oasis” de las ciudades por dispo-ner de vegetación y favorecer el desarrollo de la biodiversidad, sino que ade-mássuponenunmediodeahorroenclimatizaciónde losedificios.Actúancomo medio aislante reduciendo el gasto en calefacción y aire acondiciona-do, evitando el consumo energético que conlleva el calentamiento de las ciu-dades.
Finalmente,porponerunosejemplosdebeneficioscuantificadosdeestasmedidas: el programa New York’s Heat Island Reduction Initiative, que se centra en el aumento del porcentaje de vegetación, en particular las cubiertas verdes,hacalculadoque,encasodequeun50%delostejadosplanosdeNueva York se reverdezcan, el efecto de isla de calor de la ciudad se podría reducirhastaenun0.88ºC.OenPhiladelphia(City of Philadelphia, 2009)
81
Nº 8 / 2018
RESILIENCIA EN EL CICLO URBANO DEL AGUAEL DRENAJE URBANO
sehaestimadoquelagestióndel50%delasuperficieurbanaimpermeableatravésdeSUDSproporcionaráalaciudadunos2,8billonesdedólaresenbeneficiosparael2049graciasalamejoradelacalidaddelaguaydelaire,la creación de espacio recreacional y la disminución de la temperatura de la ciudad.
Queda demostrado, por tanto, que las soluciones basadas en la naturaleza, en general, y los Sistemas de Drenaje Urbano Sostenible, en particular, son unaalternativareconocidaparahacerfrentealosretosderivadosdelcambioclimáticoque,comosehademostrado,afectarán(yyaestánafectando)alagestión del ciclo urbano del agua, al proporcionar soluciones y servicios con equivalentesosimilaresbeneficiosalainfraestructuraconvencional.Son,portanto,laopcióndefuturoporlasquelasciudadessindudahandeapostarpara convertirse en ciudades resilientes.
Imagen 14. Propuesta de ciudad verde del futuro según ARUP
Fuente: Cities Alive, ARUP, 2016.
82
Nº 8 / 2018
RESILIENCIA EN EL CICLO URBANO DEL AGUACONCLUSIONES
PuederesultarextrañalamenciónaestasituaciónenlasconclusionesdeunestudiodedicadoalimpactodelcambioclimáticoenelMediterráneo,perotalvez sea conveniente recordar que todas las descripciones coinciden en des-cribirelclimadeCiudaddelCabocomo“detipomediterráneo”.Comohe-mosvisto,lacuencadelMediterráneoesunadelasáreasmundialesdondeseestimaquepuedansermásevidentesloscambiosenlascondicionescli-máticasdurantelaspróximasdécadas,incrementándoseloseventosextre-mos de temperatura y precipitación (sequías y lluvias torrenciales). ¿Es tal vez Ciudad del Cabo un adelanto del futuro que nos espera?
Nonecesariamente.Siahondamosenlacomparación,nosencontramosconuna sorpresa: la precipitación media anual de la capital sudafricana varía en-tre 515 mm y 1.310 mm (la variación se debe, sobre todo, a las grandes dife-rencias entre las zonas costeras y las de montaña). Hablamos, por tanto, de una precipitación anual que supera de largo y puede llegar a cuadruplicar la de Alicante (en torno a 300 mm). Así pues, en términos de lluvias, Alicante podría representar, si acaso, el futuro de Ciudad del Cabo, y no a la inversa. Dehecho,deacuerdoconvariosestudios(RobertI.McDonaldet al., 2014), lamayoríadelasgrandesciudadesmundialesenriesgodecrisishídricaven-dríanaestarenzonasconmuchamayordisponibilidadderecursosquelacosta del sureste peninsular.
Esta comparación puede ayudarnos a matizar el concepto de “escasez de recursoshídricos”y,sobretodo,areflexionarsobrelaideaderesilienciaquedescribeestedocumento.Enestecontexto, resultadeespecial relevanciarevisar laestrategiaquehaasegurado lasostenibilidadhídricaenAlicantedurante las últimas décadas. Esta se asienta en varios aspectos, a saber:
• Diversificaciónde las fuentesdesuministro (aguasuperficial, subterrá-nea, desalación).
• Eficienciaenelusodelosrecursoshídricos,basadaasuvezenladismi-nución continuada de pérdidas, las mejoras en la medición y la concien-ciación ciudadana.
83
Nº 8 / 2018
RESILIENCIA EN EL CICLO URBANO DEL AGUACONCLUSIONES
• Gestión de la demanda, que permite comprender y predecir los factores que afectan al consumo.
Conviene destacar dos consideraciones que resumen aspectos fundamenta-les del caso descrito:
• Noexiste,usandolaexpresióninglesa,la“baladeplata”paragarantizarelsuministrourbano;laaproximacióndebeserentodomomentomúlti-ple,einclusolosobjetivosmásconcretos,comolamejoradelaeficien-cia, se alcanzan mediante una amplia batería de medidas (sectorización, búsqueda de fugas, automatización, renovación de infraestructuras...).
• La resiliencia en la gestión de los recursos hídricos es una carrera delargadistancia;eléxitodelaciudaddeAlicantehastalafechadehoysebasaenunalargahistoriadeadaptaciónauncontextodeescasez,enlaquelasestrategiassehanadaptadodeformacontinuayprogresiva.Sepodríadecirqueelpasadodecarestíahídricapropiadelsuresteespañolhaproporcionado,paradójicamente,unaventajaalahoradeafrontarelretoquesuponeelcambioclimático.
La cifra de precipitaciones anuales en la ciudad de Alicante antes mencionada tambiénpuede servir de referencia para resumir el carácter extremode losepisodios de lluvias torrenciales, si la comparamos con los 270 mm recogidos en el observatorio de Ciudad Jardín o incluso con los 137 mm de marzo de 2017.
• Plan Antirriadas de la Generalitat Valenciana.• Actuaciones complementarias del Plan contra Inundaciones, del Ayunta-
miento de Alicante.• Plan Especial de Inversiones de Aguas Municipalizadas de Alicante, in-
cluyendo el depósito anticontaminación José Manuel Obrero y el parque inundable La Marjal.
84
Nº 8 / 2018
RESILIENCIA EN EL CICLO URBANO DEL AGUACONCLUSIONES
• Obras de inversión ordinaria y de renovación de redes, de Aguas de Ali-cante.
Denuevo,hemosdedestacarelabordajedelproblemadesdemúltiplesface-tas;ningunadeestasactuacioneshubieraservidoporsísolapararesolverelriesgodeinundación.Elrefuerzodelaredsecundariadedrenajenoesnimásni menos importante que la ejecución de grandes colectores, ya que sin aquellaelaguanoserecogenillegaalosmismos;yestossonobviamentenecesarios para dar salida al gran volumen de agua captado. Por otra parte, ningunadelasanterioreshubierasidosuficienteenelcasodeplayadeSanJuansinlaejecucióndelparqueinundable.Además,lastécnicasdegestiónavanzada (modelización, sensorización, sistemas de ayuda a la renovación del alcantarillado, sistemas de alerta temprana, etc.) son un complemento imprescindible a las infraestructuras.
Estaúltimaactuaciónanticipalaorientaciónquetomarán,contodaprobabi-lidad, lossistemasdedrenajeurbanosostenibleen laspróximasdécadas,siguiendo también el modelo de otros países. Los ejemplos de prioridades e iniciativas en diferentes ciudades de todo el mundo pueden ayudarnos, sin duda,alahoradedesarrollarrespuestasadaptadasanuestrarealidad.Sinabandonarlaejecucióndeotrasinfraestructurasnecesarias—tampocoaquíexistenlassolucionesmágicas—adquirirán,sinduda,importanciacrecientey, comoenel casodel agua reutilizadaparausosurbanos, contribuiránacambiarelperfildelaciudad,mejorándolo.Esaalianzatripleentreresiliencia,sostenibilidad y calidad de vida parecen, sin duda, el camino a seguir ante los retosquenosplanteaelcambioclimático.
85
Nº 8 / 2018
RESILIENCIA EN EL CICLO URBANO DEL AGUAÍNDICE DE ILUSTRACIONES
Tabla2.IncrementodetemperaturaenlasaguasdelMediterráneooccidental frente a la Comunidad Valenciana (1985-2007) ................... 22
Tabla 3. Síntesis de los efectos del calentamiento térmico en las regiones delMediterráneoespañolaefectosdeplanificacióndelaguaenlasáreasurbanas ........................................................................................ 26
Tabla 5. Comparación de los costes de tratamiento en el ciclo urbano del agua ................................................................................................. 41
Tabla 6. Episodios de lluvias intensas con efectos de inundación en la ciudad y término municipal de Alicante en los siglos XX y XXI ............. 53
Tabla 7. Valores de lluvia intensa registrados en el observatorio de Alicante (Ciudad Jardín), durante el episodio del 13 de marzo de 2017 ................................................................................................. 74
Figuras
Figura 1. Precipitación diaria en Alicante (1940-2016) ................................. 15
Figura 3. Cambio en las precipitaciones intensas. Alicante (2000-2100) .... 19
Figura 4. Cambios en los patrones estacionales de precipitación en la península Ibérica en 1976-2005 (inferior), respecto al periodo 1946-1975 (superior) ............................................................................. 23
Figura 5. Cambios en los patrones territoriales de precipitación en la demarcaciónhidrográficadelJúcar(1958-2010) ................................. 24
86
Nº 8 / 2018
RESILIENCIA EN EL CICLO URBANO DEL AGUAÍNDICE DE ILUSTRACIONES
Figura 6. Evolución de las precipitaciones en la Comunidad Valenciana (horizonte2100) ..................................................................................... 25
Figura 7. Evolución de los recursos hídricos procedentes de desalación en el sistema de abastecimiento de la Mancomunidad de Canales del Taibilla, durante el periodo 2003-2015............................................ 29
Figura 8. Actuaciones técnicas y comerciales destinadas a la reducción del ANR ................................................................................................. 32
Figura 9. Evolución de la dotación de agua suministrada y número de contratos 1991-2016 ............................................................................. 33
Figura 10. Evolución del agua suministrada 1991-2016 .............................. 34
Figura12.Rendimientotécnicohidráulicoporzonasgeográficasyedadmedia de la red ..................................................................................... 35
Figura13.Rendimientotécnicohidráulicoporzonasgeográficasyedadmedia de los contadores ....................................................................... 35
Figura 14. Doble Red Urbana para la Reutilización de aguas (DRUR) en Alicante .................................................................................................. 37
Figura 15. Evolución del uso urbano de agua regenerada y crecimiento de zonas verdes .................................................................................... 38
Figura16.MapadelaevoluciónurbanadelaciudaddeAlicante,hasta el siglo XVIII ........................................................................................... 47
Figura 17. Plano de las actuaciones del Plan Antirriadas ............................ 57
Figura 18. Plano de las actuaciones realizadas zona casco urbano. Obras complementarias ........................................................................ 58
Figura 19. Red de drenaje en 1997 y 2017 .................................................. 61
Figura 20. Pluviograma de la precipitación recogida en el Observatorio Meteorológico de Ciudad Jardín el día 20 de octubre de 1982 ............ 63
87
Nº 8 / 2018
RESILIENCIA EN EL CICLO URBANO DEL AGUAÍNDICE DE ILUSTRACIONES
Figura 21. Pluviograma de la precipitación recogida en el Observatorio Meteorológico de Ciudad Jardín el día 30 de septiembre de 1997 ...... 63
Figura 22. Curvas IDF propias de la ciudad de Alicante, obtenidas a partir del estudio estadístico basado en los datos reales del Observatorio Meteorológico de Ciudad Jardín en el periodo 1938-2003 .................. 64
Figura 23. Distribución espacial de pluviómetros (en color verde) y limnímetros (en color rojo) en la ciudad de Alicante e isla de Tabarca ... 65
Figura 24. Esquema del depósito anticontaminación José Manuel Obrero .. 69
Figura 25. Esquema del parque inundable La Marjal (playa de San Juan, Alicante)ensuestadohabitualyencasoderetencióndelluvias ........ 71
Figura26.Gráficodeintensidadhorariadelalluviaacumuladaenelobservatorio de Alicante (Ciudad Jardín) durante el episodio de lluvias intensas de 13 de marzo de 2017 ......................................................... 75
Imágenes
Imagen1.Construccióndedepósitospluvialesbajounárearecreativa(parque público) en Rotterdam ............................................................. 11
Imagen 2. Efecto urbano de isla de calor. Impacto de las zonas verdes en su mitigación .................................................................................... 39
Imagen 3. Parque del Palmeral, Alicante ..................................................... 43
Imagen 4. Reformas en Alicante para el siglo XX. José Guardiola Picó ...... 51
Imagen 5. Efectos de la crecida del barranco urbano de San Agustín-San Blas en el barrio de San Blas (Alicante), durante la riada de 20 de octubre de 1982 .................................................................................... 52
Imagen 6. Efectos del desbordamiento del barranco urbano de San Agustín-SanBlasensutramofinalenlaavenidadeÓscarEsplá, estación de ferrocarril de Benalúa y CN-340, durante la riada de 30 de septiembre de 1997 ............................................................... 54
Imagen 7. Sustitución colector general Tramo I - Hinca Ø2500 bajo Gran Vía ................................................................................................. 59
88
Nº 8 / 2018
RESILIENCIA EN EL CICLO URBANO DEL AGUAÍNDICE DE ILUSTRACIONES
Imagen 8. Canalización alcantarillado de la calle Fernando Madroñal-conexiónconcolectorvíaParque ......................................................... 59
Imagen 9. Depósito anticontaminación José Manuel Obrero en funcionamiento tras un episodio de lluvias intensas sobre la ciudad de Alicante ............................................................................................ 70
Imagen 10. Vista general del parque inundable La Marjal (playa de San Juan, Alicante) ....................................................................................... 71
Imagen 11. Efectos de llenado con 15.000 m3 del parque inundable La Marjal con ocasión del episodio de lluvias intensas del 13 de marzo de 2017 ................................................................................................. 72
Imagen 12. Monasterio y plaza de la Santa Faz (Alicante), situado junto al cauce del barranco del Juncaret. Episodio de lluvias intensas de 13 de marzo de 2017 ....................................................................... 77
Imagen 13. Ejemplos de SUDS .................................................................... 79
Imagen 14. Propuesta de ciudad verde del futuro según ARUP ................. 81
La fuente de las ilustraciones es AMAEM para todos los casos en los que no se especifica de otro modo.
89
Nº 8 / 2018
RESILIENCE IN THE URBAN WATER CYCLEBIBLIOGRAFÍA
7. BIBLIOGRAFÍA
AEMA (2012). Los impactos del cambio climático en Europa: evaluación ba-sada en indicadores.InformeconjuntodelaAEMA,CCIyOMS.Oficinade Publicaciones de la CE y Ministerio de Medio Ambiente, Medio Rural y Marino, Madrid, 240 pp.
AEMET (2015). Proyecciones climáticas para el siglo XXI en España. Disponi-ble en: http://www.aemet.es/es/serviciosclimaticos/cambio_climat
Andrés-Doménech,J.;Hernández-Crespo,C.;Martín, M. y Andrés-Valeri, V. C.(2018).“Characterizationofwash-offfromurban impervioussurfaceand SUDS design criteria for sourcw control under semi-arid conditions”. Science of the Total Environment, 612, pp. 1320-1328.
Arahuetes,A.(2017).Los recursos no convencionales en el metabolismo hí-drico del litoral de la provincia de Alicante. Tesis doctoral. Universidad de Alicante (inédita).
Arnbjerg-nielsen,K.;Willems,P.;Olsson,J.;Beecham,S.;Pathirana,A.;Gre-gersen, I.B.;Madsen, H. y Nguyen, V. T. V. (2013). “Impacts of climate changeonrainfallextremesandurbandrainagesystems:areview”.Wa-ter Sci Technol., 68(1), pp. 16-28.
Ayala-Carcedo, F. J. (2000). “La ordenación del territorio en la prevención de catástrofesnaturalesytecnológicas.Basesparaunprocedimientotécni-co-administrativo de evaluación de riesgos para la población”. Boletín de la Asociación de Geógrafos Españoles,30(monográficosobre“RiesgosNaturales”), pp. 37-49.
Ayala-Carcedo,F.J.(2002).“Elsofismadelaimprevisibilidaddelasinunda-cionesylaresponsabilidadsocialdelosexpertos.Unanálisisdelcasoespañol y sus alternativas”. Boletín de la Asociación de Geógrafos Espa-ñoles, 33, pp. 79-92.
BañosCastiñeira,C.J.;VeraRebollo,J.F.yDíezSanto,D.(2010).“Elabas-tecimiento de agua en los espacios y destinos turísticos de Alicante y Murcia”. Investigaciones Geográficas, 51, pp. 81-105.
Barredo,J.I.;Saurí,D.yLlasat,M.C.(2012).“Assessingtrendsininsuredlos-sesfromfloodsinSpain1971-2008”.Natural Hazards and Earth System Science, 12(5), pp. 1723-1729.
RESILIENCIA EN EL CICLO URBANO DEL AGUABIBLIOGRAFÍA
Barton,J.eIrarrázabal,F.(2016).“Adaptaciónalcambioclimáticoygestiónderiesgosnaturales:buscandosíntesisenlaplanificaciónurbana”.Re-vista de Geografía de Norte Grande, 63, pp. 87-110.
Burriel, E. L. (2009). “Los límites del planeamiento urbanístico municipal. El ejemplo valenciano”, Documents d’Anàlisi Geogràfica, 54, pp. 33-54.
Butler,D.yDavies,J.W.(2000).Urban drainage.London,UK:E&FNSpon,624 pp.
Calvo García-Tornel, F. (2001). Sociedades y territorios en riesgo. Barcelo-na, Ediciones del Serbal, colección “La Estrella Polar”, 31, Barcelona, 186 pp.
Castro-Fresno, D.; Andrés-Valeri, V. C.; Sañudo-Fontaneda, L. A. y Rodrí-guez-Hernández, J. (2013). “Sustainable Drainage Practices in Spain,specially focused on pervious pavements”. Water, 5, pp. 67-93.
CIRIA (2000). Sustainable Urban Drainage Systems – Design Manual for Scot-land and Northern Ireland, CIRIA C521 and Sustainable Urban Drainage Systems –DesignManualforEnglandandWales,CIRIAC522.
Connolly, R. y Connolly, M. (2014). “Urbanization bias I. Is it a negligible pro-blem for global temperature estimates?” Open Peer Rev. J., 28 (Clim. Sci.), URL: http://oprj.net/articles/climate-science/28
Consorcio de Compensación de Seguros (2016). Estadística de Riesgos Ex-traordinarios. Serie 1971-2016. Madrid, 147 pp.
Consorcio de Compensación de Seguros (2017). Guía para la reducción de la vulnerabilidad de los edificios frente a las inundaciones. Ma-drid, MAGRAMA, MINECO y Consorcio de Compensación de Segu-ros, 103 pp.
ElorrietaSanz,B.;OlcinaCantos,J.ySánchezAguilera,MªD. (2016). “LasosteniblidadenlaplanificaciónterritorialdeescalaregionalenEspaña:estudio de casos”, Cuadernos Geográficos, 55(1), pp. 149-175.
ESPON Climate (2011). Climate Change and Territorial Effects on Regions and Local Economies. Main Report. Available at: http://www.espon.eu/export/sites/default/Documents/Projects/AppliedResearch/CLIMATE/ESPON_Climate_Final_Report-Part_B-MainReport.pdf.
RESILIENCIA EN EL CICLO URBANO DEL AGUABIBLIOGRAFÍA
Fernández,A.E.;Perales,S.yDomenech,I.(2008).“LosSistemasUrbanosdeDrenajeSostenible(SUDS)enlahidrogeologíaurbana”.IX Simposio de Hidrogeología. AEH-IGME,AtElche,1.
Gil Olcina, A. y Olcina Cantos, J. (2017). Tratado de climatología. Alicante. Publicaciones de la Universidad de Alicante, 945 pp.
Gil-Guirado,S.;Pérez,A. yBarriendos,M. (2014). “Increasing vulnerabilitytoflooding in thesouthernSpanishMediterraneancoast (1960-2013)”,Hydrological Extreme events in historic and prehistoric times, Bonn (Ale-mania). En http://bit.ly/1tmAbNm
GonzálezGarcía,J.L.(ed.)(2009).Mapas de riesgos naturales en la ordena-ción urbanística.Madrid.IlustreColegioOficialdeGeólogos.101pp.
IntergovernmentalPanelonClimateChange,IPCC(2014).Climate Change 2013 and Climate Change 2014. Disponible en: http://www.ipcc.ch/
JRC (2009). The PESETA project. Impact on climate change in Europe. Euro-pean Commission. Disponible en http://peseta.jrc.ec.europa.eu/
JRC (2017). Atlas of the Human Planet 2017. Global Exposure to Natu-ral Hazards.EuropeanCommission.DGJoinResearchCenter.Ispra, 92 pp.
March,H.;Hernández,M.ySaurí,D. (2015).“Percepciónderecursoscon-vencionales y no convencionales en áreas sujetas a estrés hídrico: elcaso de Alicante”, Revista de Geografía Norte Grande, 60, pp. 153-172.
Marcos-García,P.yPulido-Velázquez,M.(2017).“Cambioclimáticoyplanifi-caciónhidrológica:¿Esadecuadoasumirunporcentajeúnicodereduc-ción de aportaciones para toda la demarcación?”, Ingeniería del Agua, 21(1), pp. 35-52.
Melgarejo-Moreno, J. y López-Ortiz, M. I. (2016). “Depuración y reutilización de aguas en España”. Agua y Territorio, 8, pp. 22-35, julio-diciembre 2016, Universidad de Jaén.
MinisteriodeViviendayColegioOficialDeGeólogos(2008).Riesgos Natu-rales. Guía Metodológica para la elaboración de cartografías en España. Madrid, 176 pp.
RESILIENCIA EN EL CICLO URBANO DEL AGUABIBLIOGRAFÍA
Monjo, R. y Martín-Vide J. (2016). “Daily precipitation concentration around theworldaccordingtoseveralindices”,International Journal of Climato-logy. doi:10.1002/joc.4596.
Observatorio de la Sostenibilidad de España (2012). Atlas de la sostenibilidad en España.AlcaládeHenares.ObservatoriodelaSostenibilidadenEs-paña, Ministerio de Medio Ambiente.
Olcina Cantos, J. (2007). Riesgo de inundaciones y ordenación del territorio en España.Murcia,InstitutoEuromediterráneodelAgua,381pp.
Olcina Cantos, J. (2009). “Hacia una ordenación sostenible de los territorios deriesgoenEuropa”,enFarinós,J.;Romero,J.ySalom,J.(eds.),Cohe-sión e inteligencia territorial. Dinámicas y procesos para una mejor planifi-cación y toma de decisiones, Publicaciones de la Universitat de Valencia, Valencia, pp. 153-182.
OlcinaCantos, J. (2013). “Experiences inadapting toClimateChangeandClimate Risk in Spain”, en Climate Change Adaptation in practice: from strategy development to implementation (PhilippSchmidt-Thome y Jo-hannesKlein,eds.),Wiley-Blackwell,pp.253-268.
Olcina Cantos, J. y Díez-Herrero, A. (2017). “Cartografía de inundaciones en España”, Estudios Geográficos, 78(282), pp. 283-315.
OlcinaCantos,J.;HernándezHernández,M.;RicoAmorós,A.M.yMartínezIbarra,E.(2010).“IncreasedriskoffloodingonthecoastofAlicante(Re-gion of Valencia, Spain)”, Natural Hazards, 10(11), pp. 2229-2234.
OlcinaCantos,J.;BañosCastiñeira,C.yRicoAmorós,A.M.(2016).“Me-didasdeadaptaciónalriesgodesequíaenelsectorhotelerodeBeni-dorm (Alicante, España)”, Revista de Geografía Norte Grande, 65, pp. 129-153.
OlcinaCantos,J.yRullánSalamanca,O.(2017).“Consecuenciasambienta-les de la actividad económica”, en Geografía Humana de España / Rome-ro,J.(coord.),Ed.TirantLoBlanch,pp.526-641.
OlcinaCantos,J.yVera-Rebollo,J.F.(2016b).“ClimatechangeandtourismpolicyinSpain:DiagnosisintheSpanishmediterraneancoast”,Cuader-nos de Turismo de la Universidad de Murcia, 38, pp. 565-571.
RESILIENCIA EN EL CICLO URBANO DEL AGUABIBLIOGRAFÍA
Olcina,J.;Saurí,D.;Hernández,M.yRibas,A.(2016).“FloodpolicyinSpain:a review for the period 1983-2013”,Disaster Prevention and Manage-ment: an International Journal, 25(1), pp. 41-58.
Olcina,J.,Morote,A.yHernández,M.(2018).“Evaluacióndelosriesgosna-turales en las políticas de ordenación urbana de los municipios de la provincia de Alicante. Legislación y cartografía de riesgo”, Cuadernos Geográficos de Granada (en prensa).
OrganizaciónMundialdelaSalud-WHORegionalOfficeforEurope(2016).Urban green spaces and health. A review of evidence, pp. 9-11.
Paneque,P.(2015).“DroughtmanagementstrategiesinSpain”,Water, 7, pp. 6689-6701.
Pastor,F.,Valiente,J.A.yPalau,J.L.(2017).“SeasurfacetemperatureintheMediterranean climatology, trends and spatial patterns” cartel presenta-do en 10th Hymex Workshop in Barcelona (4-7 July 2017), http://www.ceam.es/VERSUS/publications.html
Perales-Momparler, S.; Andrés-Doménech, I.; Hernández-Crespo, C.; Va-llés-Morán,F.;Martín,M.;Escuder-Bueno, I. yAndre, J. (2017). “Therole of monitoring sustainable drainage systems for promoting transition towardsregenerativeurbanbuiltenvironments:astudyinthevalencianregion, Spain”. Journal of Cleaner Production, 163, pp. S113-S124.
PérezMorales,A.;Gil-Guirado,S.yOlcina-Cantos,J. (2015).“Housingbu-bblesandtheincreaseoffloodexposure.Failuresinfloodriskmanage-mentontheSpanishsouth-easterncoast(1975-2013)”,Journal of Flood Risk Management (DOI: 10.1111/jfr3.12207), pp. 1-12.
Perles Roselló, M. J. y Cantarero Prados, F. (2010). “Problemas y retos en el análisisdelosriesgomúltiplesdelterritorio:propuestasmetodológicaspara la elaboración de cartografías multi-peligros”. Boletín de la Asocia-ción de Geógrafos Españoles, 52, pp. 245-271.
Prieto,F.;Campillos,M.yFontcuberta,X.(2010).“Cambiosenlaocupacióndel suelo en España 1987-2005”, Ecologista, 65, pp. 40-43.
Rico-Amoros,A.;Olcina-Cantos,J.ySauri, D. (2009). “Tourist Land Use Pa-tternsandWaterDemand.EvidencefromtheWesternMediterranean”, Land Use Policy, 26, pp. 493-501.
RESILIENCIA EN EL CICLO URBANO DEL AGUABIBLIOGRAFÍA
Rodríguez-Rojas,M.I.;CuevasArrabal,M.M.;MorenoEscobar,B.;MartínezMontes, G. y Muñoz Ubiña, A. (2017). Guía para la integración de los Sistemas Urbanos de Drenaje Sostenible en el Proyecto Urbano. Editorial Universidad de Granada, 132 pp.
Rougé,P.yHernández,F.(2016).“Elcostedenoregenerar”.La reutilización del agua en el marco de la economía circular. Asociación Española de Desalación y Reutilización – Asociación Española de Abastecimientos de Agua y Saneamiento.
Saurí,D.;Olcina,J.;March,H.;Martín-Vide,J.;Vera,F.;Padilla,E.ySerra-Llo-bet, A. (2011). “Case Study Mediterranean Coast of Spain”, en ESPON Climate: Climate Change and Territorial Effects on Regions and Local Economies. Applied researchproject 2012/1/4. FinalReport. Annex 4.Disponible en: www.espon.eu/export/sites/default/Documents/Projects/AppliedResearch/CLIMATE/ESPON_Climate_Final_Report_Annex4_Spain_Case_Study.pdf.
Saurí,D.;Olcina,J.;Vera,J.F.;Martín-Vide,J.;March,H.;Serra-Llobet,A.yPadilla,E(2013).“Tourism,climatechangeandwaterresources:coastalMediterraneanSpainasanexample”.enSchmidt-Thome,PhilipyGrei-ving, Stefan (coords.), European Climate Vulnerabilities and Adaptation: A Spatial Planning Perspective,Willey,pp.231-252.
Schmidt-Thomé,P.(ed.)(2005).The spatial effects and management of natu-ral and technological hazards in Europe.Luxemburgo.ESPON(thematicproject 1.3.1.) (disponible en: www.espon.eu)
Serrano Notivoli, R. (2017). Reconstrucción climática instrumental de la pre-cipitación diaria en España: ensayo metodológico y aplicaciones. Tesis doctoral, inédita. Universidad de Zaragoza. Facultad de Filosofía y Le-tras. Departamento de Geografía y Ordenación del Territorio. Zaragoza, 234pp.+anexocartográfico.
Shaltout,M.yAnders,O. (2014).“Recentseasurfacetemperature trendsand future scenarios for theMediterraneanSea”,Oceanologia, 56(3), pp. 411-443.
Stern, N. (2006). The Economics of Climate Change: The Stern Review. Cam-bridge. Cambridge University Press.
RESILIENCIA EN EL CICLO URBANO DEL AGUABIBLIOGRAFÍA
Vargas,J.yPaneque,P.(2017).“MethodologyfortheanalysisofcausesofdroughtvulnerabilityontheRiverBasinscale”,Natural Hazards, 13 pp. DOI: 10.1007/s11069-017-2982-4
Vera Rebollo, J. F. (2006). “Agua y modelos de desarrollo turístico: la nece-sidad de nuevos criterios para la gestión de los recursos”, Boletín de la Asociación de Geógrafos Españoles, 42, pp. 155-178.
VeraRebollo,J.F.yRodríguezSánchez,I.(eds.)(2012).Renovación y rees-tructuración de destinos turísticos en áreas costeras, Valencia, Publica-ciones de la Universitat de València, 429 pp.
Villar-García,A.(2016).“Reutilizacióndeaguasregeneradas:aproximaciónalos costes de producción y valoración de su uso”. Agua y Territorio, 8, pp. 70-79, julio-diciembre 2016, Universidad de Jaén.
WorldMeteorologicalOrganization,CentreforResearchontheEpidemiologyofDisasters (Cred)&UniversitéCatholiquedeLouvain (2014).Atlas of Mortality and Economic Losses from Weather, Climate and Water Extre-mes 1970-2012.Geneva,Switzerland:WMO.
Wood-Ballard,B.;Kellagher,R.;Martin,R.;Jeffenes,C.;Bray,R.ySheffer,P. (2007). The SuDS Manual. CIRIA C697. London.
96
Nº 8 / 2018
RESILIENCIA EN EL CICLO URBANO DEL AGUAAUTORES
AUTORES
JORGE OLCINA CANTOSCatedráticodeAnálisisGeográficoRegionalenlaUniversidaddeAlicantey responsable del Instituto de Climatología de la Universidad de Alicante. Actualmente, presidente de Asociación de Geógrafos de España
RESILIENCE IN THE URBAN WATER CYCLE. RAINFALL EXTREMES AND ADAPTING TO CLIMATE CHANGE IN THE MEDITERRANEAN AREA
In collaboration with:
Jorge Olcina Cantos, Andrés Campos Rosique, Ignacio Casals del Busto, Juan Ayanz López-Cuervo, Miguel Rodríguez Mateos, Montse Martínez Puentes
Joaquín Marco Terres, Agustín Plaza Martínez, José Ramón Moya Botella, Luis Cutillas Lozano
Nº 8
8JUNIO 2018
Autores: Jorge Olcina Cantos, Andrés Campos Rosique, Ignacio Casals del Busto, Juan Ayanz López-Cuervo, Miguel Rodríguez Mateos, Montse Martínez PuentesOtras colaboraciones: Joaquín Marco Terres, Agustín Plaza Martínez, José Ramón Moya Botella, Luis Cutillas Lozano"* )
RESILIENCIA EN EL CICLO URBANO DEL AGUA. EXTREMOS PLUVIOMÉTRICOS Y ADAPTACIÓN AL CAMBIO CLIMÁTICO EN EL ÁMBITO MEDITERRÁNEO
En colaboración con:
8
Nº 8
8JUNIO 2018
Autores: Jorge Olcina Cantos, Andrés Campos Rosique, Ignacio Casals del Busto, Juan Ayanz López-Cuervo, Miguel Rodríguez Mateos, Montse Martínez PuentesOtras colaboraciones: Joaquín Marco Terres, Agustín Plaza Martínez, José Ramón Moya Botella, Luis Cutillas Lozano"* )
RESILIENCIA EN EL CICLO URBANO DEL AGUA. EXTREMOS PLUVIOMÉTRICOS Y ADAPTACIÓN AL CAMBIO CLIMÁTICO EN EL ÁMBITO MEDITERRÁNEO
En colaboración con:
Nº 8
8JUNE 2018
Authors:
Other collaborators: "* )
RESILIENCE IN THE URBAN WATER CYCLE. RAINFALL EXTREMES AND ADAPTING TO CLIMATE CHANGE IN THE MEDITERRANEAN AREA
In collaboration with:
Jorge Olcina Cantos, Andrés Campos Rosique, Ignacio Casals del Busto, Juan Ayanz López-Cuervo, Miguel Rodríguez Mateos, Montse Martínez Puentes
Joaquín Marco Terres, Agustín Plaza Martínez, José Ramón Moya Botella, Luis Cutillas Lozano
Universidad de AlicanteandHeadoftheUniversidad de Alicante Climate Institute.CurrentlyChairmanoftheSpanishAssociationofGeographers
• AndrésCamposRosique,TechnicalOfficeProjectEngineer,(Aguas de Alicante)
• IgnacioCasalsdelBusto,R&D&IManager(Aguas de Alicante)• JuanAyanzLopez-Cuervo,ProductionManager(Aguas de Alicante). • MiguelRodriguezMateos,OperationsManager(Aguas de Alicante).• MontseMartínezPuentes,R&D&IManageroftheUrbanDrainage
Directorate (Suez Advanced Solutions)
Other collaborators: • JoaquínMarcoTerres,OperationsManagerofSuezintheAutonomous
Region of Valencia• AgustínPlazaMartínez,Hydrogeologist(Aguas de Alicante)• JoséRamónMoyaBotella,HeadofMaintenance,NetworkManagementandReusedWater(Aguas de Alicante)
• LuisCutillasLozano,SanitationOperationTechnician(Aguas de Alicante)
Nº 8 / 2018
SUMMARY
1. INTRODUCTION: CLIMATE, CLIMATE CHANGE, WATER AND URBAN RESILIENCE
2. MEDITERRANEAN CLIMATE, A VERY COMFORTABLE CLIMATE BUT WITH EXTREME RAINFALL
2.1.DROUGHTSANDWATERSUPPLIES2.2. EXTREME RAINY PERIODS IN MEDITERRANEAN CLIMATE2.3. EFFECTS OF CLIMATE CHANGE2.4.CHALLENGESFORTHEURBANWATERCYCLE
4.1.BACKGROUND.URBANEVOLUTIONOFALICANTE:APROCESSOF GRADUAL “ABSORPTION” OF GULLIES IN ITS URBAN SECTION4.2. ORIGINS AND DEVELOPMENT OF THE ALICANTE DRAINAGE NETWORK
4.4.4.Singularactions:theJoséManuelObreroanti-pollutiontankandtheLaMarjalFloodPark4.4.5.FloodriskdiagnosisfortheCityofAlicante:theveryrainyspell on 13thMarch2017.
4.5. FUTURE URBAN DRAINAGE CHALLENGES. URBAN SUSTAINABLE DRAINAGE SYSTEMS AS MEASURES FOR ADAPTING TO CLIMATE CHANGE
5. CONCLUSIONS
6. INDEX OF ILLUSTRATIONS
7. BIBLIOGRAPHY
AUTHORS
165
170
174
179
182
186
193
103
Nº 8 / 2018
RESILIENCE IN THE URBAN WATER CYCLEINTRODUCTION:CLIMATE,CLIMATECHANGE,WATERANDURBANRESILIENCE
1. INTRODUCTION: CLIMATE, CLIMATE CHANGE, WATER AND URBAN RESILIENCE
Climatechange,therainfallextremesthatcomewithitandwhichhavealreadybeguntoappear,hasbecomethemaincourseofaction inwatermanagementinurbanzones.AdaptingsupplyandfloodevacuationinfrastructurestothenewclimatesituationthathasbeenestimatedfortheMediterraneanclimateareasisessentialifonewishestoenablecitiestoincreasetheirresilienceandtobeabletowithstandenvironmentalcondi-tionsintheimmediatefuture.Overthepasttwodecades,theCityofAli-cante,ontheshoresoftheSpanishMediterranean,hastakenaseriesofactionsaimedat reducingwater risksandthusprepare itself for thecli-matechangescenario.Thisworkanalyses theunderlyingcausesof thekindofclimatehazardassociatedwithextremerainfall in theMediterra-neanworld, highlighting Alicante as an example of an area with a highlevelofclimaterisksandclimatechange,duetothehighlevelsofvulner-abilityandexposure.Pastandpresentsolutionsareexaminedthathavebeentakentoreducethenegativeimpactoffloodsanddroughts,througha detailed analysis of the actions carried out in the urban environment.Someoftheseactionshavebeentakenthroughouttime,andrangefromthosethataremerelystructuraltothosebaseduponlandscapingandim-provingurbanresilience,byincorporatingtheprinciplesofenvironmentalandterritorialsustainability,aswellastheprincipleofsocialresponsibilitythathaveallguidedtheactivitiesofthecompanythatmanagesthewholewatercycleintheCityofAlicante.Thishasallbeendonewithinaframe-workofgoodcodesofpracticethatcanserveasanexampleforMediter-raneanurbanenvironmentswithsimilarclimatic,environmentalandterri-torial problems.
In2018,overhalftheworld’spopulationliveincities.InEurope,thispercent-ageisashighas75%.Thepercentageofpeoplelivingincitieswillriseto75%inthenextthreedecades.TheEarthhasbecomeageographicalareadominatedbycities.Thetransformationhasbeenswiftanddevastatinginthe last50years.Untilmidway through the lastcentury, ruralareaswerepredominantintheprocessesofterritorialtransformation,butthisrolehasnowbeentakenoverbycities.Thischangehasundoubtedlybroughtaboutmanyimprovementsformankind,buthasalsotakenitstollonthehealthofthesurfaceoftheplanet.Oneoftheseeffects,andcertainlythemostout-standingone,hasbeenthepollutionoftheatmospherewithgasesemittedbytheburningoffossil.Ithasbeendemonstratedthatthishasadirectim-pactonthecurrentglobalwarmingprocess.Climatechangeowingtothegreenhouseeffectisnowundeniablyascientificfactthatiscausingchanges
104
Nº 8 / 2018
RESILIENCE IN THE URBAN WATER CYCLEINTRODUCTION:CLIMATE,CLIMATECHANGE,WATERANDURBANRESILIENCE
intheusualclimateconditionsinthedifferentregionsoftheworld.TheMed-iterraneanRegion,whoseclimateisgenerallyandhealthy,sometimeexperi-encesextraordinaryspellsthataffectthelivesandeconomiccircumstancesofitsinhabitants.Sincethedistantpast,floodsanddroughtshavebeenthemost frequent hazardous atmospheric phenomena in the MediterraneanArea,andthesehaveforcedhumanstoadapttheireconomicactivitiesandurbancentrestotheseextremeclimateconditions.
CoexistencewithfloodsanddrougthsintheMediterraneanhasundergonechangesthroughouthistory.Adaptinglanduseandcitiestotheseclimatehazards,whichwastheusualapproachadoptedbyruralsocietiesrevolvingaround agriculture, was replaced by attempts by Mediterranean societies to dominatenature,allthisbeingpromptedbyscientificprogressandtechni-calbreakthroughs.Thisattitudetotheenvironment,whichwaspredominantuntiltheturnofthecentury,hadamajorimpactontheland.Asfrom1992,attheenvironmentalsummitheldinRiodeJaneiro,anewapproachisbeingmadetotherelationshipbetweenhumansandnature,withadecisionbeingtaken to make sustainability the main criterian to be taken into accountwhereenvironmentalactivitiesareconcerned.
Asaresult,therehasbeenamoveawayfromchannellingriverbedsorcon-structingwatertransfersystemstowardstakingbasicactionstoreducetheriskoffloodinganddroughtinMediterraneanurbanenvironments,develop-ingfloodparks,riverrestoration,rainwatertanksoradaptingurbandesigntothoseextremeatmosphericphenomena,asexamplesofgoodandsus-tainable adaptation practices aimed at minimising the consequences ofsuchrisks.
Andclimateinthefuture, inthecurrentcontextofglobalwarming,isonlygoingtoincreasetheuncertaintysurroundingthewaythemainclimateele-mentsintheMediterraneanAreaaregoingtoreact.Tobeginwith,itmustbepointedoutthatahotteratmosphere is invariablyanatmosphereofmoreenergetic andcontractedairmassmovements, in searchof a theoreticalequilibriumwithintheglobaland/orregionalenergybalancesystem.Sothe
105
Nº 8 / 2018
RESILIENCE IN THE URBAN WATER CYCLEINTRODUCTION:CLIMATE,CLIMATECHANGE,WATERANDURBANRESILIENCE
globalwarmingthathasbeenrecordedoverthepastthreedecadesiscon-ducive to quicker and sharper weather change developments and to in-creasinglyfrequentextremeevents.Thiscanalreadybeseeninthesynopticsequences that are being recorded in our country (GilOlcina andOlcinaCantos,2017).ClimatechangemodelsalsoagreethattheareaswithaMed-iterraneanclimatearevery likely toexperience the followingalterations inthenextfewdecades:
• A rise in the maximum temperature, which will affect not only thedailymaximum temperaturesbutalso thenightlyminimums. It is aprovenfactthattheSpanishMediterraneancoastlineisincreasinglyexperiencing themajor temperature risesof the so-called “tropicalnights” (temperature above 20 ºC) with their great discomfort andfrom1980their frequencyhas increasedthreefold;wenowhave70hotnightsof this typeper year.All in all,wearenowwitnessingalossof“climatecomfort”thatcouldbecomemoreaccentuatedinthecoming decades.
• More pronounced irregularities in rainfall and a general trend towards adropintheannualvalues.Furthermore,thishasbeenprovedwiththerainfalldatafromtheclimateseriesontheSpanishMediterraneanCoast.Therearetwoaspectsofinterestwhenitcomestoadaptingci-tiestoclimatechangeasaresultofthesechangesinprecipitations:itisraininglessintheupperreachesoftheriverswhosesourcesareintheCordilleraIbérica(Jucar,TuriaandTajo)andthisflow-ratereduc-tionintheupperreachesismostnotableinspring,whichisbasicallyotherseasonforplanningwateruseinthesummermonthsf(irrigationandtourism).Andsecondly,thetotalamountof“torrential”rainthatissocharacteristicofautumnintheMediterraneanarea,isbecominglessandlessabundant,yetthedownpoursareheavierperhour,i.e.,enormous amounts of water (over 200 mm) are not needed to cause floodingproblems in urban areas, an occurrence thatwas frequentin theseventies,eightiesandnineties.Nowadays, rain ranging from50to75mmfallinginonlyanhourissufficienttocauseflooding,soit isnecessary to takeanew lookat thedesigns required forurbanrainwaterevacuationsystemssothattheycanadapttothisnewwayof raining.
• TheMediterraneanSea,ourmainsignofgeographicalandculturaliden-tity in the regionsandcountriesborderingon thisSea, isundergoingrapidchangesthatarealsogoingtoaffecttheclimateinthefutureintheStateswithMediterraneanborders.Themostoutstandingchangeisthe
106
Nº 8 / 2018
RESILIENCE IN THE URBAN WATER CYCLEINTRODUCTION:CLIMATE,CLIMATECHANGE,WATERANDURBANRESILIENCE
increaseinthetemperatureoftheSea’ssurfacethathasbeenrecordedsince1980.Thishasbeentakingplaceatanaverageof1ºCthroughouttheMediterranean’sWesternBasin,althoughtherearezoneswherethe-rehasbeenariseof2ºCinjustoverthreedecades.Thisincreasecanbe perceived especially in spring and autumn, because the seawaterremainsaswarmorverywarminthesetwoseasonsasitisinsummer.So the potentially unstable conditions (warm seawater) last for moremonthsintheyear,andthisphenomenonismorelikelytoleadtospellsofheavyrainforalongerperiod.SothatthecalendaroftorrentialrainfallontheSpanishMediterraneancoastisnolongerlimitedtoautumn,butcanalsooccurinspring,attheendofautumnoratthestartofwinter,aswellasinthesummermonths,whenevertheatmosphericconditionsareconducivetosuchspellsoccurring.
TheMediterraneanregionsmustnowadapttothesethreeaspectsofMedi-terraneanclimatechange,whichalreadyexistedbutwilltendtogetworseinthecomingdecades.Thisadaptation isparticularly important intheurbanareas,whicharethezoneswherevulnerabilityishigher(populationandeco-nomicactivities) andwhere therewillbegreaterexposure tospellsofex-tremeweatherconditions.
AdaptingcitiestoclimatechangeisnotaquestionthataffectsourcountryinparticularandneitherisitspecifictotheMediterraneanshoresoftheSpa-nishMediterranean,giventhespecialclimateconditionsnowandinthefu-ture,itisaphenomenonthataffectsthewholeplanet.However,itmustbeadmittedbytheAuthoritiesandcitizensalike,thatitisamatterthathastobeaddressed immediately and measures must be taken to increase resistance andresilienceintheurbanareasoftheSpanishMediterranean,owingtotheirgreatvulnerabilityandexposuretothemainatmosphericextremes(floodinganddrought)andthewaysthattheserisksmightdevelopwithinthecontextofglobalwarming.Althoughit istruethatmanyactionshavealreadybeentakeninthissenseinthecitiesintheSpanishMediterranean,thereisstillalot of work to be done.
RESILIENCE IN THE URBAN WATER CYCLEINTRODUCTION:CLIMATE,CLIMATECHANGE,WATERANDURBANRESILIENCE
Someexamplesareofgreatinterest,suchasthepassingofthe“GreenRoofLaw” inCopenhagen or Antwerp; the construction of stilt houses in NewOrleanstopreventsuchdisastersasHurricaneKatrina in2005;buildingamulti-purposefloatingpavilioninRotterdamtowithstandtheriversburstingtheirbanksandheighteningdikestoprotectanypoldersthatcouldbeaf-fectedbythecombinedactionoffloodingandwavesinthecoastalzonesofdifferent areas of theNetherlands1; raised buildings inHelsinki,within theframeworkofthe“BaltCICA”Projectputintopracticebythecountriesbor-deringontheBalticSea,toadapttoclimatechange.
MentionmustbemadeoftheNYCPlan“AGreenerGreaterNewYork”,setinmotion in2007becauseof its territorialgiventhat it isamajormega-lopolis;itisthestrategicplanforthecityreformulatedin2011witha2030timeframe.TheNYCPlancontains132initiativesand400specificobjec-tivestobedevelopedbythattimeframe.ThePlanincludesaspecificsec-tionforadaptingthemegalopolistoclimatechange,aswellasotheras-pects that involvehousing, green zones, areas,water,waste, air qualityandmobility.Theaforementionedsectionfeatures13mitigationandadap-tation initiatives that include a 30% reduction in greenhouse-effect gasemissionsby2030,whencompared to the2005emission,collaboratingwiththeFEMAinupdatingthecityfloodmapsfora100-yearreturnperiod,updating the construction standards, encouraging flood-protectionschemesforhousingincoordinationwithinsurancecompanies,reducingtheurbanheat island, incorporating theclimatechangeprojects intoanemergencyand riskcommunicationmanagementplan for thecitycom-munitiesinordertoimprovetheirabilitytowithstandclimatechangeandtheassociatedweatherhazards.
In2013,theEuropeanUniongaveitsapprovaltoaClimateChangeAdapta-tionStrategy,theaimofwhichwastoimplementeightactionstomakethecountriesintheUnionmoreresilienttotheexpectedclimatechangecondi-tions.Threeprioritieshavebeensettoimplementtheseactionsinthecomingyears:carryingouttheactivitiesenvisagedintheMemberStates;improvingtheinformationaboutclimatechangesofact-baseddecisionscanbetaken;and,togiveprecedencetothesectorsthatareespeciallyvulnerable.Withinthis context, the platform Climate-ADAPT brings together the informationabouttheEuropeanprojectsinvolvingadaptationtoclimatechangethatarebeing and have been developed in different countries now and in recentyears.
2 This interesting climate change adaptation programme for the City of Rotterdam can beseen at: http://www.rotterdamclimateinitiative.nl/en/100procent-climate-proof/projecten/rotter-dam-climate-change-adaptation-strategy?portfolio_id=181(VisitedinAugust2015).
RESILIENCE IN THE URBAN WATER CYCLEINTRODUCTION:CLIMATE,CLIMATECHANGE,WATERANDURBANRESILIENCE
a major “green-blue corridor”, in the form of a canal running from theRiverMaastothe‘Zuiderpark’inRotterdamthat,togetherwiththeenvi-ronmentaleffects(greenandbluezone)canbeutilisedasawatersupplylineduringdryspellstomakethemostoftheresourcesinthelakesinthislargeparksotheycanbeusedaswaterstoragefacilitiesforsupplypur-poses.
Image 1.Constructionofrainwatertanksbeneatharecreationalzone(publicpark) in Rotterdam
Source: Rotterdam Climate Initiative.
SomeofthecitiesalongtheSpain’sMediterraneanCoast,suchasBarce-lona,Calvià,Marbella,Reus,Valencia,Malaga,havegiventheirapprovaltolocalPlansorStrategiesforadaptingtoclimatechangeandimprovingurbanresilience.Oneoutstandingexampleistheconstructionofrainwatertanksinthe“Ensanche”inBarcelonatolimittheimpactoffloodingonthecity.However,itissurprisingtofindthattherearenotmanysuchexamplesin the touristmunicipalities in this part of Spain. By contrast, there aremanycasesintheBasqueCountry,wherenumerousmunicipalitieshavedrawnupspecificplansofaction,passedby-lawsandhavealreadyimple-mented specific measures in recent years (e.g. in Bilbao, Balmaseda,Hondarribia,Areatza,Tolosa,Durango,Amurrio,etc.).Infact,theBasqueGovernment itself has prepared an urbanplanningmanual (2012)whichurges themunicipalities to applymeasures to take action and adapt toclimatechange.
110
Nº 8 / 2018
RESILIENCE IN THE URBAN WATER CYCLEINTRODUCTION:CLIMATE,CLIMATECHANGE,WATERANDURBANRESILIENCE
Inrecentyears,theSpanishFederationofMunicipalitiesandProvinceshasdeveloped a series of initiatives to encourage local action in matters con-cerningcombatingandadaptingtoclimatechange.Since2009,theafore-mentionedSpanishNetworkofCitiesforClimate,hasfollowedthedevel-opmentofannualreportson“LocalPoliciescombatingclimatechange”,preparedaninformativedocumenton“Climatechangevulnerabilityonalocal level” (2010)3anddrawnupa“Guidetothedraftingoflocalregula-tionstocombatclimatechange”(2012)4, containing guidelines for prepar-ingand implementingmunicipalby-laws for thesectorsassociatedwiththe mitigation of and adaptation to climate change (energy, transport,waste,water,housing,urbanplanning,participationandtaxation).
Furthermore, the company responsible for urban implementation in thesectorsthatdependonwaterfordevelopmentandexpansionhasdevisedaseriesofstrategiesandmeasuresforadaptingtoclimatechangethatarewellworthmentioning.Themostoutstandingcaseinpointisinthetourismsector(OlcinaandVera,2016).Sincethe1990s,notonlythetour-operatorsbutalsothehotelchainshavebeenimplementingaseriesofstrategiesandmeasureforadaptingtoclimatechangethatareyieldingspecificresultsofgreatinterest.Internationalhotelgroupsaredevisingtheirownenergyandwater consumption-reduction strategieswithin the framework of generalcompanycost-reductionpolicies,whichhaveinvolvedthemodernisationofelectricityandwaterfacilities.Theyhaveclearlyhadpositiveeffectsonre-ducinghotelconsumptionperpersonandstaywherethesetwoenviron-mentalvariablesareconcerned.Althoughthisfallswithinthecategoryofthecompanies’economicprofitability,thismustalsobegivenpositiveap-praisalbecauseoftheadaptationofhotelfacilities;thisisanexamplethatshouldbefollowedbysmallerhotelchainsorfamily-ownedestablishments,andmanyprivate tourismemployershavedone likewise in recent years.Basically,whattheyhavedoneistoacttoencourageenergyandwatersav-inginapartmentsand,aboveall,inhotelfacilities,andtheseactionshavespreadtothefacilitiesinthesmallerestablishmentsinmanytouristdesti-nations;thishashappenedontheCostaBrava,theCostaDorada,Mallor-ca,Benidorm,thecoastalareaofMurciaandtheCostadelSol.Inallthesecases,whatcamefirstwastheneedtosavewater,asfromthe1980s,andthiswasfollowedbytheneedtocutdownonelectricityconsumption,es-peciallyinthelastfifteenyears,inviewoftheincreaseinelectricityrates
3 SpanishFederationofMunicipalities&Provinces(2010)Climate change vulnerability on a local level.MinistryofEnvironmentandSpanishNetworkofCitiesforClimate,Madrid,310p.4 SpanishFederationofMunicipalities&Provinces (2012)Guide to the drafting of local reg-ulations to combat climate change,MinistryofEnvironmentandSpanishNetworkofCitiesforClimate, Madrid, 253 p.
111
Nº 8 / 2018
RESILIENCE IN THE URBAN WATER CYCLEMEDITERRANEANCLIMATE,AVERYCOMFORTABLECLIMATEBUTWITHEXTREMERAINFALL
Alicante,ahistoricalMediterraneanCity,witharapidlygrowingpopulationandincreasedurbandevelopmentinthesecondhalfofthe20th Century, is agoodexampleofabuilt-upareathathasfelttheeffectsoffloodinganddroughtthroughoutitshistory;theimpactshavebeenaggravatedinrecentdecadesbythecity’sincreasingvulnerabilityandexposuretotheseclimatehazards.Manycoursesofaction,bothstructuraland territorialplanning,havebeentakentolimittheconsequencesofthesespells.Sincethe1990s,andthankstotheactionstakenjointlyandinacoordinatedwaybythePu-blicAuthorities(regionalandlocal)andthecompanyHidraqua,apolicyofenvironmentalandterritorialsustainabilityhasbeenimplementedwhenitcomes to devising measures for minimising the effects of flooding anddrought.
ThisstudypresentsthelistofactivitiesimplementedintheCityofAlicantetoincreaseresiliencetofloodinganddroughtinrecentdecades.Itisanexcel-lentexamplenotonlyofaresponsibleadaptationtoclimatechangeandtheassociated extremeweather conditions, but alsoof thedecision to adoptenvironmentalandterritorialsustainabilitymeasureswhenitcomestofacinguptothechallengesinvolvedincomprehensiveurbanwatermanagementinthe21st Century.
2. MEDITERRANEAN CLIMATE, A VERY COMFORTABLE CLIMATE BUT WITH EXTREME RAINFALL
Theseenvironmentalconditionshavemadetheterritoryinhabitablesincetime immemorial and it has been home to a variety of societies and
112
Nº 8 / 2018
RESILIENCE IN THE URBAN WATER CYCLEMEDITERRANEANCLIMATE,AVERYCOMFORTABLECLIMATEBUTWITHEXTREMERAINFALL
economicactivities.Onlythegeneral lackofrainfallservedasalimitingfactor in the past, andmade it necessary to devise ingeniousways ofmakingthemostoftheavailablewaterresources.SuchwaterbehaviourhasepitomisedMediterraneancivilisationsuntilthepresenttime.
Asageneralrule,asthelandontheSpanishMediterraneanisfacinglee-wardof themoistflowscoming from theAtlantic, it receives less rainfallfromthesquallsthatenterfromthewestoftheIberianPeninsula.Bycon-trast,theatmosphericsituationsthatbringinwindsfromtheMediterraneanSeatowardsthelandonthePeninsula-andtheBalearics-aretheonesthatprovidethelargestvolumesofrainfallperyear.
TherainfallthatiscollectedannuallyontheSpanishMediterraneanCoastgraduallydecreasesfromNorthtoSouth,towardsthesouth-eastoftheIberian Peninsula (south of Alicante,most of theRegion ofMurcia andAlmeria),beforeincreasingagaininthelandsoftheTropicalCoastofGra-nadaandtheCostadelSolasfarasthefoothillsoftheStraitofGibraltar.However,therainfalldistributionshowsaclearassociationwiththepres-enceanddirectionofthereliefandwiththelayoutofthecoastline.
Apart from the quantity, in general not very abundant and unevenlyspreadthroughouttheyear,anothercharacteristicfeatureoftherainfallon theMediterraneanPeninsular façadewith thisclimate regime is theirregularity of the rain. Intra-annual irregularity, given that the largestquantitiesofrainfallintheequinoctialmonths(AutumnandSpring)andinterannual irregularity,wherenotvery rainyyears,whichare themostfrequent,alternatewithvery rainyyears (1989,2017).The latterkind isassociated with the development of atmospheric circulation variabilitysystems (North Atlantic Oscillation (NAO) and Western MediterraneanOscillation(WeMO)).
Thefactthatdryandwetyearsalternatehasamajoreffectonwaterplan-ninginthoseareas,becausetheplanninghastotakeintoaccounttheex-tremely irregular rainfallvariability inorder tobeabletocater for thede-mandatalltimes.Thataccountsforwhymanyareas,andespeciallyinthecitiesontheSpanishMediterraneanCoast,haveoptedforadiversificationinthewatersupplysourcestopreventpotentialsupplyproblemslinkedtotheunevennessoftherainfallfromoneyeartothenext.
Droughtsandperiodsof torrential rainareacharacteristic featureof theMediterraneanclimate.Theyaretheatmosphericextremesthatmostfre-quentlyalter theway thisclimate type functions. It isaverycomfortable
113
Nº 8 / 2018
RESILIENCE IN THE URBAN WATER CYCLEMEDITERRANEANCLIMATE,AVERYCOMFORTABLECLIMATEBUTWITHEXTREMERAINFALL
Source: AEMET. Ciudad Jardín Observatory. Alicante.
2.1. Droughts and water supplies
DroughsequencesareacharacteristicfeatureoftheMediterraneanclimate.Infact,thenormalsituationisonewheretheannualrainfallisbelowthe normal averagealong theSpanishMediterraneanCoast. TheSpanishMediterraneanCoastisaffectedbydroughsequencesthataffecttherestofSpain,theso-calledIberiandroughts,whichmeandropsintherainfalllevelsofmorethan40%inoneyear.Yetwithinthisperiod“genuine”droughtsoc-cur,inherenttothelandinthesouth-eastoftheIberianPeninsula,whichdonotaffecttherestofit.
Iberiandroughtsarecausedbythefrequencyofanticyclonesthroughouttheyear.Theseconditionsarenotconducivetorainfall,andtheamountofraindecreasesconsiderablywhencomparedtothenormalvalues.“South-east”droughts thatonlyaffect theterritoryconstitutingtheclimateregion in thesouth-eastoftheIberianPeninsula,exceptwhenthereisananticyclone,al-beit in a proportion of normal days, register many “west wind” days, i.e., when squalls and fronts pass, which after crossing the Iberian Peninsulareachthisendoftheterritorywithoutreleasingrain.
It is interestingtonotethat intheverydryyearsthatarerecorded intheSpanish Mediterranean area, especially in the south-east of the IberianPeninsula,therainfallvaluesrecordedinayeararemuchlowerthanthosethatareregistered,onaverage,incertainzonesintheSahelstripjustsouthoftheSaharaDesert.Thisjustgoestoshowhowseverethedryspellsare
114
Nº 8 / 2018
RESILIENCE IN THE URBAN WATER CYCLEMEDITERRANEANCLIMATE,AVERYCOMFORTABLECLIMATEBUTWITHEXTREMERAINFALL
Inthisgeographicalcontext,Alicanteregularlysuffersfromtherainfallef-fectsofperiodswithlittlerain(annualdroughtsandlongspellsofdrought)insuchawaythatsincethebeginningofthe20th Century, its water supply systemhashadtoadapttothesetypesofsituationsinordertopreventorminimisetheirimpact.
Aseriesofessentialactionshavebeentakentoguaranteethecitywatersupplyinthepast,andthesehaveinvariablybeenpromptedbylongspellsofdroughtintheprecedingyearsthatservedasincentivestofindefficientsolutionsthatwouldmeanthecitynolongerhadtodependonbenevolentclimatesituationstoensure ithadenoughwater; theseactionshave in-cluded using urban wells and sources, conveying water to Alicante from theAltoVinalopo,nottomentiontheconnectionthatwasmademidwaythroughthe20thCenturywiththeCanalesdeTaibillaAssociation,withoutforgetting thearrivalofwater via theTagus-SeguraTransferSystemor,morerecently,theincorporationonunconventionalwaterresourcescom-ing from water treatment and desalination. At present, it can be stated thatthewatersupplyfor theCityofAlicante isvirtuallyguaranteedandthecityhasceasedtobedependentuponanabsenceofdroughtsitua-tions.
• 1,121 mm in Casas del Barón (Valencia), 20th October 1982 (estimated). • 871mminJávea(Alicante),2nd October 1957.• 817 mm in Oliva (Valencia), 3rd November 1987. • 790 mm in La Pobla del Duc (Valencia), 4th November 1987.• 720 mm in Gandía (Valencia), 3rd November 1987.• 632 mm in Bicorp (Valencia), 20th October 1982.• 600 mm in Albuñol (Granada) and in Zurgena (Almeria), 19 th October 1973.• 536 mm in Escorca Son Torrella (Mallorca), 22nd October 1959.• 520 mm in Tavernes de Valldigna (Valencia), 11th September 1998.• 520 mm in Sumacarcer (Valencia), 4th November 1987.• 500 mm in Benifairó de Valldigna (Valencia), 11th September 1996.• 460 mm in Escorca Gorg Blau (Mallorca), 29th September 1940. • 450 mm in Alforja (Tarragona), 10th October 1994.• 430 mm in Cadaques (Girona), 14th October 1986.• 426 mm in Cofrentes and Jalance (Valencia), 20th October 1982.• 425 mm in Denia (Alicante), 3rd November 1987.• 416 mm in Alcalalí (Alicante), 12th October 2007.• 412 mm in Gallinera (Alicante), 7th May 1982.• 410 mm in Alginet (Valencia), 6th November 1983.• 409 mm in Cabo de San Antonio (Alicante), 1st October 1957.
Thereisonereallysurprisingrecordinvolvingmaximumdailyrainfallinthesouth-eastof the IberianPeninsula,which is the valueestimated for thefamousSantaTeresaFlood,whichoccurredonthenightof14to15Octo-ber1879,thehighestvalueforwhichahistoricrecordexistsintheSeguraBasin,affectingtheRiverVelez,oneofthemaintributariesoftheGuadalen-tin.Morethan600mmweremeasuredinonehour.Thehighest intensityeverregisteredinSpainwasrecordedinthetownofSueca(Valencia)inaperiodof2hoursand30minutes(296mm,23September2008).In20min-utes,theAutomaticHydrologicalInformationSystem(SAIH)stationintheValenciantownofManuel,recorded90.6mmon1August1993.Thegreat-est intensity ever to fall in just 1 minute in Spain was noted in Montserrat (Valencia) on 10 October 2008 (10.2 mm).
116
Nº 8 / 2018
RESILIENCE IN THE URBAN WATER CYCLEMEDITERRANEANCLIMATE,AVERYCOMFORTABLECLIMATEBUTWITHEXTREMERAINFALL
However,itisthehourlyvalues,inthestrictsense,aretherainfalldatathatbestcharacterisethenatureofprecipitationsinthisclimateregion.Thereisonereallysurprisingrecordinvolvingmaximumdailyrainfallinthesouth-eastoftheIberianPeninsula,whichisthevalueestimatedforthefamousSantaTeresaFlood,whichoccurredonthenightof14to15October1879,thehigh-estvalueforwhichahistoricrecordexistsintheSeguraBasin,affectingtheRiverVelez,oneofthemaintributariesoftheGuadalentin.Morethan600mmweremeasured inonehour.Thehighest intensityever registered inSpainwasrecordedinthetownofSueca(Valencia)inaperiodof2hoursand30minutes(296mm,23September2008).In20minutes,theAutomaticHydro-logical InformationSystem(SAIH)station in theValenciantownofManuel,recorded90.6mmon1August1993.Thegreatestintensityevertofallinjust1 minute in Spain was noted in Montserrat (Valencia) on 10 October 2008 (10.2 mm).
Source: AEMET. Ciudad Jardín Observatory (Alicante).
Thesearerainfallintensityvalues(dailyandhourly)thathavetobeknownfor thepurposeofcalculating thecities’urbandrainagenetworkoutflowcapacitiesontheMediterraneanCoast,andalthoughtheyappeartobere-allyhighandundoubtedlymakeurbandrainageworksmuchmorecostly,takingintoconsiderationsuchvaluesmeanssafeguardinghumanlifeandpreventing considerable economic losses where these urban zones areconcerned.
Source: AEMET. Climate forecasts for 21st Century.
2.3. Effects of climate change
FromthemomentthefirstClimateChangeReportpreparedbytheIntergovernmentalPanelonClimateChange(IPCC,1988)waspublishedun-til the present time, and after three decades of research into the climatechangeduetothegreenhouseeffecthypothesis,thereareaseriesofmani-festationsintheEarth’satmospherethatitisbecomingincreasinglydifficultto refute:
• The temperature increases thathavebeen recordedover the last threedecadescannotbeexplainedawaysolelybynaturalcauses(solarradia-tion).There isanother factor that isalteringthe“normal” functioningofthe energybalanceon theplanet, bybringing about an incentivisationof thermal longwave radiationpower,originatingon theEarth’ssurfaceandthesurfaceofthesea.It isnotreleasedintotheouteratmospherebecauseitisconfinedinthefirstfewkilometresoftheatmosphere.Thisphenomenon isassociatedwith thepresenceofprimarygasescomingfromhumaneconomicactivity (CO2,nitrousoxide,methane)andbeing
118
Nº 8 / 2018
RESILIENCE IN THE URBAN WATER CYCLEMEDITERRANEANCLIMATE,AVERYCOMFORTABLECLIMATEBUTWITHEXTREMERAINFALL
• Anatmospherethatlosesitsheatbalanceandbecomeshotterorcolderisanatmospherethatisexposedtomoreviolentenergyreadjustmentprocesses;i.e.,thetypesofweatherchangemorequicklyandintensely.Situationswithanextraordinaryrangeoccurmoreoften.Thisisparticu-larlyeasytoobserveinthemid-latitudesbecausethis isthedevelop-mentscenarioforthecoldairmassexpansionmovements(fromnorthto south) and the hot-airmass expansionmovements (from south tonorth).
• Since1980,thetemperatureshaveraisedmoreinmiddleandhighlati-tudes than in the intertropical latitudes, and especially in theNorthernHemisphere.Thishasbeenrecordednotonlybytheinstrumentrecordsfrom theobservatoriesbut alsoby the thermographsconductedusingsatellite data.
TheMediterraneanBasinisoneoftheareasintheworldwhereitisconsid-ered that climate condition changeswill bemost patent in the next fewdecades.Theriseintemperaturesandthedropinrainfallmakeitnecessaryto take adaptationmeasures to reduce the expected thermal discomfortand to reduce a reliance on conventional water resources, whichwouldbringaboutareductioninrainfall.Thestudyon“Climate forecasts for the 21st Century”(Aemet,2015),anupdatedontheforecastsmadein2011,hasutilisedthreevariables(maximumtemperature,minimumtemperatureandprecipitation)toanalysethewaytheSpanishclimatemodelforthecomingdecadeswillevolve.Theresultsservetobackupthedataincludedintheprevious reports issued by the State Agency and the Spanish ClimateChangeOffice.FortheIberianPeninsulaasawhole,theincreaseinmaxi-mumtemperaturesin2100isestimatedasrangingfrom1ºCto7ºCfordiffer-entgasemissionscenarios,forminimumtemperaturestheincreasewillbebetween 1ºC and 6ºC. Furthermore, the precipitationswill drop by be-tween4and8%whencomparedtotheaveragesfortheperiod1961-20002005,withanuncertaintymarginof10%.
OneaspectthatiscloselylinkedtorecentthermalperformanceandrainfallontheMediterraneanCoast,isthetemperatureoftheseawaterrecordedoff-shoreontheeasternpartoftheIberianPeninsula.IthasbeendemonstratedthattheWesternMediterraneanwatershavewarmedupinthehotmonthsoftheyear,prolongingtheperiodofhightemperatures(<25ºC)betweenJuneandSeptember. For theMediterraneanBasin as awhole, an absolute in-creaseof0.22ºChasbeenestimatedperdecade,from1973to2008(Skliriset al.2012). Furthermore, Miro Perez (2014) has p used the satellite date
RESILIENCE IN THE URBAN WATER CYCLEMEDITERRANEANCLIMATE,AVERYCOMFORTABLECLIMATEBUTWITHEXTREMERAINFALL
belongingtotheNOAA/NASAAVHRR OceansPathfinderdatabasetocalcu-latethethermalincreaseinthecoastalwatersneartheAutonomousRegionofValencia,fortheperiod1985-2007,estimatinganannualslopeperdecadethatshowsan increaseof0.26 ºC (See tablebelow).Themostsignificantaspect of his analysis is that thewarming upoccursmainly in the springmonthsandthebeginningofsummer(ApriltoJune)and,toalesserextent,October.ThispresenceofwarmerwatersalongtheSpanishMediterraneanCoastthroughouttheyearalsomeansanincreasingtheriskofseverestormsoccurringinthesummermonths,whereastowardstheendofthelastcen-tury, the riskof this typeofphenomenonoccurringwas limited to the latesummerorautumnmonths.
RESILIENCE IN THE URBAN WATER CYCLEMEDITERRANEANCLIMATE,AVERYCOMFORTABLECLIMATEBUTWITHEXTREMERAINFALL
annual rainfall distribution. By contrast, greater importance is attributed to theamountof rain that falls in theautumnmonths.This isasignofclimatechangeanditseffectsontherainfallthathavebeenoccurringontheMediterraneancoastofthePeninsulainrecentdecades;andthiswilltendertoincreaseinthenextfewdecades.
Rainfallmodelling in theAutonomousRegionofValencia indicatesasig-nificantdecreaseintherainfallinmostoftheterritoryandespeciallyinthesouthernmostparts.Nevertheless,afuturetrendisshowntowardsariseintherainfallinthegeographicalareasthatgenerallyreceivethehighestan-nualprecipitations(southerndistrictsintheProvinceofValenciaandnorth-erndistricts in theProvinceofAlicante).TheenclosedfigureshowshowprecipitationsareexpectedtodevelopintheValenciaterritory,until2100.
Allofthisbringstolighttheimportanceoftakingclimatemodellingintoac-countinterritorialplanningandthenaturalresourcesessentialfortherun-ningofacountry.Withina frameworkof thesustainableplanningofwaterresourceswhere interbasinwater transfer schemes are going to bemoredifficulttodevelop,it isgoingtobeincreasinglynecessarytoresorttotheuse of “unconventional waters” (treated, reused and desalinated) not merely asanoption,ifwearetoguaranteethewatersupplyinthetouristareasoftheSpanishMediterraneanCoastandthetwoarchipelagos.
123
Nº 8 / 2018
RESILIENCE IN THE URBAN WATER CYCLEMEDITERRANEANCLIMATE,AVERYCOMFORTABLECLIMATEBUTWITHEXTREMERAINFALL
Figure 6. HowrainfallhasevolvedintheAutonomousRegionofValencia.2100 time frame
TOTAL ANNUAL RAINFALL 1950-2009
TOTAL ANNUAL RAINFALL (PROJECTION 2071-2100)
PERCENTAGE CHANGE PROJECTION 2071-2100
(COMPARED TO 1950-2009)
Source: Miró and Olcina, 2016.
124
Nº 8 / 2018
RESILIENCE IN THE URBAN WATER CYCLEMEDITERRANEANCLIMATE,AVERYCOMFORTABLECLIMATEBUTWITHEXTREMERAINFALL
In summary,lossofregularityandclimatecomfort,togetherwithanincreaseinextremerainfallphenomena(droughtspells,intenseandtorrentialrainfallperiods)
Source: Own research.
2.4. Challenges for the urban water cycle
TheatmosphericextremesoftheMediterraneanclimateconstituteachallengefortheurbanwatercycle.Mediterraneancitiesmustbepreparedtowithstandmonthsoflimitedrainfall,whileatthesametimehavingtocopewithtorrentialrainthatcausesfloodingandwaterlogging.Whatisrequiredishydrologicalandterritorialplanning“forextremesituations”thatcanguaran-teewater inageographicalzonesubjectedtoperiodsofdroughtandwithmajorurbandemands for the resource.Thishas tobeachievedwithoutalossofhuman livesandconsiderableeconomic lossesasa resultofveryheavyrainfallinshortperiodsoftime.
Thetableshownbelowsummarisestheurbanplanningchallengesforwateron theMediterraneanCoast associatedwith thepresenceof hydrologicalextremesasacharacteristicinherenttotheprecipitationsthatoccurinthistype of climate.
– Diverse supply sources (traditional resources –surface and underground- and “unconventional resources”, water treatment and desalination)
– Networkefficiency(reducinglossestoaminimum)– Ongoing monitoring. Remote control– Alternative distribution networks for treated water– Opting for tertiary and quaternary treatment systems (collaboration withtheregionalbodiesresponsibleforwastewatertreatment)
todatebacktoatleasttheMuslimperiod,musthaveconsistedofele-mentary procedures for raising shallowwater. During the 17th and 18th Centuries,technologicalbreakthroughsmadeitpossibletopreparemi-nesandexcavateshaftsandtunnels,makingwaterwheelsandmillsanessentialpartofthehydrauliceconomy,theselastinguntilatleastbegin-ningofthe20th Century.
• Thegrowingdemandforresourcescoupledwiththerecurringperiodsofdrought,werewhatpromptedtheconstructionofmajorhydraulicworksattheendofthe19thCenturyandthebeginningofthe20thCentury.ThefirstoftheseworksconveyedwaterfromLaAlcoraya,anditcameintooperationin1881.Thewaterwasdeliveredfromdoortodoorbywatercarrierswhodeliveredtheresourceinpitcherscomingfromthefivesour-cesinstalledintheurbanarea.Thisfirstattemptwasfollowedbyanewandevenmoreambitiousandinnovativeproject,the48Kmlong“AlicanteCanal”,which in1898started to transportwater from theSaxartesianwells,locatedinAltoVinalopó.Theflowratewas10l/sec.,whichsharedoutamongtheinhabitantsatthetime,amountedto21.6litresperperson/day,aquantity thatwas farabove theamount thatwasreachingothercapitalcitiesatthattime.
TheSociedadGeneraldeAguasdeBarcelona,responsibleforsupplyingthecitysince1926,begantomakemajorinvestmentsinthethirddecadeofthelastcentury,whichledtoanincreaseinthevolumesofwaterthatcouldbeconveyed,anenlargementoftheurbannetwork,afurtherdeep-eningof thewellsand thedrawing-offofnewgroundwater resources,although this latter achievement did not occur until the 1960s. Thisbroughttoanendaperiodofurbanwatersupplyconsolidationandex-pansion,andtheservicewasmunicipalisedviatheSociedadAguasdeAlicante.
It was in this context that the Tagus-Segura Water Transfer Project firstemerged in 1967. Itwas scheduled to be completed at the same time asAguasdeAlicante’snewinfrastructureswerefinished.Thoseinfrastructures
127
Nº 8 / 2018
RESILIENCE IN THE URBAN WATER CYCLEWATERRESOURCES
revolvedaround twomaincoursesofaction: improving thesystems forconveying discharges from the Alto Vinalopó, by doubling the volumetransportedand replacing theoriginalCanaldelCid throughout itsma-sonrysection;thoseworksarestillfunctioningtoday,andenabletheop-eratorstotransferflowsatratesofupto2,000l/sec.;thesecondactivity,involveddiversifyingthegroundwaterdraw-offsandchannellingthemtoaquiferswherethewaterqualitywasbetterandtheresourcesweremoreplentiful.
Yetall theseefforts turnedout tobe insufficientandwater requirementswill continue to grow, according to future predictions, so new sources are currentlybeingsoughtfromdesalinatedresources.Theseincludethere-sourcesfromtheCanaldeAlicanteIandII,managedbytheMCT,withanominal production of 50,000 and 65,000 m3/day, respectively, of desali-natedwaterforhumanconsumption,andtherecentcommissioningoftheMarinaBajaDesalinationPlant,inMutxamel,managedbyACUAMED,withamaximumratedcapacityof18,000m3/day,atitsfirstphase.
Figure 7. EvolutionofWaterResourcesfromdesalinationintheCanalesdelTaibilla Association supply system, from 2003 to 2015
Evolution of water resources from desalination, aviable in the CTA (m3)
Alicante I Alicante II S. Pedro I S. Pedro II Valdelentisco
Thistypeofunconventionalresourcehasnotappearedonalargescale.Ithasbeengraduallyintroduced,startingwiththeareaaroundAlicante,withtheavailabilityof5hm3in2003,comingfromthefirstproductionlineof the Aguamarga Desalination facility in Alicante. The increase in the
128
Nº 8 / 2018
RESILIENCE IN THE URBAN WATER CYCLEWATERRESOURCES
quantitieswasgraduallyphased inuntil theamountsreached28hm3 in 2009,withtheaidoftwoproductionlinesfromtheAguamargaDesalina-tionPlantinAlicante,withaminimumofaround4hm3bothin2013and2014.
3.2. Supply Guarantees
3.2.1. Evolution and Combination of Supply Sources
Waterresourcemanagementinthearidandsemi-aridMediterrane-anregionslikeAlicante,isacomplextaskinvolvingalargenumberofhydro-logical, environmental and management factors that must be consideredwhenprovidingasupplythatcanguaranteeandcombineminimumqualityoflivelevelswhilealsoprotectingtheenvironment.
• Surface:comingfromtheCanalesdelTaibillaAssociation,andthus,with-outpowerformanagingitsoperation,onlyhavingcontroloverdistribu-tion.Onebasiccharacteristicofthistypeofresourceisthattheresourcesaremorepredominantthanthereserves.Theoriginofthesekindsofre-sourceshasdiversifiedinrecentyears,andnowalargeproportionofthewater comes from desalination processes.
Thissysteminvolvingthecombineduseofsurfacewaterandgroundwater,whereeventheoriginshavebeendiversifiedtoamaximum(whetherre-gardingpotentialsourcesofresources,inthecaseofsurfacewater,ortheuse of different GroundwaterMasses, in the case of groundwater), hasenabled planners not only to establish the rules for providing thewater
129
Nº 8 / 2018
RESILIENCE IN THE URBAN WATER CYCLEWATERRESOURCES
supplyandforprovidingsufficientguaranteesforthatsupply—whicharesonecessaryforagrowingsupplyasisthecasewithAlicanteandthesur-roundingtowns—butalsotoguaranteethattheinhabitantshaveanunin-terruptedwatersupply,eveninperiodsthatareparticularlydifficult,suchas thepresent time,utilising for thispurposenotonly theresourcesbutalso the groundwater reserves, conserved during periods of lower de-mand.
InAlicante,efficientmanagementisunderstoodasmeaningallthetasks aimed at preventing the resources from entering the drinkingwaternetwork,whileat thesametimeensuring that thesubscribers’andstake-holders’rightsareguaranteedwherewaterdischarge,pressureandqualityare concerned.
Furthermore, water-saving is a requirement in the Alicante conurbation,which is characterised by the absence of natural water resources (rivers,lakes,aquifersorsnow-caps)andperiodsofexceptionallyhighrainfallevery15-20years,ashasbeenexplainedabove.
DiagramsareusedbelowtoillustratethetechnicalandcommercialactivitiesaimedatreducingNRW,classifiedintoobjectives(foramoredetailedbreak-down, refer to Álvarez et al., 2014).
Anexhaustivedescriptionoftheactionsconsidereddoesnotfallwithinthescopeofthiscommunication,butabriefaccountisgivenofthosethatmightbe of greatest interest.
Network sectorisation. Control over minimum night consumptionTheAlicantedistributionnetworkiscurrentlycontrolledbymeansof67hy-draulicsectorsthatmakeitpossibletomonitortheflowssuppliedtoeachzone.Thelimitedlengthofthesesectors(justover8kilometresofnetworkpersector,onaverage)andtheuseofhighly-developedanalysisalgorithmstoanalyse theminimumnightflow,make itpossible todetect leaksatanearly stage. It has sometimes been possible to diagnose and detect dis-chargeleaksassmallas500litresinonehour.
Active control over network losses: prioritising the search for leaksConductingpreventive inspectionsof thedistributionnetwork,optimising thefrequencyforeachsector.Theseinspectionsareprogrammedwiththeaidofthe“PRIFU”computingtoolappliedtopreventivesearchthroughoutthenetwork.
Infrastructure management: Automation improvementsOngoing network monitoring, using 114 remote control stations and 156 da-ta-loggers.Tobespecific,150levels,32continuouschlorineanalysers,234meters and 185 pressures are supervised.
Infrastructure management. Double network of reused urban water (DRUR – Acronym in Spanish)SubsequentchapterswillexplainthedevelopmentoftheDRURandhow,injustafewyears,ithasbroughtaboutachangeinconsumptionpatternsinpublic and private parks and gardens.
131
Nº 8 / 2018
RESILIENCE IN THE URBAN WATER CYCLEWATERRESOURCES
Sub-metering reductionRenovationandupdatingthestockofmeters,onthebasisofaverage-age,volume measured and return-on-investment criteria. An average of 25,382 meterswerereplacedbetween2012and2016,themaximumbeingreachedin2015,when27,077meterswerereplaced.
Improving meter readingImplementationremotereadingonthefixednetwork,via long-rangeradio,plannedfortheentirestockofmeters.By2017,thishadbeenimplementedin60%ofthetotalnumberofmeters.
Customer management: readings and commercial informationSystematicreadingforallcustomers, implementingremotereadingashasalready been explained, constantly updating the commercial information,morethan185,291enquiriesdealtwithonthefree-of-charge900customercare line, etc.
Customer management: awareness of efficient useBetween 2007 and 2016 over 30,500 students received awareness pro-grammesaimedatschools,furthereducationcentresanduniversities.Onegoodindicatorofthisawarenessisareductioninthenumberoflitrescon-sumedperdayandcontract(i.e.,ateachsupplypoint)explainedbelow.
Technical-hydraulic performance TheactionstakenwithaviewtoreducingNRWlevels,asexplained,consti-tutethebasisforachievingbettervaluesforthetwomainefficiencyindica-tors (Álvarez et al., 2014): technical-hydraulic performance and economicloss level.
132
Nº 8 / 2018
RESILIENCE IN THE URBAN WATER CYCLEWATERRESOURCES
Tobespecific, thevalueofwatersupplied to thesystemover thepast25yearsinAlicantehasremainedrelativelystable.
Figure 10. Evolutionforthewatersupplied1991-2016
0 5
10 15 20 25 30 35
1991
1992
1993
1994
1995
1996
1997
1998
1999
2000
2001
2002
2003
2004
2005
2006
2007
2008
2009
2010
2011
2012
2013
2014
2015
2016
Supply (Hm3)
Apartfromthecausesthathaveadirecteffectonreducingwaterconsumptionper capita,suchaschangesinconsumptionhabitsandtheincreasedefficiencyofelectricalappliances(cf.CarmenAlbiol&FranciscoAngulo,AquaePapers#6, La reducción del consumo de agua en España: Causas y tendencias (The re-duction of water consumption in Spain: causes and trends)), special importance mustbeattachedtocorrectmanagementpolicieswhereAlicanteisconcerned(meter replacement, remote reading, modernising the distribution networks,etc.),becausesuchpoliciesmade itpossible tokeep the technical-hydraulicperformanceat around90% in theCityofAlicantebetween2010and2015.
Average age of the meters (years) & percentage of meters > 10 years vs. Performance (%)Performance (%)
95
100
90
85
80
75
70
65
60 6 7 8 9 10 11 12 13 14
Average age (years)
10.71%
41.84%42.36%
38.32%
51.74%
45.78%
58.55%
56.57%
134
Nº 8 / 2018
RESILIENCE IN THE URBAN WATER CYCLEWATERRESOURCES
Economic loss levelItshouldgowithoutsayingthatdistributionnetworksareconcealedstruc-tures,whichmakes themdifficult todiagnose.Yet this very factmeansthatitisnecessary,totheextentthatthisispossible,toanticipatefaultsandfailures,ratherthanmerelyreactingtothemwhentheyhaveoccurred.Suchanticipationcanonlybeachievedbyreplacementattherighttime.Thehighcostandeffectofnetworkreplacement,togetherwiththevitalimportanceofmaintainingthestructuresintheverybestpossiblestateofrepair to minimise leakage and bursts, makes it essential to use optimisa-tionapplicationsthatcanvalidatedecisionsinthisarea.TheMetrawatoolforprioritisingnetworkreplacementwasespeciallydevelopedwiththisinmind.
Thismulti-criteriacomputingtool(envisagingbothtechnicalandeconomicfactors) establisheswhich network sections ought to be replaced in theshort-,medium-and long-termonthebasisofthe investmentsavailable.Thetoolthusappliesexpertcriteriasystematically,withoutsubjectivebias,data omission, etc.; this solution,which is periodically calibrated on thebasisofactualresults,alsosimulatesthewayperformancewillevolveintheeventofdifferentamountsbeingallocatedtotherenovationprocess.
Oneofthekeyfactorsforunderstandingtheefficientuseofresourc-es in the caseofAlicante in particular, and theMediterranean context, ingeneral, is the reuse of treated and regeneratedwater. This factor iswellworthaspecialsectioninthisstudybecauseofitscurrentimportanceandfuture potential.
3.3.1. Developing the double network of reused water
WaterreuseinAlicantedatesbackto1995,whenitwasfirstputintopractice at theBonalbaGolfCourse, after the latter requested the
135
Nº 8 / 2018
RESILIENCE IN THE URBAN WATER CYCLEWATERRESOURCES
concession of reusedwater for thewatering of its facilities. Reuse be-camearealitythefollowingyear,whenEMARASAcommissionedthefirsttertiarywatertreatmentplantinAlicante,withacapacityof2,500m3 per day.
Figure 14. Double Urban Network of reused water in Alicante
KEYTransport network
Green zones sipplied with Regenerated
Existing
Planned
Private distribution network
Current
Planned
Fromthatmomenton,urbanreuseofwaterhasmadesteadyprogress,both in volume and in infrastructures, but 2003was amilestone year,when the Alicante Wastewater Re-use Master Plan received the go-ahead.ThisdocumentwasthedecisivefactorthatmadethecityoptforRe-useasthestructuralsolutionfornon-drinkingwater,viathefollowingpoints:
• Pinpointingthecurrentandfutureurbanwateringzones.• Quantifyingthevolumesofwaterrequiredinsuccessivestages.• Definingthetreatment,distributionandwateringstructuresneeded.• Devising a special investment plan to be carried out.
Thefirstoneshowshow theconsumptionof regeneratedwater forurbanusesevolvedbetween2002and2015,whereas the secondone indicateshowgreenspacesevolvedperinhabitantduringthatsameperiod.
3.3.2. Impact of regenerated water on the urban environment
The importance of the last indicator has been endorsedbymanystudiesthatshowhownecessarygreenspacesareforcitizens’physicalandmentalhealth.The fact that theWHOhasexplicitly included itamong theIndicatorsforHealthinSustainableCities,withanobjectivevalueof10m2/inhabitantendorsesthis.TheWHOReport“UrbanGreenSpacesandHealth,2016”reviewsallthescientificevidencethatassociatesthesepositiveeffectsonhealthimprovementwiththepresenceofparksandgardens.Thebenefitsfoundincludethefactthatgreenzoneshaveapositiveeffectontheimmu-nitysystem,obesity,sleep,cognitivecapacities,thecardiovascularsystem,lifeexpectancyandeventhecriminalityindex.
The“heatisland”effectisawell-knownphenomenonwherebycitytempera-turesriseowingtothegreatabsorptionsurfaceinbuilt-upareas.Thiseffecthasaspecialimpactontheminimumtemperatures(night-time),raisingthembymorethan2ºC.Thesignificanceofthiseffectbecomesclearifweremem-ber thatoneof theconsequencesofclimatechange is the lossofclimatecomfortintheMediterraneanzonethatleads,amongstotherthings,tothe
137
Nº 8 / 2018
RESILIENCE IN THE URBAN WATER CYCLEWATERRESOURCES
so-called“tropicalnightphenomenon”withminimumtemperaturesofover20ºC.Therefore,specialimportancemustbeattachedtothemeasuresthatcanreducethis“island”effectinthecontextofatmospherewarming;oneofthemosteffectivewaysofmitigatingthisisbyincreasingthenumberofgreenzones in urban areas.
Image 2.Urbaneffectofthe“heatisland”.Impactofthegreenzonesonmitigating it
Source: R. Connolly, and M. Connolly (2014). Urbanization bias I. Is it a negligible problem for global temperature estimates?
ThatiswhythewayAlicantehasevolved—frombeingacitywithlittlevege-tationandassociatedwithapermanentlackofwaterresources,toitscurrentbalancedstate—isparticularlyimportant.Itmustnotbeforgottenthatinthisperiod, the urban population grew by 42,000 inhabitants; it is difficult to
Significantinvestmentisrequiredtoimplementtheinfrastructuresneededtodistributethewaterregeneratedinaconsolidatedurbanenviron-ment:itisaninfrastructuretobedevelopedfromscratchwhosecostmustbecompetitive.Therefore,areductionistapplicationoftheprincipleofcostrecoveryestablishedintheFrameworkWaterDirectivecouldmaketheso-lution unviable, by applying unbearable costs on a resource rendering its utilisationunprofitable.
Atthispointitisnecessarytoopenuptheperspectiveandrememberthattheurbanwatercycleisanongoingandintegratedprocess,inwhichre-generationformsanessentialstep.Ifthereisanydoubtinthisrespect,allonehastodoistoputthequestiontheotherwayaround,asP.RougéandF.Hernándezdidin2016:Whatisthecostofnotregenerating?Inacon-textofwater-resourceshortage,theanswercomesbackimmediately:notreusingwaterwillhavethenegativeimpactofreducingtheavailabilityoftheresourcesallocatedtodrinking(andagricultural)consumption,caus-ing theircost to rise.Otherwise, investment in regenerated-water in-frastructures is an investment that will ensure the guarantee of a supply of drinking water and keeping down its cost. As Joaquin Melgar-ejo pointed out (See for example, Purification and reuse de waters in Spain, 2016), if reuse is to be encouraged, “it is essential to establish a price policy that divides up the cost of regeneration and the cost of waste-water management among all the consumptions, establishing initiatives to make sure that regenerated water is utilised in all sectors, whenever this is possible”.
The argument is backed upwhenwe compare the investment and theoperatingcostsrequiredbythereuseinfrastructures,tothosegivenovertopurificationandpotabilizationtreatment.Inthissense,wemustrefertotheworkcarriedoutbyP.Rougé&F.Hernández(seeattachedtable).
Source: Philippe Rouge & Francesc Hernandez (2016). “The cost of not regenerating”.
Wecansummarisethesefiguresbystatingthattherespectiveinvestmentcostandoperatingcostofreusetreatment,amounttolessthanonetenthofthecostoftherestoftheproceduresinthecycle(potabilizationandpu-rification).Otherpointsofcomparisonthathavebeenstudiedbythesameauthors reveal how investment in tertiary treatment for regeneration ac-count forapproximatelyonefifthofwhat isrequiredforstorageor (moresignificantly)fordeployingjust10Kmofthewaterhighleveltransportnet-work.
Wecouldalsoaddenvironmentalfactorstotheabove-mentionedconsidera-tions: energy consumption and, thus, the carbon footprint involved in the
Furthermore,accordingtotherecentstudyentitled“Reutilización de aguas regeneradas: aproximación a los costes de producción y valoración de su uso (Reuse of regenerated water: approximation of the production cost and valuing their use)”(AlbertodelVillar-Garcia,2016),whichestimatestheeco-nomic value of reused water produced in Spain at around 2,165 million Euros peryear,theinvestmentreturnonthistypeofresourceismorethanpositiveenough,witharatioofmorethan1to3.
Inaddition,asthesameauthorhasremindedus, thereareotherevalua-tionsassociatedwiththereuseprocessaddedtothevalueoftheresourcethatwecanmeasureineconomicterms,suchasnothavingtodumpor-ganicloadsintotheenvironment.Ifoneassumesthatthetreatmentisbet-terthanthatrequiredbytheregulationsfordumpingwasteintheenviron-ment(secondarytreatment),acertainpollutionloadisdealtwiththatwouldotherwiseendupinthereceivingmedium;inthecaseofAlicante,theMed-iterraneanSea.According toVillar-Garcia’s estimate, “in absolute terms, tertiary treatment and subsequent reuse saves on dumping about 1,450 tonnes of nitrogen, 290 tonnes of phosphorus and 4,500 tonnes of DBO5 into the environment”.
The financing structure adopted inAlicante canbe summarised in a rela-tively simpleway,which isconsistentwith thecomprehensiveviewof thewatercycledescribedintheprecedingsection,i.e.investmentinreuseinfra-structuresissupportedjointlybyboththedrinkingwaterandreusedwatercharges,whereastheoperatingcost(treatment,energy,maintenance,etc.)isonlyincludedonthelatter.Theaveragepriceofrecycledwaterasaresultofthissystem6is0.35€,whichisapproximatelyonefifthofthedrinkingwaterprice, so the objective of encouraging the utilisation of the alternative re-sourceissuccessfullyachieved.
Image 3. Palmeral Park, Alicante
Furthermore,wemustnotfailtomentiontheimportanceofasuitabletech-nicalandtechnologicaldevelopmentwhenimplementingreuse;thepossi-ble consideration of secondaryusessuchaswateringgardensorcleaningthestreetscouldcauseustomistakenlyintoaninsufficientlevelofrequire-ment.Inthissense,itmustnotbeforgottenthatSpanishLaw(RoyalDe-cree 1620/2007) establishes certain requirements that at times (see the
6 In January 2018.
142
Nº 8 / 2018
RESILIENCE IN THE URBAN WATER CYCLEURBAN DRAINAGE
questionofturbidity)aremoredemandingthanthosedefinedfordrinkingwater.However,theonusisonthemanagertoestablishthecontrolsandstrategiesthatmakeitpossibletoguaranteethoselevels.WhereAlicanteisconcerned, developing and applying technological solutions has alwaysbeenconstant,andincludesprotectionsystemsintheserviceconnectionstopreventanycontactbetweenthedrinkingwaterpipelinesandtheregen-eratedwaterpipelinesandestablishingspecificinstallationstandards,nottomentionoxygenationofthestoragefacilitiesandremotecontrolofthenetworks.
Finally,thedescriptionoftheAlicanteexperiencewouldnotbecompletewithoutmentioningtheoutstandingpublicandinstitutionalsupportgiventoalltheinitiativesassociatedwithreuseinthecity.So,itmustbestressedthat the public representatives gave their unanimous backing to all thedecisionsthathavemadeitpossibletoimplementregeneratedwaterforurbanuses,totheextentthatithasneverbeenacauseforpoliticalcon-troversy.Positiveacceptancebyall the inhabitantsofAlicantehasalsobeen important, to such an extent that today the citizenswould find itunconceivabletodeploydrinkingwaterforwateringthecity’sparksandgardens.
4. URBAN DRAINAGE
Thequalityoftheresourceinthecity,thefactthatitslayoutismoreorlessconsistentwiththephysicalsupportonwhichitislaid,mustcon-sider,amongstotherquestions,theriskofnaturalphenomenawithextraor-dinaryconsequences,togetherwiththepossibilityofpreventingthosecon-sequences.Structuralmeasureshavebeenthesolutionsmost frequentlyadopted to improve urban drainage conditions and prevent rainwater from damaging urban zones. In Spain, and especially in its Mediterranean coast-alareas.Thisbecameclearas from thesecondhalfof the19th Century, whenmodernurbansprawlincitiesmadeitnecessarytodeviseengineer-ingactivitiesaimedatpreventingsurfacerunofffromflowingthroughthestreets and causing a negative impact. Furthermore, territorial planningprocesseshavenottakenintoaccountthenaturalriskaspectuntilrecently.Itwasonlyin2008,aftertheStatepassedtheLandAct(modifiedin2015),thatitbecamemandatorytodrawupnaturalriskmapsthathadtobecon-sidered for urban and territorial planning. However, some Autonomous Re-gionsdidprepare regulationsandplanssomeyearsbefore2008,withaview to reducing flood risks through territorial planning.On the SpanishMediterraneanCoast,thisappliedtotheAutonomousRegionsofValencia,Catalonia,AndalusiaandtheBalearics.
143
Nº 8 / 2018
RESILIENCE IN THE URBAN WATER CYCLEURBAN DRAINAGE
Itmustbepointedout that incity, therisks involved inextremerainfallcan only be reduced by intelligently combining actions of a structural naturewithterritorialplanningmeasures.Theformersolvethedrainageproblemsthatalreadyexistincitiesandthatappearwhenthereisaspellofveryheavyrain,whereasthelatterpreparethelandforthefuturebypreventing the unwanted consequences of torrential rain in high-riskzones.Allofthishastobeaccompaniedbyprovidingtherequiredinfor-mationandbyeducatingcitizensabout thehazards inhigh-riskurbanareas.
In the City of Alicante, there is a high risk of flooding caused by highhourlyrainfallintensities.Thisisoneofthesignificantgeographicalrisksthathavecharacteriseditsurbandevelopmentfromthedimanddistantpastrightuptothepresenttime.Someofthedistrictshavesufferedfromserious problems as a result of flash floods in the urban gullies,whichhavecausedconsiderableeconomicdamageandlossoflife.Withoutfor-gettingcertainpasteventsthatdeserveamentioninthecity’schronicles(Nicasio Camilo Jover, 1863; Viravens, 1876), the extensive list of suchevents throughout the 20th Century shows just how exposed the urbansection is toflooding inaseriesofwatercourses (gullies,dry riverbeds)thathavecometo formpartof thecity’sstreets.Theurbangrowthhassometimesfailedtotakeintoaccountthedryriverbedsthatdescendfromthehillsdottedaroundthecitylimits(Tossal,Benacantil,Garbinet,Orge-gia,SanJulianandFontcalent)orgullies thatflowdownto theAlicanteCoastdrainingthePrebeticreliefthatsurroundstheCampo de Alicante (Juncaret,Ovejas andAguaAmargaGullies). The urban sectors ofSanGabriel,Sangueta,thecentralareaaroundtheRambladeMéndezNúñez,ÓscarEsplá,SanAgustín,themouthoftheMaldoGullyinLaAlbuferetaareallzonesthathavebeenregularlyaffectedbyfloodinginrecentyears.ThesameappliestotheSanJuanBeach,whichemergedfromtheformermarshland and was submerged, recovering its former natural function,whenveryheavyrainfalls.
4.1. Background. Urban evolution of Alicante: a process of gradual “absorption” of gullies in its urban section
Theway the city of Alicante evolved could be understood as aseriesofadaptationstothelayoutoftheriversthatflowacrossthecoun-trysideinAlicante.Fivemaingullies(Canicia,Bonhivern,SanAgustín-SanBlas,OvejasandAguaAmarga)weresuccessivelyabsorbedbytheurbansprawl, increasingtheriskofflooding in thezones lying in theircourse.TheOrgegiaandJuncaretGulliesinthenorthernpartofthemunicipality
144
Nº 8 / 2018
RESILIENCE IN THE URBAN WATER CYCLEURBAN DRAINAGE
andtheprecarioussub-drainagearea(endorreism)oftheSanJuanBeachcan be added to them. Alicante’s population’s exposure to the naturalphenomenonof flooding has increased as the landoccupation has ex-panded.
EversincetheCityofAlicantewasfoundedbytheArabsinitscurrentposi-tiononthesidesofMountBenacantil,therehasbeenamajorbuilt-upareaintheCaniciaGully,whichconstitutedanaturalbarriertogrowth.Thiswater-course,whosesourceliesclosetotheridgesoftheVirgendelRemediorunsdowntowardsthesouthernfoothillsofMountBenacantil,beforeflowingintothecoastline.Thefirst“absorption”ofagullybyAlicante’surbansprawltookplace inthe16thCentury. Infact, twopoorquarterssprangupoutsidethewalls in thatcentury:SanAntonandSanFrancisco.Developments in thatzonemeantthattheCaniciaGullyhadthenbecomepartofAlicante,althoughitwasnotuntil the19thCentury that theoriginal ravineactuallybecameastreet.
A new outlying district, Arrabal Roig, was developed in the 18th Century, whichmarkedthebeginningoftheurbansprawlgraduallyspreadingintoanewriverbed,theBonhivernorLaGotetaGully,whosesourcelayclosetotheridgesoftheGarbinet,randownthenorthernslopesoftheSerraGrossa–initssouthernsection-andoriginallyflowedintotheseaclosetothePostiguetBeach.
TwomajoreventsmarkedthegrowthofthetownofAlicanteinthesecondhalfofthe19thCentury,whereabsorbinggulliesintotheurbansprawlwasconcerned: approval given to the peripheral housing development (En-sanche)projectandtheconstructionoftheBenalúahygienistdistrict.Thefirstof theseamounted toaconsolidationof theAlicantestreetsystemthatwouldcontinuetogrowthroughoutthe20thCentury.Thisfinallycom-pletednotonly the incorporationof theCaniciaGully and the seriesofsmalldryriverbedsthatrundowninanorth-to-southdirection,fromtheElTossaldeSanFernandohillandcrossaseriesofstreetsformingpartoftheEnsancheitself,butalsothedryriverbedsthat,runningfromeasttowest,aretributariesoftheCaniciaGully,flowingintoitsrightbank.TheconstructionoftheBenalúadistrictinthesecondhalfofthe19th Century, meantthatanewgullywasabsorbedbytheurbansprawl,SanAgustín-San Blas.
145
Nº 8 / 2018
RESILIENCE IN THE URBAN WATER CYCLEURBAN DRAINAGE
Figure 16. MapshowinghowtheCityofAlicanteevolvedupuntilthe18th Century
Thesecondhalfofthe20thCenturysawtheoccupationofthecentralstretchalong thebanksof theOvejasGully (LlanodelEspartal IndustrialEstate)andthelowerstretch(SanGabrieldistrict),aswellasthecompleteabsorp-tionof theSanAgustín-SanBlasGully,with theconstructionof theSanBlasIndustrialEstate,themainstreetontheEstate(Avda.delDoctorRico)runningthroughthatgully.Atthattime,thewesternsectoroftheEnsanche wasalsoconsolidatedaroundÓscarEspláAvenue, rightby theBenalúaGullyriverbed.Further“absorptions”ofgulliesorprecarioussub-drainageareastookplaceandcametoformpartoftheurbansprawl.TheAguaAm-argaGullyonthesouthernfringesofthemunicipalitywasincorporatedintothecityasaresultoftheconstructionoftheLasAtalayasIndustrialEstateandthenationalhighwayspannedtheriverbedrunningacrossabridgethatwasnothighenough.TheJuncaretGully as it flowedpast thevillageof
CityWalls
Sources: A. Ramos, J.M. Davila, J.M. Mira
MuslimMedieval18th Century
Present DayMuslim EraMiddle Ages16th CenturyPoorareasinthe16th Century18th and 19th CenturiesMidwaythroughthe19th Century
Urban development
Main buildings and monuments
CityWallGatesCityWallGates
GATES:1. Ferrisa2. Portal Nou3. Del Mar4.PortaldeElche5. De la Huerta6. De la Reina7. De San Francisco8. De Babel9. Nueva Puerta del MarA. San Carlos FortressB. Santa Barbara Platform
BUILDINGS AND MONUMENTS1. Santa Barbara Castle2.ChurchofSantaMaria3.SanNicolasCo-Cathedral4. Town Hall 5.King’sPalace(PostOffice)6. La Asegurada Museum7. Gravina Palace Museum8.LlorcaPalace(MunicipalArchives)9.Theatre
Therefore, the layoutof theCityofAlicante isanexampleofhow thecitygraduallybecamemoreexposedtotheriskoffloodingasitbecamemorefirmlyestablished.Andallofthiswashappeninginacitywherethepracticeof building and occupying land took precedence not only over carefully plan-ningusesandspaces,butalsotookprecedenceovergivingthoughttothegeological featuresthatconditionthefutureofanarea.ThiswascommonpracticeinmanycitiesalongtheSpanishMediterraneanCoastthroughoutthesecondhalfofthe20thCentury.Theneedforlandandthedemandforhousingmadeitnecessarytohastilygrantplanningpermissioninawaythatwasincompatiblewiththerationaloccupationoftheland.Allofthiscreatedriskareasinanurbanenvironment,makingthesocietieslivingthereextreme-ly vulnerable.
4.2. Origins and development of the Alicante drainage network
Ashasalreadybeenexplained,theCityofAlicantehasgrownfromthehillsidesofMountBenacantildowntothelowerelevations.Everytimeitspread,itswallowedupthevariousgulliesthatactedasnaturalboundariesto development: Mina, Carmen-San Rafael, Canicia, San Agustín-San Blas, Ovejas, Agua Amarga, Orgegia, Juncaret, etc. (Marquiegui, 2012 and Olcina, 2004).
4.2.1. First historic activities taken on the drainage
TheactivitiescarriedouttodivertthewatersoftheCaniciaGullywere thefirstmajorurbandrainageworks tobeperformed in theCityofAlicante.Theywereundertakenattheendofthe18thCentury,afterthepe-riodoftorrentialrainon7November1791.ThedamagecausedtowhatisnowthePlazadeChapi,theconventoftheCapuchinnunsandthecom-mercialstoresinCalledelBarranquet,ledtotheconstructionofaditchtodrainawayfloodwaters.Thetotalcostoftheworkscameto58,056reales de vellon(RamosHidalgo,1984).Whenthenewcitywallswereconstructedfor thecity in18thCentury, theworks includeddiggingaditchthatcouldlater be used as an evacuation system for dirty water.
ThankstothetwodrawingsbyManuelMiralles(sic.ManuelMirallas)enti-tled“PlanofAlicanteandsurroundings”and“IchnographicgeometricplanoftheCityofAlicantewharf”,itisknownthattherewereatleasttwopipingsystemsforthesanitationnetwork,whosecontentsflowedintotheseatothewestof theoriginalwharf,and twomorepipingsystemsthatpouredsewage intotheseatotheeastofthatwharf; the latterdrawingshowsaprojectthatwasnevercarriedout,andbothdrawingsdatebacktoaround1794 (Aguilar, 2012).
Anotherapproach to thedevelopmentof thesanitationnetwork involvedreviewingincomeandexpenditurein1797,indicatedbyJover,wherethereisnoitemsetasideforsewerage,althoughthereisaminimumallocationforWorksandConservation.JoveralsomakesreferencetothebudgetfortheLaMinacollectorin1787,aswellastheseweragebudgetsforthefollow-ing streets: Calles Mayor, San Francisco, Blasco (now Pascual Blasco),
148
Nº 8 / 2018
RESILIENCE IN THE URBAN WATER CYCLEURBAN DRAINAGE
Castaños,BailenandSanFernandoin1859-1863.Whenreferringtotheseworksmidwaythroughthe19th Century, Jover states: “… thought was given to perfecting the sewer system and other underground works, because they had been neglected in the past”.
4.2.2. The growth of the Port of Alicante and its impact on urban drainage
BecomingtheheadquartersoftheConsulateoftheSeain1785andcap-italof theprovince in1822,plus thearrivalof the railwayconnection toMadridin1858,allhelpedtoboosttradeandeventuallyledtothelong-awaitedportenlargementplans,with theconstructionof thenewPoni-entewharf that completedAlicante’s dock facilities.However, the con-structionofthatwharf,completedin1873,wastoprovetobethecity’sgreatestsanitationproblemfor40year,togetherwiththedepleteddrink-ing-watersupplyandthecrowdedandunhealthyhousingforworkers(Sa-lort, 2005).
That “immense black hole”, as itwas referred to in theprojectmentionedbelow,wascompletedafterthe“WorksProjectforSanitationofthePortofAlicanteanditmaritimezone”wasperformedin1905bythePortEngineerRamónMontagutaftertheendoftheworkscertificatewasreceivedbyAli-cante County Council on 31 August 1914 (Salort, 2005).
4.2.3. The Architect José Guardiola’s Plan
Duringthe19th and 20thcenturies,inthemiddleoftheHygienismPeriod,thearchitectGuardiolaPicóconsideredinhiswork“Reformas en Alicante para el siglo XX (Remodelling Alicante for the 20th Century)”, a series of ideas for creatingacitywithaview topreventingoneof itsproblems: the lackofdrainagenetworks.Guardiolahimselfpointedoutthat“the main cause of our problems lies in the poor state of the riverbeds”. Hedefendedtheneedtoprovidethecitywithanetworkofsewersthatwouldputanendtotheproliferationofcesspits,whileatthesametimeactingasadrainagenet-worktopreventfloodinginthelowerareasofthecity.AccordingtoGuar-diola,thecauseofthisproblemwasclear:becauseofitslocationclosetotheseaandtheslopesassociatedwithaseriesofhillsthatsurroundedtheurban sprawl (San Julian, Benacantil and Tossal), Alicante was in a good position to drain away waters.
theproblemsthat,accordingtotheauthor,hadtroubledthecityinthelastdecadeofthepreviouscentury:“the huge flood that reached the Capuchins Convent, even though it was at a considerable altitude, and that did so much damage to the lower zone”.
Image 4. ModificationstoAlicanteforthe20th Century. José Guardiola Picó
Image 5. EffectsoftherapidwaterriseintheurbangullyofS.Agustín-S.BlasintheSanBlasDistrict(Alicante)duringthefloodingof20th October 1982
151
Nº 8 / 2018
RESILIENCE IN THE URBAN WATER CYCLEURBAN DRAINAGE
TherewasconsiderablymoredamageatthebeginningofSeptember1989.Inthiscase,therainfallintensityandthefactthattheprecipitationswerefall-ingdirectlyonthecityandmunicipalityofonceagaincauseddamageintheurban areas of Vistahermosa, La Albufereta and Santa Faz, because theOrgegiaandJuncaretGulliesoverflowed.TheBonhivernGullyalsoburstitsbanksandaffected theFGVrailwaystation (LaMarina train) thePostiguetareaandtheAvenidadeElche,aroundthesouthernexitfromthecity.
Table 6. PeriodsofheavyrainfloodingthecityandthemunicipalareaofAlicanteinthe20th and 21st Centuries
Date Rainfall (and intensity per hour) in mm23rd, September 1906 50 mm28th, November 1916 71 mm20th, August 1929 25.6mm(105,6mm/h)18th-19th, September 1929 51.5mm(294mm/h)25th, September 1931 34.5 mm1st, November 1934 60 mm8th, August 1945 60 mm2nd, November 1949 49.5mm(190mm/h)20th, September 1957 54.4mm(120mm/h)2nd, September 1959 46.5 mm28th-29th, September 1959 56.4&61.5mmrespectively15th, October 1962 133.8mm(305mm/h)15th, September 1963 40.9mm(150mm/h)8th, October 1966 88.5 mm4th, October 1969 65.1 mm19th, October 1972 52.7mm(210mm/h)9th, November 1978 73.3mm(208mm/h)20th, October 1982 233.1mm(180mm/h)4th, November 1987 92 mm5th, September 1989 133.6 mm30th, September 1997 270.3 mm (154.2 mm)3rd, May 1999 35 mm23rd, October 2000 55.4 mm21st, September 2007 90.4 mm11th&12th, October 2007 49.7 mm y 42.1 mm28th, September 2009 131 mm18th, November 2012 55.2 mm13th,March2017 137.4 mm (48.8 mm )
Source: AEMET.
152
Nº 8 / 2018
RESILIENCE IN THE URBAN WATER CYCLEURBAN DRAINAGE
Butitwasnotuntil30September1997thatthecityonceagainsufferedtheconsequencesofaperiodoftorrentialrain,whichcauseddamagethrough-out the urban area.On that occasion, the city registered its highest everrainfallvaluein24h.(270mm),establishingarecordforcumulativerainfallinonedayinAlicante.ThespelloftorrentialrainoccurredwhenthecarparkwasbeingconstructedintheAvda.deAlfonsoXelSabioatoneofthepointswherethecitywasspreadingoutwards.Thisprovedtobefortunateinpre-ventingevengreatereconomicdamageintheurbanareabetweentheMen-dezNuñez riverbed andCalle Angel Lozano, in the lower part of the city(ExplanadadeEspaña),becausetheexcavationworksdugtocreatethetwobasement storeys of the car park acted as a huge stormwater tank andstoppedthewaterfromflowingintothestreetsinsearchofanoutlettothesea.However,theeconomicdamagecausedbyfloodinginthebasements,garagesandshopswasconsiderable.
OneurbanareagreatlyaffectedbythedownpourwastheSanJuanBeach,especiallythespacebetweenAvda.CostablancaandAvda.deNizaalongthepromenade.Builtonwhatwasoncemarshland lyingbehind thedunecordinthatcoastalarea,thedrainageisprecariousgiventhatthereishardlyany slope to help rainwater to drain away. As a result, this entire zone ofstreets and residential estates lay submerged for several days until special emergencymeasurescouldbetakentodrainoffthetrappedwaters.LaAl-buferetawasalsobadlydamagedaftertheMaldoGullyburstitsbanks. Image 6.EffectsoftheoverflowingoftheS.Agustín-S.BlasGullyinitsfinalstretchinAvda.deÓscarEsplá,BenalúaRailwayStationandtheNationalHighway(C.N.-340),duringthefloodsof30September1997
153
Nº 8 / 2018
RESILIENCE IN THE URBAN WATER CYCLEURBAN DRAINAGE
DespitethefrequencyoffloodingandwaterloggingintheCityofAlicanteinthe1980sand,yearslater,thefloodsof30September1997,veryfewurbandrainageactivitieswereundertakeninthisperiodoftime. Infact, fromthepublicationoftheaforementionedworksbyGuardiolaPicóuntiltheAlicanteFlood-ProtectionSchemewasimplemented,onlypartialactivitieswerecar-riedouttosolvethefloodingproblem.Theywereworksongulliesmainlyin-cludedinthe1986GeneralUrbanPlanorimplementedurgentlybytheRe-gionalMinistryofPublicWorks–channellingthefinalsectionoftheOvejasGully-afterthefloodinginNovember1987.Othermeasuresremainedunim-plementedincludedasactionstobetakenintheSpanishRegionalDevelop-mentPlan1994-1999) for theAutonomousRegionofValencia (channellingtheJuncaretandOrgegiaGulliesandtheAguaAmargaGullyinthePladelaVallonga).
Thefloodsof30September1997markedaturningpointregardingmunicipalconcernoverthecity’sfloodingproblems.Thelossofthreelivesasaconse-quenceofthetorrentsflowingthroughtheurbanareapromptedtheurgentimplementation of theComprehensive Flood Prevention Plan for Alicante,drawnupjointlybytechniciansfromtheRegionalMinistryofPublicWorksandtheCityCouncilitself.ThisPlanlargelycontainedtherecommendationsgiven by Guardiola, to construct a series of “by-pass ditches to collect the waters and direct them into the sea”sotheywouldnotfloodthestreets.Inthisrespect,therearequotesfromGuardiolaPicóthatseemedtoanticipatesomeoftheactivitiesinvolvedinthisfloodpreventionPlan.Thus,whenrefer-ence ismade to theproblemofdraining theCaniciaGully in theMendezNuñezindicatestheneedtoconstruct“a very large and well-proportioned collector, into which the rainwater and excess water will flow in excellent con-ditions and in large amounts, because it would take in a large exterior zone of the population and everything on the right-hand side (towards the Este)”, whichashasalreadybeenmentioned,isoneoftheworksenvisagedintheabove-mentioned plan.
4.4. The paradigm change: from the hygienist view to flood protection and opting for environmental sustainability
The floods caused by thermal inversion on 30 September 1997broughtaboutaradicalchangeinpoliticalactivitiestodefendthecityagainstcatastrophiceventsofthistype.Infact,thecitybecameawareoftheneedtomoveonfromthe“hygienistparadigm”,i.e.,theconstructionofwastewateroutflowcollectorstothe“resilienceparadigm”tocopewiththesetypesoftorrentialrainperiods,whichledtothedesigningofanextensivenetworkoflarge-capacitycollectorstodealwiththeseurbanrunoffpeaks inthebest
154
Nº 8 / 2018
RESILIENCE IN THE URBAN WATER CYCLEURBAN DRAINAGE
waypossible.OnefinalstageinthehistoryofurbandrainageintheCityofAlicante was to opt for hydraulic “sustainability”, by developing “flexible”works for drawing off rainwater that also consider the subsequent use ofthosewatersforurbanpurposesaftertreatment.Itcanbesaidthatintwodecades,theCityofAlicanteisnowleadingthecountryinurbandrainagematters,andthatthePublicAuthorities(bothregionalandlocal)andAguasMunicipalizadas de Alicante Empresa Mixta), the company contracted tomanagethecity’sentirewatercycle,havealsoplayedanoutstandingrole,inwhatcouldbe regardedashighlyefficientcollaboration,allwithaviewtoimprovingthequalityoflifeofthecitizensintheirurbanenvironment.
4.4.1. The Flood Prevention Scheme for the City of Alicante
Afterthefloodson30September1997,theRegionalGovernmentofValenciavia itsRegionalMinistryofPublicWorks, set inmotion the “FloodPreventionSchemeforAlicante”,aprogrammethatinvolvedtheconstructionofhydraulicinfrastructuresinthecityandmunicipalareaofAlicantewithaviewtopreventing theeffectsofexceptional rainfallandflooding in thegullies inurbanareas.TheFloodPreventionSchemeforAlicanteincludedthefollowingactivitiesintheurbanareasofthecity,andwasallocatedanoverallbudgetof103millionEuros.TheRiverJucarBasinAuthorityalsocollaboratedindeve-lopingsomeoftheseworks,specificallyinchannellingtheperipheralgulliesofJuncaret-OrgegiaandLasOvejaswithinthemunicipalboundaries.
NolessimportantwastheAnti-FloodPlan,whichwaspreparedinasup-plementarycapacity.Itequippedthecitywithnewandlargecollectors(ViaParque,andsplittingofthePlacollectorandtheGeneralCollector,PlayadeSanJuan)aswellasotherfurtheractions(CanalejasSpillway,DrainingthesouthernentrancetoAlicante).Theseworkswithintheurbanareahavebeendesigned to reduce theflood risk fora50-year returnperiod.Asawhole,theAnti-FloodPlanhascreatedthebarriersrequiredtodivertandchannel thewaters from theperi-urban zones so that, on theonehand,thosewatersdonotaffectthecityand,ontheotherhand,sothatAlicantecanbeprovidedwithlargecollectorsthatcandrainawaytherainthatfallsinthecitycentre.
Alltheseactivitiestookplaceintwostages.Atthefirststage,from1997to2001, the works were focused on consolidating the city’s main drainagepointsandonremovingsomeofthemainavenuessothattheobsoletecol-lectorscouldbereplacedwithothersthathadagreatercapacity.These-condstage, from2001to2005, involvedconstructingessentialworksthatweretoformpartoftheringthatenclosedandchannelledthegullies.
4.4.2. Actions in addition to the Flood Prevention Scheme for Alicante
These FloodPreventionSchemeworks for the city andmunicipalareaofAlicanteweresupplementedwithaseriesofactivitiesdevelopedbyAlicanteCityCouncilandAguasdeAlicanteEmpresaMixta,whichincludedthefollowing:
• RenewingtheseweragenetworkworksfinancedbyAlicanteCityCounciland FEDER Funds between 1999 and 2000.
Atotalof13.6Kmofgravitycollectorswereinstalled/replaced,withdiam-eters ranging from 400 to 2,500 mm., including some rectangular sec-tions.Thepipingwasmadeofgres (stoneware) for thecollectorsup to600mmindiameter,andreinforcedconcretefortherestofthediameters/sizes.
Numeroushydraulic improvementworkswerealsoundertakenaspartoftheAguasMunicipalizadasdeAlicanteSpecialInvestmentPlan,whichwassupported by the Alicante Sewerage Master Plan; it included the mostpressingneedsforimprovingtheCityofAlicanteurbandrainagesystem.
158
Nº 8 / 2018
RESILIENCE IN THE URBAN WATER CYCLEURBAN DRAINAGE
AguasMunicipalizadasdeAlicantehasinvestedapproximately28.9millionEuros on improving and enlarging Alicante’s sewerage system within theframework of theSpecial InvestmentPlan between 2006 and the presenttime. ItconstructedtheJoséManuelObreroanti-pollutiontank in theSanGabriel district, and a series of collectors that are essential for correctlydraining away rainwater were implemented and renewed.
Aguas Municipalizadas de Alicante likewise invests nearly 2 million Euros per yearontheseweragenetworktoimplementtheimprovementsthatarere-quiredbutnotincludedintheaforementionedSpecialInvestmentPlan;thecostischargedtothefirm’sordinaryyearlyinvestments.TheconstructionoftheMarjalFloodParkandthePortseweragenetworkareamongthemoreoutstanding investments. Several improvements and enlargements to thesewerageremote-controlsystemhavealsobeenmade,inordertoimprovetheadvancedmanagementoftheurbandrainage;thesewerealsochargedtothoseinvestments.
Tosummarise,theCityofAlicanteseweragenetworkstateandcapacityhasbeencompletelychangedoverthepast20years.Allthathastobedoneistocomparethenumberofcollectorswithsizesthesameasorlargerthanonemetrethattherewerein1997(beforethe1997flood),atotalof42kilometresforatotalseweragenetworklengthof492kilometres,withthefigureforDe-cember2017,whentherewere116kilometresand798kilometres,respec-tively.Thissubstantialimprovementby74kilometresoflargecollectorsabletodrainawaythemajordischargesthataregeneratedduringtheheaviestrainfallspells,togetherwiththeextra306kilometresofnetwork,havecon-siderably improvedAlicante’s capacity to copewith this typeof situation.Proofofthisliesintheexcellentperformanceofthenetworksandtheinfra-structuresconstructedduringtherainsinMarch2017(thethirdheaviestpre-cipitationsrecordedsince1938),whenhardlyanyincidentswererecorded,andthosefewrevertedtothenormalsituationalmostimmediatelyaftertherainstopped.Ifidenticalweatherconditionshadoccurredwiththenetworksavailable in1997theconsequencesandproblemswouldhavebeenmuchworse.
This investment and improvement effortdoesnot end there. In thecomingyearsimprovementswillcontinuetobemadetothenetworksandpreparations
159
Nº 8 / 2018
RESILIENCE IN THE URBAN WATER CYCLEURBAN DRAINAGE
willbebetterorganisedtofacethenewchallengesandachievetheobjec-tivesthata21st Century city must set itself.
Figure 19. Drainage network in 1997 and 2017
Pipes with a diameter of over 1,000 mm are in red.
4.4.3. Advanced management of the urban drainage
Managementoftheseweragenetworksand,inabroadersense,theurbandrainagemanagementofourcitieshasundergonepositivechangesinrecentyears,goinghand-in-handwiththetechnicaladvancesspawnedbythetechnologicalrevolutioncommencinginthefinaldecadeofthe20th Cen-tury.Thismajortechnologicalbreakthroughthusmadeamajorchangeinthewayurbandrainagesystems in citiesare run.Theyareno longerpassivesystems,havingbecomeactiveandnowformpartofwhatisknownastheAdvanced Urban Drainage System.
AdvancedUrbanDrainagemanagementincludesnotonlythenetworkoper-atingprocesses,butalsoinvolvesandoverlapswiththeplanning,designingand construction of infrastructures.
Thedeterminantsthatunequivocallyleadtodevelopmentfromatraditionalurban drainage system to an advanced management system are associated notonlywithcitizens’ increasinglydemandingstandardsof living inurbanenvironments, but also a greater awareness about keeping up environmental quality standardsnotonlyintheurbanenvironmentbutalsointheenviron-mentthatisgoingtoreceivetheeffluentfromtheseweragesystemswhenitrain,thelatterbeingprotectedbyincreasinglystringentregulations(forex-ample,thelatestRoyalDecree1290/2014)andsocialrequirements.Further-more, thegradualagingofcityseweragenetworkscreatesnewproblemsthatgoagainstthetrendtowardsincreasedsocialandenvironmentalqualityin 21st Century towns and cities.
160
Nº 8 / 2018
RESILIENCE IN THE URBAN WATER CYCLEURBAN DRAINAGE
The challenges posed by this evolution are considerable because theyhavetocopewithmanyoftheproblemsthatarecausedbyraininourcit-ies,notonlytheblockagesinthenetworksthemselvesandintheassoci-atedinfrastructures(e.g.wastewaterpumpstationsorWWPSs),butalsothelackofcapacityinsomecollectorscausedeitherbyerrorsindesignorinsufficientmaintenanceandthegradualageingofthenetworks.Further-more,theyhavetobemoreefficienttoprotecttheenvironment,toreduceenergyconsumptionandthecarbonfootprint,andtoguaranteetheser-vicewiththegreatestpossiblecapacity,minimisingtheeffectsonnormalcity operations andon citizens’ lives (interruptions to traffic, unpleasantodours,floods,etc.).
Thetoolsavailabletothenetworkoperatorsenablingthemtoperformad-vancednetworkmanagement,arecloselylinkedtoavarietyofaspects.Suchaspectsrangefromanaccurateandexhaustiveknowledgeofthesystem,itsstateandoperation,theinteractionsbetweentheurbandrainagesystemandother associated subsystems, such as treatment plants and the receivingmedium,toreal-timemanagementorresiliencetochangingexternaldeter-minantsthatarebecomingincreasinglyrestrictive.
Twoessentialtoolsformthebasisofadvancednetworkmanagementwhenitcomestorespondingtotherequirementtobefamiliarwiththesystemandthewayitperforms.OneofthesetoolsistheGeographicalInformationSys-tem(GIS),whichenablestheusertographicallycharacterisetheseweragenetwork elements (wells, collectors, pumping stations, etc.) and to associate themaindatathroughdatabases.Theothertoolisthehydraulicmodellingsystem,whichenablestheusertoknowhowthenewnetworksareperform-ing,evenbeforetheyareconstructed,andtheirrelationshipwiththeexistingnetwork,ortocheckthegeneralperformanceoftheexistinginfrastructurewhenfacedwithdifferentrainfallevents.
Inthissense,amajorfactorthatmakeitpossibletoobtaindetailedknowl-edgeabouttherainfallthatactsontheCityofAlicanteseweragenetwork,wasthestudyconductedbyAguasdeAlicantein2003,involvingthedigi-talisationoftherainfallseriesrecordedattheCiudadJardínMeteorologicalObservatory(belongingtotheStateMeteorologicalAgencyAEMET)since1938.Theseseriesratethecumulativerainfallcontinuouslyatrainfallinter-valsofup to10minutes,andenable theuser tostudyand thenanalysestatisticsforthedatatheycontain,sothatitwillbepossibletogeneratetherainfallpatterncurvesfortheCityofAlicante.Allinall,theprocessofdigi-talisationof this rainfall involvedextracting fromdatabasesand insertingintothem,nolessthan27.624itemsofrainfalldatarecordedat10minute
Advancedmanagementalsoincludesthenetworkmaintenancearea,whichinthiscaseseekstokeeptheseweragesysteminthebestpossiblestateofrepairandoperation,optimisingmanagementofthemeansandresourcesavailable andprioritisingprevention. Tools for supporting thedecision are
162
Nº 8 / 2018
RESILIENCE IN THE URBAN WATER CYCLEURBAN DRAINAGE
neededtocarryoutthistask.Suchtoolsmustenabletheusertoknowhownetworkageingisevolvingandhowtooptimisereplacingandrepairing,aswellashow tooptimisenetworkcleaningon thebasisofhowquickly thenetworks are liable to get dirty.
Figure 22. IDFcurvefortheCityofAlicante,obtainedfromthestatisticalstudybasedontheactualdataobtainedfromtheCiudadJardínMeteorological Observatory from 1938 to 2003
0.0
50.0
100.0
150.0
200.0
250.0
5 10
15
20
25
30
35
40
45
50
55
60
65
70
75
80
85
90
95
100
105
110
115
120
I (m
m/h
)
Duration (min)
IDF Curves for the Ciudad Jardín Station (Alicante)
Whenperformingthetaskofprotectingagainstfloodriskinurbanareas,itisfirstnecessarytomaketherequiredinvestmentsintheinfrastructureformin-imising risks, and secondly, to develop comprehensive risk managementplansoradoptforecastandalertsystemsforextremeeventsthatwillstretchnetworkoperationstothelimit.
environment in dry or rainy spells. • Controloverindustrialdischargesintotheseweragenetworks.• Modellingtheperformanceofthereceivingenvironmentswhenrelieving
theseweragesystems.
AguasdeAlicantehasnowinstalledmanygaugesandsensorsinthecity’sseweragenetwork,designedtosolvetheriskmanagementproblemusingtechnologicalsystems.Thisenablesthefirmtocontrolinrealtime,thedis-chargesflowing throughand theprevailing in theurbanareaand itssur-roundings.Therefore,24rainfallgaugeshavebeeninstalled(12oftheminthecityitself)inthemunicipality,plus102limnimeters(measuringthefluidlevel)alllocatedwithintheseweragenetwork,pumpingstations,gullyriver-bedsandtheinteriornotonlyoftheinfrastructureassociatedwiththeSanGabrielAnti-DSU(AntiUnitary-SystemDischarge,inEnglish)tankbutalsotheSanJuanBeachFloodPark.
Figure 23. Spatial distribution of rain gauges (in green) andlimnimeters(inred)intheCityofAlicanteandtheIsland of Tabarca
LIMNIMETERSRAIN GAUGES
164
Nº 8 / 2018
RESILIENCE IN THE URBAN WATER CYCLEURBAN DRAINAGE
Insummary,advancedmanagementinthe21stCenturyhastobebaseduponcertaintoolsortechnologicalsystemsinordertobeabletotacklemanage-mentinamodern,sustainable,effectiveandefficientwaythatputstobestusethetechnologyandknowledgeavailable,andthismustalwaystakeplaceusinga sustainabledevelopment approach; these tools and technologicalsystems are:
• Geographical InformationSystems (GISs)andDatabases (constantlyupdated, e.g. YV camera inspections, network cleaning, etc.).
• Remotemonitoringandcontroloverinfrastructuresassociatedwiththe network (e.g. pumping stations, sluice gates, specific waterretention structures such as anti-pollution tanks, anti-flood tanks, etc.).
Allthesetoolswillcontinuetodevelopandadapttoanynewchallengesthatmighthavetobefaced.Wehavetomakeourcitiesresilient,andthismustbeassociatedwith the performance of the drainage structures, involving thewholesociety in thischallenge.From thatperspective,wecanallmakeacontribution,bynotthrowingintothelavatoryanyelementsthatmightcons-titutearisktothenetworkoperations,suchas“wipesandsanitarytowels”,
4.4.4. Singular actions: the José Manuel Obrero anti-pollution tank and the La Marjal Flood Park
Using rainwater held back in tanks or in flood parks, is an ex-tremelyinterestingwaytoalleviatethenaturalshortageofwaterresourc-esandtoincreaseMediterraneanareas’resiliencetothepotentialeffectsof climate change. Further advantageswould have to be added to thispossibility,includingthefactthatsuchresourcesarerenewable,theycanbeobtainedlocally(whichsolvestheproblemofconflictsbetweenterrito-riesovertheuseofresources),access(initiallythisisfreeofcharge)andrelatively easy availability, as long as they are adopted on a domesticlevelandassociatedwithwater-harvestingstrategiesandsustainableur-ban drainage.
AguasdeAlicantehasdeveloped twoconstructionsof thisnature in theCityofAlicante thathavecometoepitomisegoodurbanrunoffmanage-mentpracticeandthepotentialuseofrainwater.TheJoséManuelObrerotankintheSanGabrieldistrictandtheLaMarjalFloodParkintheurbanpartoftheSanJuanBeach.Withthesedevices,notonlydoestherunofffromtheheavyrainsthatfallonthecityhelptoincreasethewaterresourc-esavailablebutalsohelpstoreducetheriskofflooding.Furthermore,thereistheenvironmentalbenefitofthesedevicespreventingtherainwaterfromcleaningthealreadypollutedstreets,andthustemporarilyincreasingpol-lutionandcontaminatingthebeachesbylettingthewaterflowtherewithoutbeingtreatedfirst.Thisisamajorfactorifonetakesintoaccounttheeco-nomicimportanceofthe“sunandbeachtourism”thatissohighly-deve-loped inmany cities on theSpanishMediterraneanCoast, including theCity of Alicante.
José Manuel Obrero Anti-Pollution TankAsisthecasewithmostofourcities,theseweragenetworkshaveapre-dominantlyunitaryoperation,i.e.,oneinwhichtherainwaterhastoflow
166
Nº 8 / 2018
RESILIENCE IN THE URBAN WATER CYCLEURBAN DRAINAGE
out through the samecollectors as thewastewater. There are severaldrawbackstothissystem,themainonebeingthefactthatitisimpossi-bletoseparatethetwowatertypes,rainandwaste,oncetheyhavemin-gled.
Until thewatertypesarecompletelyseparated, i.e.,therainwaterflowsthroughcertaincollectorsandthewastewaterthroughothers,thesitua-tion in most of our cities will carry on causing problems. However, we can mitigatetheseproblemsbyconstructingretentioninfrastructuresthatareabletotemporarilystorelargevolumesofwater,whileatthesametimebeingcapableofholdingbackmostoftheentrainmentthatisgeneratedinsidethecollectorsduringarainyperiod,hencethename“anti-pollu-tion” or “Anti-DSU” (Anti Unitary-SystemDischarge, in English) that isgiventotanksliketheoneconstructedintheCros–SanGabrielDistrict,by Aguas de Alicante between summer 2009 and April 2011.
TheCros–SanGabrielAnti-PollutionTank,alsoknownasthe“IngenieroJoséManuelObrero”Tank, inhonourofoneofthepeoplewhoworkedhardesttoensurethatthistankwouldnowbecomeareality,hasastor-age capacity of 60,000 cubic metres (20 Olympic swimming pools), lies undertheJuanAntonioSamaranchSportsComplex,andsinceAutumn2011hasmadeamajor contribution to reducing theoutflows from thesewerage network to theOvejasGully. In the past 5 years,more than2,000,000cubicmetresofwaterhavebeencollected in this tank.Thishasnotonlypreventedthewaterfromflowingintothegully,buthasalsoenabledittobesentlittlebylittletothetreatmentplantaftereachrainyspell,soitcanbeusedfor irrigationorwateringthegreenareasofthecity.
This type of infrastructures has innumerable high-technology facilitiesanditemsofequipment,becauseeverythingisremotelycontrolled,anditoperatesaroundtheclock,everydayoftheyear,alwayspreparedtocomeinto operation whenever it is needed. The equipment includes, amongotherelements,20hydraulicpumpsfordrivingorextractingthebuilt-upwaterwith an installed capacity of 500KW, extraction turbines and airrenewalwithacapacityfor36,000m3/hour,9water-levelgauges,16gasdetectors, sluicegates, tankswith regeneratedwater for cleaning, fire-fighting systems, switchboard and remote-control rooms, an 880KVAtransformerroom,550KVApowerunit,etc.
La Marjal Flood Park Onotheroccasionstheproblemstobesolvedarenotcausedbyunitary-systemnetworks,wecansometimesfindthatcollectorsoverfloworthereislocalfloodingwithseparaterainwaternetworks.Thisisthecasewiththezoneknownas“Hoyo1”closetothe“AlicanteGolf”GolfCourse,ontheSanJuanBeach inAlicante.Before theLaMarjalParkwasconstructed,floodingusedtotakeplaceowningtothelackofcapacityofalltherainfallcollectorsinthezone,whichoftenfilledrightupduringdownpourswhich,togetherwithitslocationinarelativelylow-lyingzone,madeitdifficultforsurfacerunofftoflowawaydowntheroads,leadingtolocalfloodinginthevicinity.
Apartfromfulfillingthishydraulicfunction,theParkplaysanimportantsocialand environmental role, as it is a recreational zone. It is also a new green zone withalargenumberofplantspeciesandfauna,makingitanidealspotandavery pleasant place to visit.
4.4.5. Flood risk diagnosis for the City of Alicante: the very rainy spell on 13th, March 2017
Completed in2005, theseriesofworks included in theAnti-FloodPlanforthecityandmunicipalityofAlicante(constructionoflargecollectors)andthesupplementaryactionsdevelopedsubsequentlymanagedtoconsid-erably reduce the risk of flooding.Only onedownpour in situwith a levelgreater than400mm. ina2-hourperiod,which felldirectlywithin thecityboundaries,managedtoexceedthecapacityoftherainfalloutflownetworkinstalled. Itwasaprecipitationvolumeunregistered in theCityofAlicantesincemeteorologicalrecordswerefirstkept(1855).AlthoughsuchquantitiescouldhavefallenbeforeinotherSpanishMediterraneanzones,wheretherearerecordsofsimilarvolumesfallinginlessthan6hours.
171
Nº 8 / 2018
RESILIENCE IN THE URBAN WATER CYCLEURBAN DRAINAGE
SincethefloodsofSeptember1997,theCityofAlicantehadnotexperiencedaspellwithsuchlargeamountsofrainconcentratedinashortperiodthatcouldput to the test theurbandrainageworksdeveloped in thepast twodecades.InMarch2017,onthe13th,aspelloftorrentialrainfellontheCityofAlicanteandtherestofthemunicipality.Itwasasingularphenomenongiventhatsucheventsdonotnormallyoccur in thewintermonths.However, itsoriginsmustbeexplainedwithinthecontextofaratherexceptionalAutumn-Winter2016-17alongtheSpanishMediterraneanCoast,especiallythesouth-ernpart,whichhadunusuallyfrequentspellsoftorrentialrain(Malaga,Mur-cia,Alicante,southofValencia).Thiswasaconsequenceofanatmosphericreadjustmentdue to thecompletionofavery intenseElNiñoevent in thePacificOceanand thebeginningof apositivephase in theNorthAtlanticoscillation,whichwasconducivetoarecurrenceofsituationsofgreatinsta-bilityinthatpartofSpain.
Allinall,althoughtheperiodoftorrentialrainthatfellonMarch13th 2017 did notreachtherainfallamountrecordedinOctober1982andSeptember1997,itwasthethirdhighestvalueforrainfallin24hoursevertoberecordedintheCityofAlicante,withanoutstandinghourlyrainfallintensity;thismadeitsuf-ficienttoanalysetheeffectivenessofthedrainageactivitiesperformedinthecity since 1997.
TheAlicanteObservatoryitself(CiudadJardín)recordedavolumeof136.6litres per square metre throughout the whole day. However, the rainfallreacheditspeakbetween18and21h.onthatday,whichwaswhen70%ofthetotalrainrecordedfell.
Precipitation 00-06 h (mm) Precipitation 06-12 h (mm) Precipitation 12-18 h (mm) Precipitation 18-24 h (mm)
Source: AEMET. Ciudad Jardín Observatory (Alicante).
173
Nº 8 / 2018
RESILIENCE IN THE URBAN WATER CYCLEURBAN DRAINAGE
The rainfall values recorded in 24hours in thedistrict at other stationsbelonging to amateurs (AVAMET7, Meteoclimatic8)orofficialpublicbod-ies,butnotincorporatedintotheAEMETobservatorynetwork,werealsoveryhigh:
• San Vicente del Raspeig: 171 litres per square metre.• Climate Laboratory (University of Alicante): 200 litres per square metre.• Agost: 139.3 litres per square metre.• Alicante (Cabo de las Huertas): 134 litres per square metre.• Alicante(SanJuanBeach):138litrespersquaremetre.• San Joan d´Alacant: 127 litres per square metre.
Theareathatyieldedthehighestconcentrationofprecipitationsandhourlyintensityontheafternoonof13March,wasalongthestriprunningfromtheCityofSanVicentedelRaspeig-SanJoand´Alacant-SanJuanBeach.Con-siderabledamagewascaused inthisstripof land,especially theareabe-tween San Joan d´Alacant and the San Juan Beach, mainly due to localhomes,buildingsandshopsbeingflooded.TheamountofwaterrecordedcausedspecialproblemsinthezonebetweentheHospitaldeSanJuanandthe“Hoyo1”urbanareaneartheSanJuanBeach,andthecoastalstripoftheSanJuanBeach,tothenorthoftheAvenidadelaCostaBlanca.
Theanti-pollution tank in theSanGabrieldistrict reached itshighesteverlevelasaresultofthatrainyspell,whichmeantthatthestructuremanagedto store 60,000 m3ofwatersforthepurposeforwhichitwasdesigned,sothatamountdidnothavetoflowoutintothereceivingenvironment.
Furthermore,theLaMarjalFloodParkontheSanJuanBeachwentintoop-eration at 18:00 on 13/03/2017, and the filling process was completed at22:30hours.Thetotalvolumeofwaterstoredinthisinfrastructurereached15,500 m3,approximately35%ofitstotalstoragecapacity,whichisthemax-imumamountithasheldbacksinceitcameintooperationin2015.
Itmustbepointedout thatduringtheheavyrainfallspellon13thMarch2017 therewere no problems orwarnings associatedwith theway thehydraulic infrastructureoperated in the zonesconsidered tobeproble-matic.
Insummary,thespellofheavyraininMarch2017revealedthequalityoftheseworksthatpreventedmajordamagetothecityanditssurroundingarea.However,itbecameapparentthattheoutflowoffloodwatersattheentrance to theAvda. deDenia (former layout of theBonHivernGully)requires larger spillways under the TRAMbridge, near thePlazaMar 2ShoppingCentre.Thisperiodofrainalsoconfirmedthattheurbansectoraround theAvda.deMiriamBlasco inLaCondominaneedswork tobedonetomitigatethewaterlogginglevelreachedwhenitrainsmorethan30mm. in1hour. Furthermore, the flooding that tookplace for severaldaysafter the rainfall in theSanJuanBeachareabetweenPlazade laCoruña,theGlorietadelaDemocraciaandtheAvda.deNiza,willmakeitnecessarytotakefurtheractionstoremovetherainwaterinanareathatiscomplexbecauseofitssurfacelayout(formermarshland)andproxim-ity to sea level.
4.5. Future urban drainage challenges. Urban Sustainable Drainage Systems as measures for adapting to climate change
Climatechangeisoneofthebiggestchallengesthaturbandrain-agewillhavetocopewithinthecomingyears.Theoreticallyclimatechangeisduetobothnaturalandanthropogeniccauses,but theUnitedNationsFrameworkConventiononClimateChangeusestheterm“climatechange”toreferonlytochangesbroughtaboutbyhumans,suchasindustrialisationorurbanplanning(whichinvolvegreateruseoffossilfuelsfordomesticair-conditioning,anincreaseinimpervioussurfaces,areductioninthenumberof natural water masses and vegetation loss).
Rainfallpatternschangesaredifficulttopredictexactlyandwillvaryfromone region to another. However, it is expected that the changes will begreaterindryareasandthattheareassusceptibletostormyweatherwillhavetofacemoresevereevents(IPCC2007;NCA2009).
Therefore,itwouldappeartobenecessarytopredictthemagnitudeoftheef-fectsofclimatechangeonthehydrologicalcycleinordertobeabletodesigndrainagesystemsadaptedto the future.Adaptingthesesystemscannotbebasedexclusivelyonconstructingaconventionalinfrastructure(enlargingcol-lectors,constructingcontainmenttanks,etc.),becausethiscouldproveeco-nomicallyunfeasibleformostcitiesandmaynotbethemostsustainablesolu-tion.Insuchcases,alternativetechnologiessuchasnature-basedsolutionsorSustainableUrbanDrainageSystems(SUDS)shouldalsobeconsidered.
Nature-based solutions generally involve the sustainable use andmanage-mentofnaturetodealwithsocialchallengessuchasclimatechange,watermanagement,foodsecurityanddisaster-riskmanagement.Forexample,pro-tectingmangrovesidcoastalzonescouldlimittheriskoferosionassociatedwithextremeweatherconditions,whileatthesametimeprovidingfishfarmsforproducingfish to feed the local inhabitantsandcaptureCO2.Along thesame lines, green roofs or walls could be used in building construction, to cool
176
Nº 8 / 2018
RESILIENCE IN THE URBAN WATER CYCLEURBAN DRAINAGE
down urban areas in summer, capture rainwater, reduce pollution and increase the inhabitants’welfare,whilesimultaneously improvingthebiodiversityandconnectingcitieswithamoreextensiveecosystem.
Whenattempting tominimise thenegativeeffectsofclimatechangeon theenvironmentandpeople’shealthandwelfare, territorial andurbanplanningstrategiesmustpayspecialattentiontotheclimateinformationandthedistri-butionofthelandintodifferentusesandactivities.Theobjectiveshavetoin-cludepredictingandpreventingthedeteriorationofnaturalresources,endeav-ouring to make better use of them and adapting cities to the bioclimaticcharacteristicsofthezone.Inthissense,theNationalClimateChangeAdapta-tion Plan proposes several actions including: developing and promoting bio-construction,especiallyforallpublicbuildings,orassessingtherequirementsofspeciesandvarietiesofvegetationinparksandgardensindifferentclimatechangescenarios,becausegreenspacescouldbecomeincreasinglyimpor-tant,especiallyforcounteractingtheeffectsoftemperatureincreases.
SustainableUrbanDrainageisoneofthealternativestotheconventionalap-proachthatdoesmuchmorethanmerelymitigatefloodingandmanagethequalityofurbanrunoffwater.SUDScanbedefinedasessentialpartsoftheinfrastructure(urban-hydraulic-landscape)whosepurposeistomakeupfortheeffectsthatconstructionandwaterproofingcitieshaveontheamountofrainwaterrunoffgeneratedanditspollutionlevel,bydrawingitoff,retainingitorfilteringitintotheground,sothatitdoesnotundergoanydeterioration,andevenenablingthegroundtonaturallyremoveatleastsomeofthecon-taminant loadthat itmighthaveacquiredduringthepreviousurbanrunoffprocesses.Allthisisdoneinanattempttoreproduceasaccuratelyaspos-sible,thenaturalhydrologicalcyclebeforeurbanisationorman’sactivities.ThereareseveralSUDStypes,includingthefollowing:greenroofsoreco-logicalcover,permeablepaving,filtrationstripsordrains,greenroadsides,containment tanks, retaining stations, wetlands, etc.
Image 13.ExamplesofSUDS
To the left, La Marjal Flood Park in Alicante; in the centre, an example of the green roofing of Chicago City Council and on the right a green roadside. Source: AIRCUD (Aqualogy International Research Centre for Urban Drainage)
• Reducingthe“heatisland”effectincities,counteractingthetemperatureincreasecausedbyasphaltandconcretesurfaces.Ithasbeendemons-trated that the temperature in parks of only 1-2 hectares can be 2ºCcoolerthantheadjacentbuilt-upzones.
Suchexampleinclude:theuseofartificialwetlandsandponds,whichcanbeputnotonlytorecreationaluse,butcanalsoservetopreventhighertem-peraturesbecause thewatermasses reduce heat; bioretention areas thatstorewateronthesurfacethatlaterevaporates,whichcanalsoservingasameans for heat control; or vegetation cover, which contributes to the so-called“oasiseffect”inthecities.Allofthisnotonlyprovidesvegetationandisconducivetobiodiversity,butalsohelpstocutdownontheamountspentonair-conditioningthebuildings.Plantsplayaninsulatingrolesothatcentralheatingandair-conditioningarelessnecessary,reducingenergyconsump-tionandenergybillsthatwouldincreasewithhottercities.
Finally, it isadvisabletogiveafewexamplesofbenefitsobtainedbysuchmeasures: it hasbeencalculated that “NewYork’sHeat IslandReductionInitiative”,whichfocusesonincreasingtheamountofvegetation,especially
178
Nº 8 / 2018
RESILIENCE IN THE URBAN WATER CYCLEURBAN DRAINAGE
throughvegetationcover,wouldreducetheheatislandeffectinthecityby0.88ºC if50%ofNewYork’sflat roofswerecovered ingreenery.AnotherexampleisPhiladelphia(CityofPhiladelphia,2009),whereithasbeenesti-matedthemanagementof50%oftheimpermeableurbansurfaceareawithSUDSwouldprovidethecitywithanincomeofaround2.8billiondollarsby2049, thanks to the improvement inairandwaterquality,creating recrea-tionalzonesandreducingthetemperatureinthecity.
Therefore,ithasbeendemonstratedthatNature-BasedSolutions,ingen-eral, and Sustainable Urban Drainage Systems, in particular, are a viable alternativewhenitcomestofacinguptoclimatechangechallengesthat,ashasbeenshown,willaffect(andarealreadyaffecting)themanagementoftheurbanwatercycle,byprovidingsolutionsandserviceswithequivalentorsimilarbenefitstoconventionalinfrastructures.Inviewofthis,citiesmusttakesuchsolutionsintoaccountnow,sothatinthefuturetheywillberesil-ient cities.
ItmaysoundstrangetomentionthissituationintheconclusionstoastudydevotedtotheimpactofclimatechangeintheMediterranean,butitshouldberememberedthatallthedescriptionsclearlydescribetheclimateinCapeTownasbeing“Mediterranean”.Aswehaveseen,theMediterraneanBasinisoneof theareas in theworldwhere it isestimated thatclimatechangecouldmanifestitselfmostclearlyinthecomingdecades,withanincreaseinextreme temperature and rainfall events (droughts and torrential rainfall).CouldCapeTownbeanearly-warningsignofthefuturethatawaitsus?
Notnecessarily.Ifwedigmoredeeplyintothecomparisonwecomeupwithasurprise:themeanannualprecipitationsinthecapitalofSouthAfricarangefrom515mmto1,310mm(thisvariationismainlyduetothemajordifferencesbe-tweenthecoastalandmountainouszones).Therefore,wearetalkingaboutanannualrainfallthatismuchgreaterthanAlicante’sandcouldquadrupleitsvalues(about300mm).So,intermsofrainfall,AlicantecouldtheoreticallyrepresentthefutureforCapeTown,ratherthantheotherwayaround. Infact,accordingtoseveral studies (e.g., Robert I. McDonald et al.2014),mostofthelargecitiesintheworldatriskofawatercrisiswouldlieinzoneswheretheavailabilityofre-sourcesismuchgreaterthanonthesouth-eastcoastoftheIberianPeninsula.
• Makingawholehearteddecisiontoreuseresourcesforbothurbanandagricultural purposes,which has alsomade it possible to improve thecityenvironmentbyincreasinggreenzonesatacostmuchlowerthanforotherhydraulicinfrastructures.
Although it is true to say that in this case there have also been sucheventsinthepast,itisnotpossibletorefertoanymajorurbandrainageactivities before 1997. However, after that yearmany plans have beencoherentlyimplementedthathavetackledthechallengeofdrainingawayrainwater:
• RegionalGovernmentofValenciaFloodPreventionScheme.• Supplementary actions taken by AlicanteCouncil to assist the Flood
Plan.• Aguas Municipalizadas de Alicante Special Investment Plan, including
the JoséManuel Obrero Anti-Pollution Tank and the LaMarjal FloodPark.
• Ordinary investment works and network replacement works, implemen-ted by Aguas de Alicante.
181
Nº 8 / 2018
RESILIENCE IN THE URBAN WATER CYCLEURBAN DRAINAGE
Onceagain,itisnecessarytomentionthattheproblemhasbeentackledinamultifacetedway:noneoftheseactionswouldhavebeenusefulbyitselftosolveanyfloodrisk.Strengtheningthesecondarydrainageworkisnei-thermore or less important than constructing large collectors, becausewithoutsuchdrainagethewaterisnotcollectedandneitherdoesitreachthosecollectors; and theyareobviouslynecessary tobeable to findanoutlet for the large volume of water collected. Moreover, none of thosemeasureswouldhavebeensufficientinthecaseoftheSanJuanBeachiftheFloodParkhadnotbeencreated.Furthermore,advancedmanagementtechniques (modelling, gauging, sewerage renewal assistance systems,early-warningsystems,etc.)areanessentialsupplementtotheinfrastruc-tures.
Theongoingnatureof theflood-risk implementationstrategieshasbeenvitalhere,albeitinaperiodoftimeshorterthantheperiodforimplementingthewaterresources;thepasttwentyyearshavebeenwitnesstoconstantandsustainedevolutionwhere thecity’sdrainage is concerned, and themost recent landmark in thisdevelopmenthasbeen theLaMarjalFloodPark.
Thelattercreation isan indicationofthedirectionthatsustainableurbandrainagesystemswillprobablytakeinthecomingdecades,alsofollowingthemodeladoptedinothercountries.Theexamplesofprioritiesandinitia-tivesindifferentcitiesallovertheworldcanundoubtedlyhelpuswhenitcomes to finding solutions adapted to our situation.Without ceasing toconstructothernecessary infrastructures—therearenomagicsolutionshere—greaterimportancewilldefinitelybeattachedtosuchconstructions,andasisthecasewithreusedwaterforurbanuse,theywillcontributetochangingthecity’sprofileforthebetter.Thattriplealliancebetweenresi-lience,sustainabilityandqualityoflife,undoubtedlyseemstobethepathtofollowwhenfacinguptothechallengescausedbyclimatechange.
182
Nº 8 / 2018
RESILIENCE IN THE URBAN WATER CYCLEINDEX OF ILLUSTRATIONS
6. INDEX OF ILLUSTRATIONS
Tables
Table1.ChangesintheclimatevariablesintheSpanishMediterraneanregions 2100 time frame ......................................................................119
Table3.SummaryoftheeffectsofglobalwarminginSpanish MediterraneanRegionsforthepurposeofwaterplanninginurban areas .....................................................................................................124
RESILIENCE IN THE URBAN WATER CYCLEINDEX OF ILLUSTRATIONS
Figure6.HowrainfallhasevolvedintheAutonomousRegionofValencia.2100 time frame ...................................................................................123
Figure7.EvolutionofWaterResourcesfromdesalinationintheCanales del Taibilla Association supply system, from 2003 to 2015 .................127
Figure11.Technical-hydraulicperformanceinAlicanteandby Autonomous Regions ...........................................................................132
Figure 14. Double Urban Network of reused water in Alicante ...................135
Figure15.Evolutionofurbanuseofregeneratedwaterandgrowth of green zones ......................................................................................136
Figure16.MapshowinghowtheCityofAlicanteevolvedupuntilthe18th Century .................................................................................................145
RESILIENCE IN THE URBAN WATER CYCLEINDEX OF ILLUSTRATIONS
Figure22.IDFcurvefortheCityofAlicante,obtainedfromthestatisticalstudybasedontheactualdataobtainedfromtheCiudadJardínMeteorological Observatory from 1938 to 2003 ..................................162
Figure 23. Spatial distribution of rain gauges (in green) and limnimeters (inred)intheCityofAlicanteandtheIslandofTabarca ......................163
Image1.Constructionofrainwatertanksbeneatharecreationalzone (public park) in Rotterdam. ...................................................................109
Image2.Urbaneffectofthe“heatisland”.Impactofthegreenzonesonmitigating it. ..........................................................................................137
Image 3. Palmeral Park, Alicante ................................................................141
Image4.ModificationstoAlicanteforthe20th Century. José Guardiola Picó ......................................................................................................149
Image5.EffectsoftherapidwaterriseintheurbangullyofS.Agustín-S. BlasintheSanBlasDistrict(Alicante)duringthefloodingof20 October 1982 .......................................................................................150
Image 7. Replacing general collector for Section I - Driving Ø2500 under theGranVía ..........................................................................................157
185
Nº 8 / 2018
RESILIENCE IN THE URBAN WATER CYCLEINDEX OF ILLUSTRATIONS
The source of the illustrations is AMAEM in all cases where it is not specified to the contrary
186
Nº 8 / 2018
RESILIENCE IN THE URBAN WATER CYCLEBIBLIOGRAPHY
7. BIBLIOGRAPHY
AEMA (2012). Los impactos del cambio climático en Europa: evaluation basa-da en indicadores.InformeconjuntodelaAEMA,CCIandOMS.Oficinade Publicaciones de la CE and Ministerio de Medio Ambiente, Medio Rural y Marino, Madrid, 240 pp.
AEMET (2015. Proyecciones climáticas para el siglo XXI en España. Available at: http://www.aemet.es/es/serviciosclimateticos/cambio_climatet
Andrés-Doménech,J.;Hernández-Crespo,C.;Martín,M.&Andrés-Valeri,V.C.(2018). “Characterization ofwash-off from urban impervious surface andSuDS design criteria for sourcw control under semi-arid conditions”. Scien-ce of the Total Environment, 612, pp. 1320-1328.
Arahuetes,A.(2017).Los recursos no convencionales en el metabolismo hí-drico del litoral de la provincia de Alicante.DoctoralThesis.UniversidaddeAlicante(unpublished).
Arnbjerg-Nielsen,K.;Willems,P.;Olsson,J.;Beecham,S.;Pathirana,A.;Gre-gersen, I.B.;Madsen,H.&Nguyen,V.T.V. (2013).“Impactsofclimatechangeonrainfallextremesandurbandrainagesystems:areview”.Wa-ter Sci Technol., 68(1), pp. 16-28.
Ayala-Carcedo, F. J. (2000). “La ordenación del territorio en la prevención de catástrofesnaturalesytecnológicas.Basesparaunprocedimientotécni-co-administrativo de evaluación de riesgos para la población”. Boletín de la Asociation de Geógrafos Españoles,30(monográficosobre“RiesgosNaturales”), pp. 37-49.
Ayala-Carcedo,F.J.(2002).“Elsofismadelaimprevisibilidaddelasinunda-cionesylaresponsabilidadsocialdelosexpertos.Unanálisisdelcasoespañol y sus alternativas”. Boletín de la Asociation de Geógrafos Espa-ñoles, 33, pp. 79-92.
BañosCastiñeira,C.J.;VeraRebollo,J.F.&DíezSanto,D.(2010).“Elsumi-nistro de agua en los espacios y destinos turísticos de Alicante y Murcia”, Investigaciones Geográficas, 51, pp. 81-105.
Barredo,J.I.,Saurí,D.&Llasat,M.C.(2012).“AssessingtrendsininsuredlossesfromfloodsinSpain1971-2008”,Natural Hazards and Earth Sys-tem Science, 12 (5), pp. 1723-1729.
Barton,J.&Irarrázabal,F.(2016).“Adaptaciónalcambioclimáticoygestiónderiesgosnaturales:buscandosíntesisenlaplanificaciónurbana”.Re-vista de Geografía de Norte Grande, 63, pp. 87-110.
Burriel, E. L. (2009). “Los límites del planeamiento urbanístico municipal. El ejemplo valenciano”, Documents d’Anàlisi Geogràfica, 54, pp. 33-54.
Butler,D.&Davies,J.W.(2000).Urban drainage.London,UK:E&FNSpon,624 pp.
Calvo García-Tornel, F. (2001). Sociedades y territorios en riesgo. Barce-lona, Editions del Serbal, Colection “La Estrella Polar”, 31, Barcelona, 186 pp.
Castro-Fresno, D.; Andrés-Valeri, V. C.; Sañudo-Fontaneda, L. A. & Rodrí-guez-Hernández,J.(2013).“SustainableDrainagePracticesinSpain,es-pecially focused on pervious pavements”. Water, 5, pp. 67-93.
CIRIA (2000). Sustainable Urban Drainage Systems – Design Manual for Scot-land and Northern Ireland, CIRIA C521 and Sustainable Urban Drainage Systems –DesignManualforEnglandandWales,CIRIAC522.
Connolly,R.&Connolly,M.(2014).“UrbanizationbiasI.Isitanegligiblepro-blem for global temperature estimates?”, Open Peer Rev. J., 28 (Clim. Sci.), URL: http://oprj.net/articles/climate-science/28
Consorcio de Compensación de Seguros (2016). Estadística de Riesgos Ex-traordinarios. Serie 1971-2016. Madrid, 147 pp.
Consorcio de Compensación de Seguros (2017). Guía para la reducción de la vulnerabilidad de los edificios frente a las inundaciones. Madrid, MA-GRAMA, MINECO and Consorcio de Compensación de Seguros, 103 pp.
ElorrietaSanz,B.;OlcinaCantos,J.&SánchezAguilera,MªD.(2016).“Lasos-teniblidadenlaplanificationterritorialdeescalaregionalenEspaña:estu-dio de casos”, Cuadernos Geográficos, 55 (1), pp. 149-175.
ESPON Climate. (2011). Climate Change and Territorial Effects on Regions and Local Economies. Main Report. Available at: http://www.espon.eu/export/sites/default/Documents/Projects/AppliedResearch/CLIMATE/ESPON_Climate_Final_Report-Part_B-MainReport.pdf.
Fernández,A.E.;Perales,S.&Domenech,I.(2008).“Lossistemasurbanosdedrenajesostenible(SUDS)enlahidrogeologíaurbana”. IX Simposio de Hidrogeología. AEH-IGME,AtElche,1.
GilOlcina,A.&OlcinaCantos,J. (2017).Tratado de climatología. Alicante. PublicationsoftheUniversidaddeAlicante,945pp.
Gil-Guirado,S.;Pérez,A.&Barriendos,M. (2014). “Increasingvulnerabilitytoflooding in thesouthernSpanishMediterraneancoast (1960-2013)”,Hydrological Extreme events in historic and prehistoric times, Bonn (Ger-many). At http://bit.ly/1tmAbNm
GonzálezGarcía,J.L.(ed.)(2009).Mapas de riesgos naturales en la orde-nación urbanística.Madrid.IlustreColegioOficialdeGeólogos.101pp.
IntergovernmentalPanelonClimateChange, IPCC (2014).Climate Change 2013 and Climate Change 2014. Available at: http://www.ipcc.ch/
JRC (2009). The PESETA project. Impact on climate change in Europe. Euro-pean Commission. Available at http://peseta.jrc.ec.europa.eu/
JRC (2017). Atlas of the Human Planet 2017. Global Exposure to Natural Ha-zards.EuropeanCommission.DGJoinResearchCenter.Ispra.92pp.
March,H.;Hernández,M.&Saurí,D.(2015).“Percepciónderecursoscon-vencionales y no convencionales en áreas sujetas a estrés hídrico: elcaso de Alicante”, Revista de Geografía Norte Grande, 60, pp. 153-172.
Marcos-García,P.&Pulido-Velázquez,M.(2017).“Cambioclimáticoyplanifi-caciónhidrológica:¿Esadecuadoasumirunporcentajeúnicodereduc-ción de aportaciones para toda la demarcación?”, Ingeniería del Agua, 21,1, pp. 35-52.
Melgarejo-Moreno, J. & López-Ortiz,M. I. (2016). “Purificación y reuso deaguas en España”, Agua y Territorio, 8, pp. 22-35, July-December 2016, Universidad de Jaen.
MinisteriodeVivienda&ColegioOficialdeGeólogos(2008).Riesgos Natu-rales. Guía Metodológica para la elaboración de cartografías en España. Madrid, 176 pp.
Monjo,R.&Martín-VideJ.(2016).“Dailyprecipitationconcentrationaroundtheworldaccordingtoseveralindices”,International Journal of Climato-logy. DOI:10.1002/joc.4596.
Observatorio de la Sostenibilidad de España (2012). Atlas de la sostenibilidad en España.AlcaládeHenares.ObservatoriodelaSostenibilidadenEs-paña, Ministerio de Medio Ambiente.
Olcina Cantos, J. (2007). Riesgo de inundaciones y ordenación del territorio en España.Murcia,InstitutoEuromediterráneodelAgua,381pp.
Olcina Cantos, J. (2009). “Hacia una ordenation sostenible de los territorios deriesgoenEuropa”,Farinós,J.;Romero,J.&Salom,J.(eds.),Cohesión e inteligencia territorial. Dinámicas y procesos para una mejor planifica-tion y toma de decisiones,Publicationsof theUniversitatdeValencia,Valencia, pp. 153-182.
OlcinaCantos, J. (2013). “Experiences inadapting toClimateChangeandClimate Risk in Spain”, Climate Change Adaptation in practice: from stra-tegy development to implementation (Philipp Schmidt-Thome and Jo-hannesKlein,eds.),Wiley-Blackwell,pp.253-268.
OlcinaCantos,J.&Díez-Herrero,A.(2017).“CartografíadeinundacionesenEspaña”, Estudios Geográficos, 78 (282), pp. 283-315.
OlcinaCantos,J.;HernándezHernández,M.;RicoAmorós,A.M.&MartínezIbarra,E.(2010).“IncreasedriskoffloodingonthecoastofAlicante(Re-gion of Valencia, Spain)”, Natural Hazards, 10 (11), pp. 2229-2234.
OlcinaCantos,J.;BañosCastiñeira,C.&RicoAmorós,A.M.(2016).“Me-didasdeadaptaciónalriesgodesequíaenelsectorhotelerodeBeni-dorm (Alicante, España)”, Revista de Geografía Norte Grande, 65, pp. 129-153.
OlcinaCantos,J.&RullánSalamanca,O.(2017).“Consecuenciasambienta-les de la actividad económica”, Geografía Humana de España / Romero, J.(coord.),Ed.TirantLoBlanch,pp.526-641.
OlcinaCantos,J.&Vera-Rebollo,J.F.(2016b).“ClimatechangeandtourismpolicyinSpain:DiagnosisintheSpanishMediterraneanCoast”,Cuader-nos de Turismo de la Universidad de Murcia, 38, pp. 565-571.
OlcinaJ.;SauríD.,Hernández,M.&Ribas,A.(2016).“FloodpolicyinSpain:areviewfortheperiod1983-2013”,Disaster Prevention and Management: an International Journal, 25 (1), pp. 41-58.
Olcina, J.;Morote, A. &Hérnandez,M. (2018). “Evaluación de los riesgosnaturales en las políticas de ordenación urbana de los municipios de la provincia de Alicante. Legislación y cartografía de riesgo”, Cuadernos Geográficos de Granada (in press).
Paneque,P.(2015).“DroughtmanagementstrategiesinSpain”,Water, 7, pp. 6689-6701.
Pastor,F.;Valiente,J.A.&Palau,J.L.(2017).“SeasurfacetemperatureintheMediterranean climatology, trends and spatial patterns” poster presen-ted at 10th Hymex Workshop in Barcelona (4-7 July 2017), http://www.ceam.es/VERSUS/publications.html
Perales-Momparler, S.; Andrés-Doménech, I.; Hernández-Crespo, C.;Vallés-Morán, F.; Martín, M.; Escuder-Bueno, I. & Andre, J. (2017).“The roleofmonitoring sustainabledrainagesystems forpromotingtransition towards regenerative urban built environments: a study in theValencianRegion,Spain”,Journal of Cleaner Production, 163, pp. S113-S124.
PérezMorales,A.;Gil-Guirado,S.&Olcina-Cantos,J.(2015).“Housingbu-bblesandtheincreaseoffloodexposure.Failuresinfloodriskmanage-mentontheSpanishsouth-easterncoast(1975-2013)”,Journal of Flood Risk Management (DOI: 10.1111/jfr3.12207), pp. 1-12.
PerlesRoselló,M.J.&CantareroPrados,F.(2010).“Problemasyretosenelanálisisdelosriesgomúltiplesdelterritorio:propuestasmetodológicaspara la elaboración de cartografías multi-peligros”. Boletín de la Asocia-tion de Geógrafos Españoles, 52, pp. 245-271.
Rico-Amoros,A.;Olcina-Cantos,J.&Sauri,D.(2009). “Tourist Land Use Pa-tternsandWaterDemand.EvidencefromtheWesternMediterranean”, Land Use Policy, 26, pp. 493-501.
Rodríguez-Rojas,M.I.;CuevasArrabal,M.M.;MorenoEscobar,B.;MartínezMontes,G.&MuñozUbiña,A. (2017).Guía para la integración de los Sistemas Urbanos de Drenaje Sostenible en el Proyecto Urbano. Editorial Universidad de Granada, 132 pp.
RougéP.&HernándezF.(2016).“Elcostedenoregenerar”.Lareutilizacióndel agua en el marco de la economía circular, Asociación Española de Desalination y Reutilización – Asociation Española de Suministro de Agua y Saneamiento.
Saurí, D.,Olcina, J.,March,H.,Martín-Vide, J., Vera, F., Padilla, E. &Se-rra-Llobet, A. (2011). “Case Study Mediterranean Coast of Spain”, in ES-PON Climate: Climate Change and Territorial Effects on Regions and Lo-cal Economies.Appliedresearchproject2012/1/4.FinalReport.Annex4. Available at: www.espon.eu/export/sites/default/Documents/Projects/AppliedResearch/CLIMATE/ESPON_Climate_Final_Report_Annex4_Spain_Case_Study.pdf.
Saurí,D.;Olcina,J.;Vera,J.F.;Martín-Vide,J.;March,H.;Serra-Llobet,A.&Padilla,E.(2013).“Tourism,climatechangeandwaterresources:coastalMediterraneanSpainasanexample”.In:Schmidt-Thome,Phi-lipandGreiving,Stefan(coords.)Schmidt-Thome,PhilipandGreiving,Stefan (coords.): European Climate Vulnerabilities and Adaptation: A Spatial Planning Perspective,Willey,pp.231-252.
Schmidt-Thomé,P.(edit)(2005).The spatial effects and management of natu-ral and technological hazards in Europe.Luxembourg.ESPON,(thematicproject 1.3.1.) (available at: www.espon.eu).
Serrano Notivoli, R. (2017). Reconstrucción climática instrumental de la preci-pitación diaria en España: ensayo metodológico y aplicaciones. Doctoral Thesis,unpublished.UniversidaddeZaragoza.FacultaddeFilosofía yLetras. Departamento de Geografía y Ordenación del Territorio. Zarago-za,234pp.+anexocartográfico.
Shaltout,M. &Anders,O. (2014). “Recent sea surface temperature trendsandfuturescenariosfortheMediterraneanSea”,Oceanologia, 56 (3), pp. 411-443.
Stern, N. (2006). The Economics of Climate Change: The Stern Review. Cam-bridge. Cambridge University Press.
Vargas,J.&Paneque,P.(2017).“MethodologyfortheanalysisofcausesofdroughtvulnerabilityontheRiverBasinscale”,Natural Hazards. 13 pp. DOI: 10.1007/s11069-017-2982-4
Vera Rebollo, J. F. (2006). “Agua y modelos de desarrollo turístico: la nece-sidad de nuevos criterios para la gestión de los recursos”, Boletín de la Asociation de Geógrafos Españoles, 42, pp. 155-178.
VeraRebollo,J.F.&RodríguezSánchez,I.(eds.)(2012).Renovación y res-tructuración de destinos turísticos en áreas costeras, Valencia, Publica-tions of Universitat de València, 429 pp.
Villar-García,A.(2016).“Reutilizacióndeaguasregeneradas:aproximaciónalos costes de producción y valoración de su uso”. Agua y Territorio, 8, pp. 70-79, July-December 2016, Universidad de Jaén.
WorldHealthOrganisation (WHO)RegionalOffice forEurope (2016).Urban green spaces and health. A review of evidence, pp. 9-11.
WorldMeteorologicalOrganization,CentreforResearchontheEpidemiologyof Disasters (CRED) &UNIVERSITÉCATHOLIQUEDELOUVAIN (2014). Atlas of Mortality and Economic Losses from Weather, Climate and Water Extremes 1970-2012.Geneva,Switzerland:WMO.
Prieto,F.;Campillos,M.&Fontcuberta,X.(2010).“Cambiosenlaocupacióndel suelo en España 1987-2005”, Ecologista, 65, pp. 40-43.
Wood-Ballard,B.;Kellagher,R.;Martin,R.;Jeffenes,C.;Bray,R.&Sheffer,P.(2007). The SuDS Manual. CIRIA C697. London.
193
Nº 8 / 2018
RESILIENCE IN THE URBAN WATER CYCLEAUTHORS
AUTHORS
JORGE OLCINA CANTOSProfessorofRegionalGeographicalAnalysisattheUniversidad de Alicante andHeadoftheUniversidad de AlicanteClimateInstitute.CurrentlyChair-manoftheSpanishAssociationofGeographers
ANDRÉS CAMPOS ROSIQUETechnicalOfficeProjectEngineer(Aguas de Alicante)
IGNACIO CASALS DEL BUSTOR&D&IManager(Aguas de Alicante)
JUAN AYANZ LÓPEZ-CUERVOProduction Manager (Aguas de Alicante)
MIGUEL RODRÍGUEZ MATEOSOperations Manager (Aguas de Alicante)
RESILIENCE IN THE URBAN WATER CYCLE. RAINFALL EXTREMES AND ADAPTING TO CLIMATE CHANGE IN THE MEDITERRANEAN AREA
In collaboration with:
Jorge Olcina Cantos, Andrés Campos Rosique, Ignacio Casals del Busto, Juan Ayanz López-Cuervo, Miguel Rodríguez Mateos, Montse Martínez Puentes
Joaquín Marco Terres, Agustín Plaza Martínez, José Ramón Moya Botella, Luis Cutillas Lozano
Nº 8
8JUNIO 2018
Autores: Jorge Olcina Cantos, Andrés Campos Rosique, Ignacio Casals del Busto, Juan Ayanz López-Cuervo, Miguel Rodríguez Mateos, Montse Martínez PuentesOtras colaboraciones: Joaquín Marco Terres, Agustín Plaza Martínez, José Ramón Moya Botella, Luis Cutillas Lozano"* )
RESILIENCIA EN EL CICLO URBANO DEL AGUA. EXTREMOS PLUVIOMÉTRICOS Y ADAPTACIÓN AL CAMBIO CLIMÁTICO EN EL ÁMBITO MEDITERRÁNEO
En colaboración con:
8
Nº 8
8JUNIO 2018
Autores: Jorge Olcina Cantos, Andrés Campos Rosique, Ignacio Casals del Busto, Juan Ayanz López-Cuervo, Miguel Rodríguez Mateos, Montse Martínez PuentesOtras colaboraciones: Joaquín Marco Terres, Agustín Plaza Martínez, José Ramón Moya Botella, Luis Cutillas Lozano"* )
RESILIENCIA EN EL CICLO URBANO DEL AGUA. EXTREMOS PLUVIOMÉTRICOS Y ADAPTACIÓN AL CAMBIO CLIMÁTICO EN EL ÁMBITO MEDITERRÁNEO
En colaboración con:
Nº 8
8JUNE 2018
Authors:
Other collaborators: "* )
RESILIENCE IN THE URBAN WATER CYCLE. RAINFALL EXTREMES AND ADAPTING TO CLIMATE CHANGE IN THE MEDITERRANEAN AREA
In collaboration with:
Jorge Olcina Cantos, Andrés Campos Rosique, Ignacio Casals del Busto, Juan Ayanz López-Cuervo, Miguel Rodríguez Mateos, Montse Martínez Puentes
Joaquín Marco Terres, Agustín Plaza Martínez, José Ramón Moya Botella, Luis Cutillas Lozano